On this page
- Introduction
- What Just Happened — The Numbers Behind the Flagpole
- The Chart Pattern: A Bullish Pennant on the Daily Timeframe
- Entry Zone: $320 – $333.94
- Target 1: $531.77 – $532.21
- Target 2: $635.09 – $635.80
- The Broader AI Infrastructure Story — Why Dell Has an Edge
- Key Levels Summary Table
- Three Scenarios to Watch
- Final Thoughts
- Related Articles
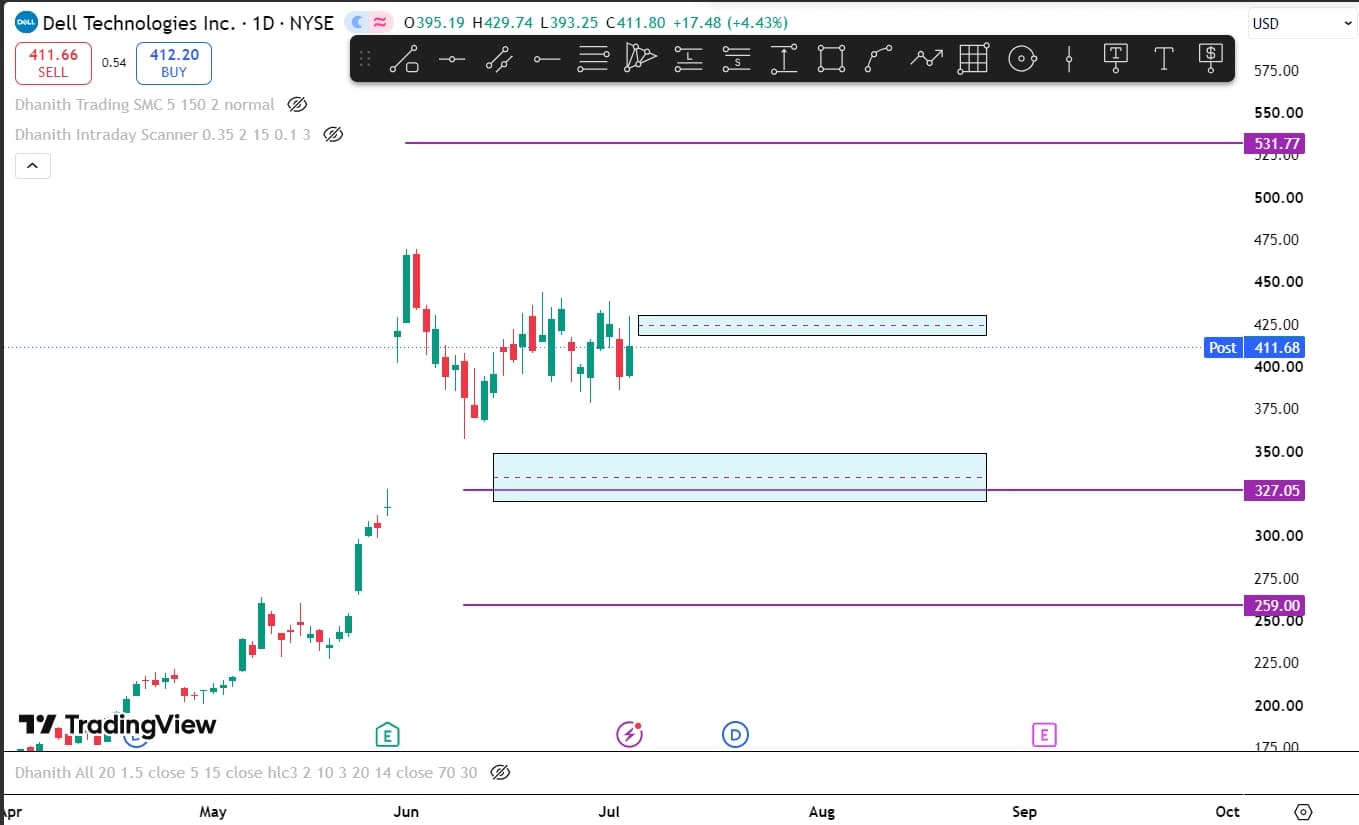
Dell stock price prediction July 2026 — pennant pattern forms after 757% AI server surge. Entry $320–$334, Target 1 $531, Target 2 $635 on daily chart analysis.
Introduction
Dell Technologies (NYSE: DELL) is setting up one of the most textbook-clean continuation patterns on the daily chart right now — and the fundamental story backing it is equally extraordinary.
After one of the most explosive single-day earnings moves in recent US stock market history, DELL has been consolidating into a pennant formation on the daily timeframe. The flagpole that created this pennant? A 32.76% single-day surge on May 29, 2026 — Dell's best day ever as a public company — triggered by earnings that genuinely stopped the market cold.
This article breaks down the full technical picture using the Dhanith Trading daily chart analysis for July 2026: the pennant pattern, the entry zone, Target 1, and Target 2 — alongside the real numbers behind why this setup has fundamental backing that most chart patterns never get.
Disclaimer: This article is for educational and informational purposes only. It does not constitute financial or investment advice. Always do your own research and consult a licensed financial advisor before making any investment decisions. Trading stocks involves significant risk of capital loss.
What Just Happened — The Numbers Behind the Flagpole
Before explaining the chart, the fundamental context is essential — because the sharp vertical move (the flagpole) on DELL's daily chart is not a random spike. It is backed by one of the strongest quarterly earnings prints from any large-cap US company in years.
On May 29, 2026, Dell reported Q1 FY2027 earnings that stopped the market cold. AI-Optimized Server revenue hit $16.1 billion in a single quarter — up 757% year over year. The company booked $24.4 billion in total AI orders and raised its full-year AI server revenue forecast to $60 billion.
Dell stock surged 32.76% that day — its best single day since returning to the public market in 2018. Shares are now up 234% in 2026.
Total Q1 FY2027 revenue came in at $43.8 billion, up 88% year over year. Full-year revenue guidance was raised to roughly $167 billion at the midpoint — up nearly 50% year over year. Full-year non-GAAP EPS guidance was set at $17.90 at the midpoint, up 74% year over year.
These numbers explain the flagpole. A 32% single-day move on genuine, broad-based fundamental acceleration is exactly the kind of catalyst that creates a high-quality pennant setup — because the underlying thesis is real and the trend is institutional, not speculative.
The Chart Pattern: A Bullish Pennant on the Daily Timeframe
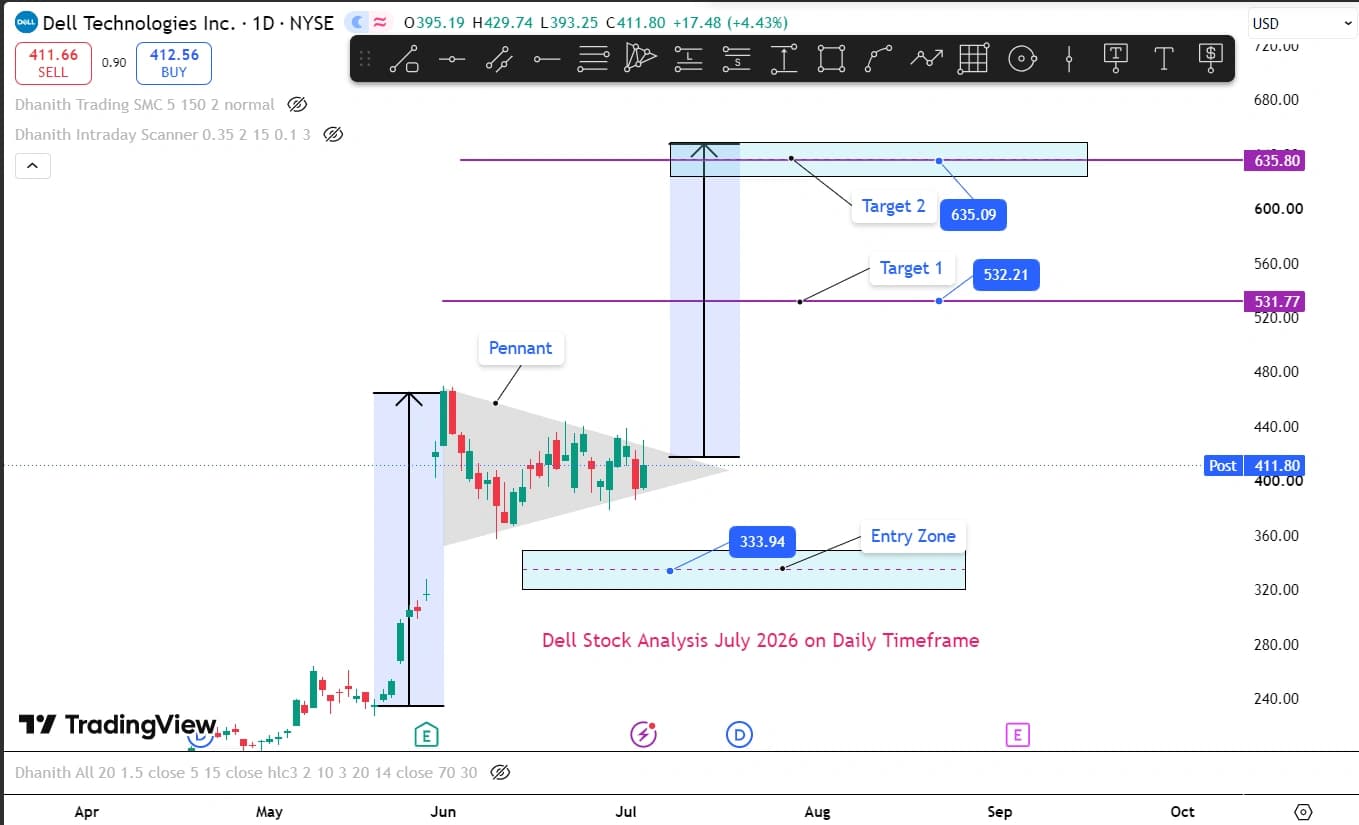
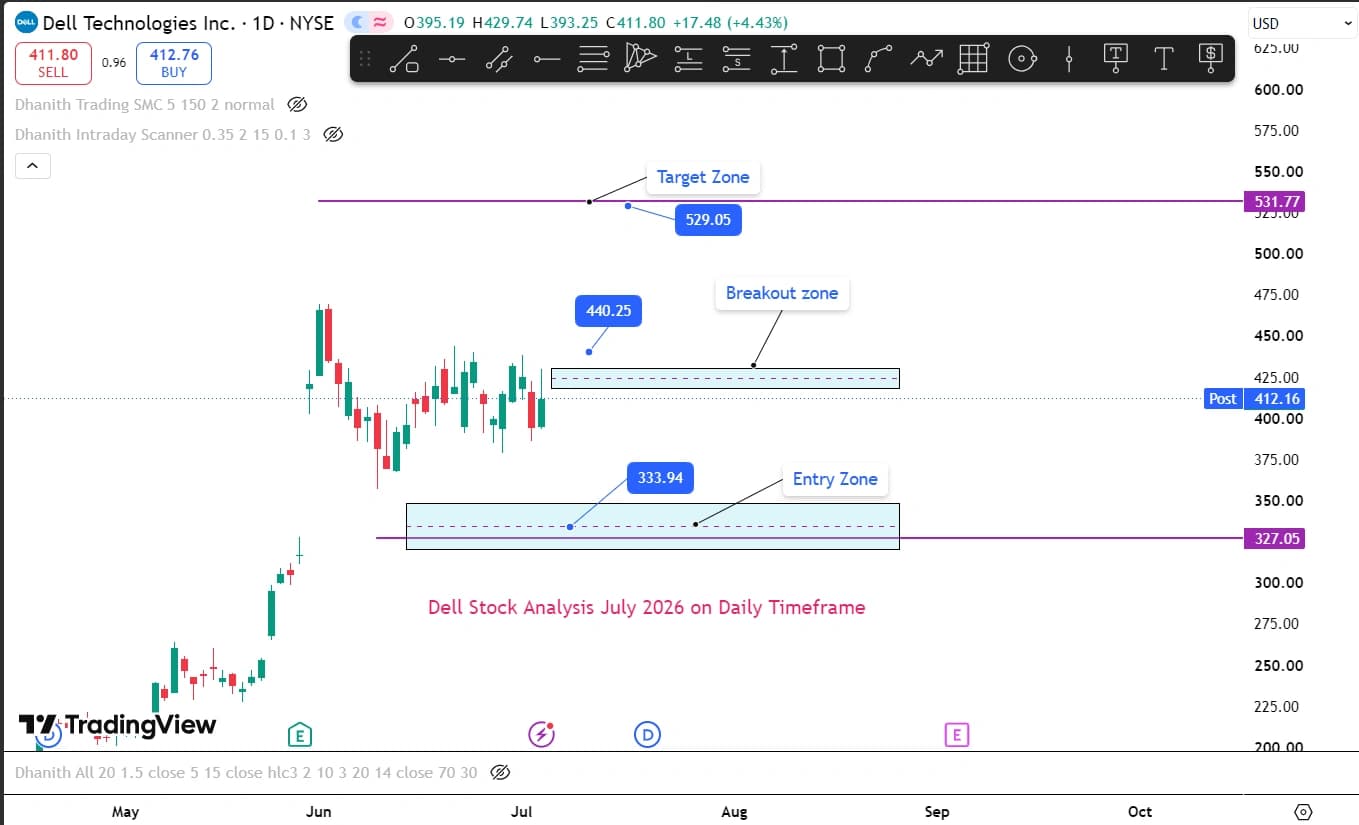
The Dhanith Trading daily chart analysis for July 2026 identifies a clear bullish pennant forming on DELL's daily chart — a textbook continuation pattern that forms when a sharp, high-volume move (the flagpole) is followed by a tight, converging triangular consolidation (the pennant) before the trend resumes in the same direction.
Reading the chart:
The flagpole is the sharp, nearly vertical move visible in late May — the earnings-day surge from the pre-earnings base zone all the way up to the $460–$470 area. This is the strong, impulsive move that defines the entire pattern. High volume, steep angle, driven by a genuine catalyst — a textbook quality flagpole.
The pennant is the converging triangular consolidation that has formed since then — lower highs meeting higher lows, visibly squeezing price into a tighter range, with declining volume throughout. The converging grey triangle on the chart is exactly what a bullish pennant looks like: price compressing like a coiled spring as early profit-takers sell and new buyers patiently accumulate.
Currently trading at $411.80 (with a post-market reading of $411.80), DELL sits inside the pennant's consolidation zone — exactly where the pattern calls for price to be at this stage.
The breakout from a bullish pennant is expected to occur upward — in the same direction as the original flagpole — and the measured-move target is the flagpole's height projected forward from the breakout point. The chart annotates this projection as the large vertical blue arrow extending from the pennant's apex toward the target zones.
Entry Zone: $320 – $333.94
The entry zone marked on the Dhanith Trading chart sits at approximately $320 to $333.94 — the blue demand zone box visible on the daily chart.
This zone represents the key structural support area where institutional buyers would be expected to step in if DELL retraces further before breaking out — or where new long positions could be initiated on any deeper pullback toward this level.
The $333.94 label marks the upper reference of this demand zone, extending down to approximately $320 at the floor.
Why this level matters: This demand zone sits approximately 19–23% below the current price. For a stock up 234% year-to-date with a 32% single-day move as the catalyst, this represents a meaningful but structurally coherent retracement area — the kind of level where the original post-earnings buyers would step back in to defend positions.
For traders: A pullback into the $320–$334 zone with a confirming bullish daily candle — hammer, bullish engulfing, or a strong close off the zone's lower boundary — would represent the highest-conviction, best-risk-reward long entry on the current daily chart. Stop goes below the zone's floor (~$317–$319). Risk is clearly defined. Reward points to both targets.
Target 1: $531.77 – $532.21
The first target level marked on the chart is $531.77 to $532.21 — the lower purple horizontal line representing the first significant supply zone above current price.
From the current price of $411.80, Target 1 represents an upside move of approximately 29%. From a pennant breakout entry in the $420–$435 range, the move to Target 1 is approximately 22–26%.
This level has independent validation beyond the pennant's own measured-move math:
The current consensus price target from MarketBeat sits at $490.38. 24/7 Wall St.'s optimistic scenario places DELL at $502.66 over the next 12 months. Both of these analyst targets sit below the $531.77 Target 1 — but given that most of these projections were calculated before the 757% AI server quarter was fully absorbed into consensus models, the $531 level represents where the next wave of analyst upgrades is likely to anchor as the AI infrastructure story continues to compound.
For traders: Target 1 at $531–$532 is the first profit-taking reference — scale out a significant portion of the position here. The $531.77 purple line on the chart marks a clear institutional supply zone where overhead resistance is meaningful.
Target 2: $635.09 – $635.80
The second target level marked on the chart is $635.09 to $635.80 — the upper purple horizontal line and the full measured-move objective for the pennant pattern.
From the current price of $411.80, Target 2 represents an upside move of approximately 54%. This is the complete flagpole height projected upward from the pennant's breakout point — the standard pennant measured-move formula applied to the May earnings flagpole.
To understand why $635 is not an unreasonable long-term target, consider the fundamental backdrop:
Dell's full-year FY2027 AI server revenue guidance stands at $60 billion — up 144% year over year. Total company revenue guidance is $167 billion at the midpoint, up nearly 50% year over year. Non-GAAP EPS is guided at $17.90, up 74% year over year.
Dell's Infrastructure Solutions Group alone delivered $60.8 billion in full-year FY2026 revenue, up 40% year over year, with AI-optimized server revenue growing 166% to $24.7 billion in FY2026.
A company growing revenue at 50% annually, with AI server revenue growing at 144%, guided to $17.90 in non-GAAP EPS — trading at a price implying a P/E of roughly 35x those earnings at the $635 target — is not structurally expensive by AI infrastructure peer standards. The $635 target is the chart's full measured-move projection, and the fundamentals give it a reasonable foundation.
For traders: Target 2 at $635–$636 is the full measured-move objective. The practical approach for most traders: scale out the majority of the position at Target 1 ($531), then run a smaller trailing position toward Target 2 with a stop moved to entry or better — capturing the full move if it materializes while protecting the majority of gains if it does not.
The Broader AI Infrastructure Story — Why Dell Has an Edge
Dell's position in the current AI infrastructure cycle is structural, not cyclical. Every major AI model deployment — whether at a hyperscaler, a government entity, or an enterprise data center — requires the physical server infrastructure that Dell dominates.
A 757% year-over-year jump in AI server revenue is the kind of number you see once in a technology cycle. For reference, the iPhone did not drive that kind of growth even in its peak years. Dell is a hardware company. When a hardware company reports 757% year-over-year AI revenue growth, it means enterprises are buying AI infrastructure at a scale that shows up in manufacturing backlogs, supply chains, and earnings calls — not just in press releases and product announcements.
Wall Street analyst sentiment reflects this conviction: 18 Buy ratings, 7 Hold, and just 1 Sell from 26 analysts currently covering the stock.
The pennant on the daily chart is simply price digesting a genuine structural shift. The consolidation is healthy. The pattern is clean. The fundamentals are real.
Key Levels Summary Table
| Level | Price | Significance |
|---|---|---|
| Current Price | $411.80 | Inside pennant consolidation |
| Entry Zone (upper) | $333.94 | Demand zone — pullback entry |
| Entry Zone (lower) | ~$320.00 | Demand zone floor |
| Target 1 | $531.77 – $532.21 | First supply zone / first profit target (~29% upside) |
| Target 2 | $635.09 – $635.80 | Full pennant measured move (~54% upside) |
| Pattern | Bullish Pennant | After May 29 earnings flagpole |
| Timeframe | Daily | Dhanith Trading — July 2026 analysis |
Three Scenarios to Watch
Scenario 1 — Pennant Breakout (Primary Bias): DELL completes the pennant, breaks out upward on expanding volume, and runs toward Target 1 at $531–$532. After consolidating near Target 1, a second leg carries the stock toward Target 2 at $635. This is the pattern's statistically favored resolution, backed by the fundamental AI momentum.
Scenario 2 — Deeper Pullback Into Entry Zone: Before breaking out, DELL retraces into the $320–$334 entry zone — potentially driven by broader market weakness or sector rotation. The demand zone holds, buyers step in, and the pennant resolves upward from a lower starting point. This scenario creates a better-risk-reward entry with a tighter stop, and the two targets remain unchanged.
Scenario 3 — Bearish Breakdown (Low Probability): A sustained close below the $320 demand zone floor on heavy volume, combined with a genuine deterioration in AI infrastructure demand or Dell's execution, would invalidate the bullish thesis. Given the $60 billion AI server backlog and FY2027 guidance, this is the lowest-probability scenario on the current evidence.
Final Thoughts
Dell Technologies has permanently re-rated. A company delivering 757% AI server revenue growth in a single quarter, guiding to $167 billion in total FY2027 revenue, and raising EPS guidance by 74% — is not the same company that was trading at $200 eighteen months ago.
The daily chart reflects this structural shift in one of the cleanest continuation setups visible in the current US market: a genuine, catalyst-driven flagpole, a tight pennant consolidation with declining volume, an entry zone for patient buyers at $320–$334, and two clearly defined targets — Target 1 at $531 and Target 2 at $635 — derived from the pattern's own measured-move projection.
Watch the pennant's upper converging boundary for the breakout signal. When price closes above it on volume, Target 1 at $531 becomes the first conversation. Target 2 at $635 is the second.
Disclaimer: This blog post is for educational and informational purposes only and does not constitute financial or investment advice. The chart levels, price targets, and pattern analysis discussed here are based solely on technical pattern reading and publicly available analyst and company data. Stock prices are inherently volatile and unpredictable. Always conduct your own due diligence and consult a qualified financial advisor before making any investment decisions. Past performance does not guarantee future results.
Related Articles
- Pennant Pattern: How to Identify Bull & Bear Pennant — The exact continuation pattern behind this Dell setup, explained with entry, stop loss and target rules
- Technical Analysis Mastery: The Complete Guide — The broader chart-reading framework this analysis is built on
Have a question about this article?
Comment on our latest Instagram post or send us a DM — we reply to every one.
@dhanith_officialWas this article helpful?
Click to rate
Founder, Dhanith Trading
7+ years trading Nifty, Bank Nifty, NSE stocks, and commodities — specializing in Smart Money Concepts (SMC) and ICT price action. Founder of Dhanith — a trading journal, intraday screener, and risk tools platform built for retail traders.
Dhanith Newsletter
Enjoyed this article? Get more like it.
New trading guides, candlestick patterns, SMC strategies, and tool updates — straight to your inbox. Free, for Indian traders.
No spam. Unsubscribe anytime.
Continue Reading