On this page
- Introduction
- What Is a Pennant Pattern?
- Why Pennants Form — The Psychology
- Pennant vs Flag vs Symmetrical Triangle — The Critical Difference
- How to Identify the Flagpole
- How to Identify the Pennant — 5-Point Checklist
- How to Trade the Pennant Pattern
- Entry
- Stop Loss
- Measured Move Target
- Bull Pennant vs Bear Pennant — Comparison Table
- Pannents Trading Examples — NSE India, Crypto, and USA
- Example 1 — Crypto: Bitcoin (BTC/USDT) — Bearish Pennant
- Example 2 — USA: Apple (AAPL) — Bullish Pennant
- Common Pennant Pattern Mistakes — And Exact Fixes
- Final Thoughts
- FAQ
- Related Articles
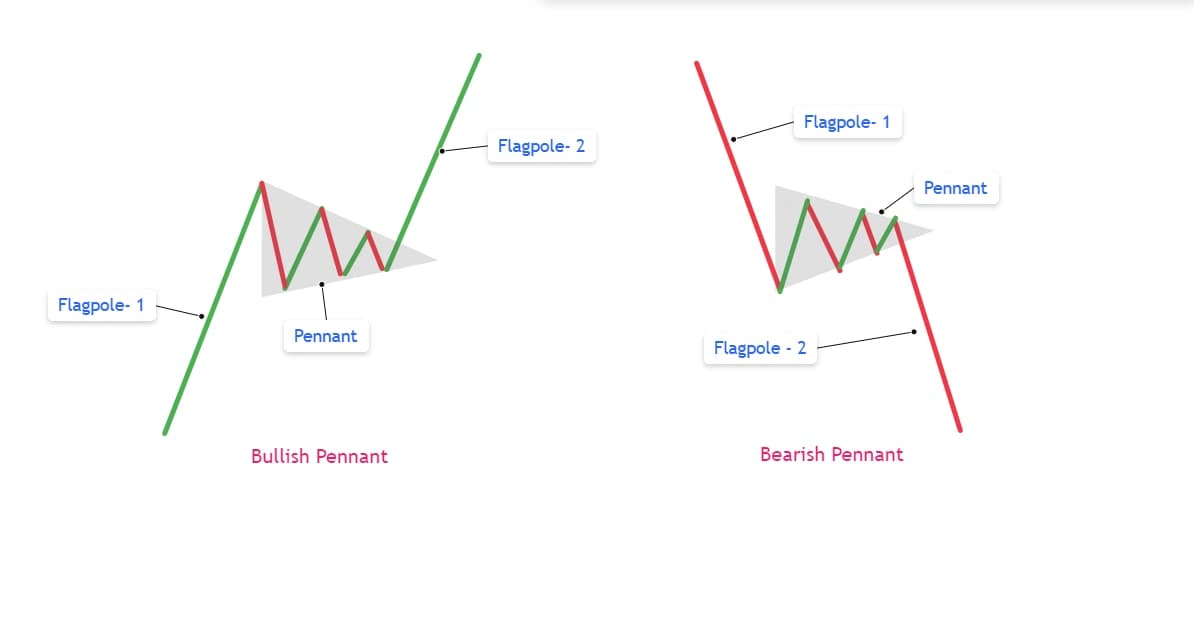
Learn how to identify and trade the pennant pattern — bull pennant, bear pennant, flagpole, volume rules, and measured move target with NSE India, crypto and US examples.
Introduction
Picture a stock that just made a sharp, near-vertical move — three or four explosive candles on heavy volume, the kind of move that immediately catches a momentum trader's attention. Then, just as quickly, it stops. Not reversing — just pausing. Candles get smaller. Volume dries up. Price starts coiling into a tight, narrowing triangle that looks like it could snap at any moment.
That tight coiling structure is the pennant. And the snap, when it comes, typically resumes the original direction with comparable force.
The pennant pattern is a short-term continuation pattern that forms after a sharp directional move (the flagpole), consolidates briefly in a converging triangle (the pennant), and then breaks out in the same direction as the original move. It is closely related to the flag pattern but structurally distinct — and that distinction matters for how you trade it.
This guide covers both types completely: the bullish pennant and the bearish pennant — what they look like, why they form, how to identify them with a five-point checklist, the exact entry and stop-loss rules, how to calculate the measured-move target from the flagpole, how the pennant differs from the flag and the symmetrical triangle, and three worked examples from NSE India, Ethereum, and the US market.
What Is a Pennant Pattern?
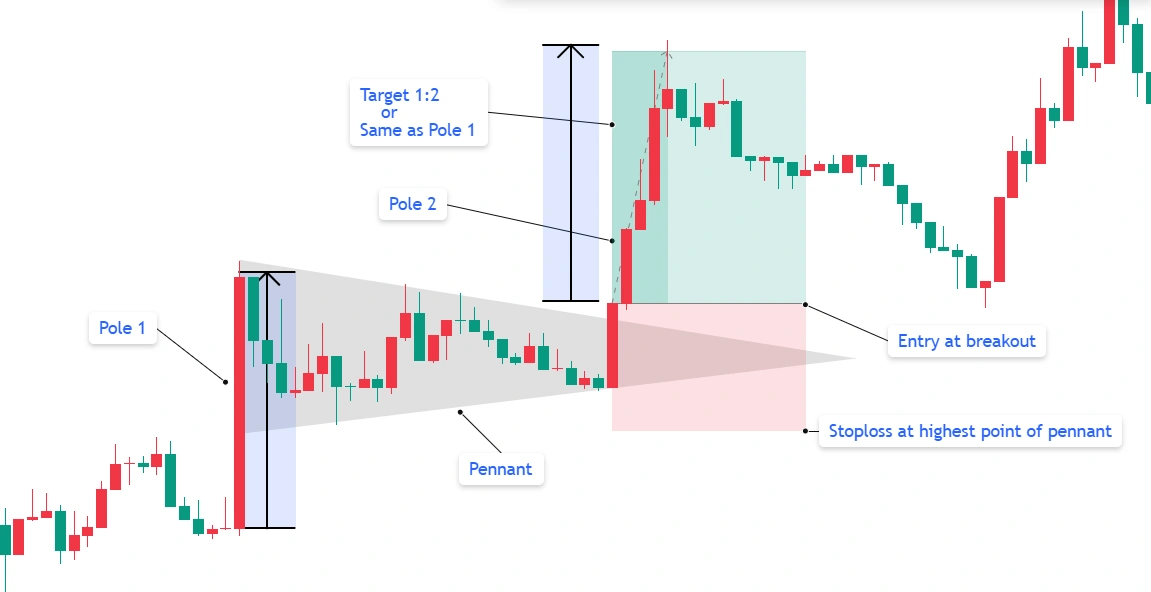
A pennant pattern is a short-term continuation chart formation consisting of three phases:
Phase 1 — The Flagpole: A strong, sharp, nearly vertical directional move — upward for a bullish pennant, downward for a bearish pennant — driven by high volume and genuine momentum.
Phase 2 — The Pennant: A brief consolidation shaped like a small symmetrical triangle. The trendlines converge — lower highs meeting higher lows — as volatility contracts and volume dries up.
Phase 3 — The Breakout: Price breaks out of the converging triangle in the same direction as the original flagpole, typically on expanding volume, resuming the prior trend.
Two types:
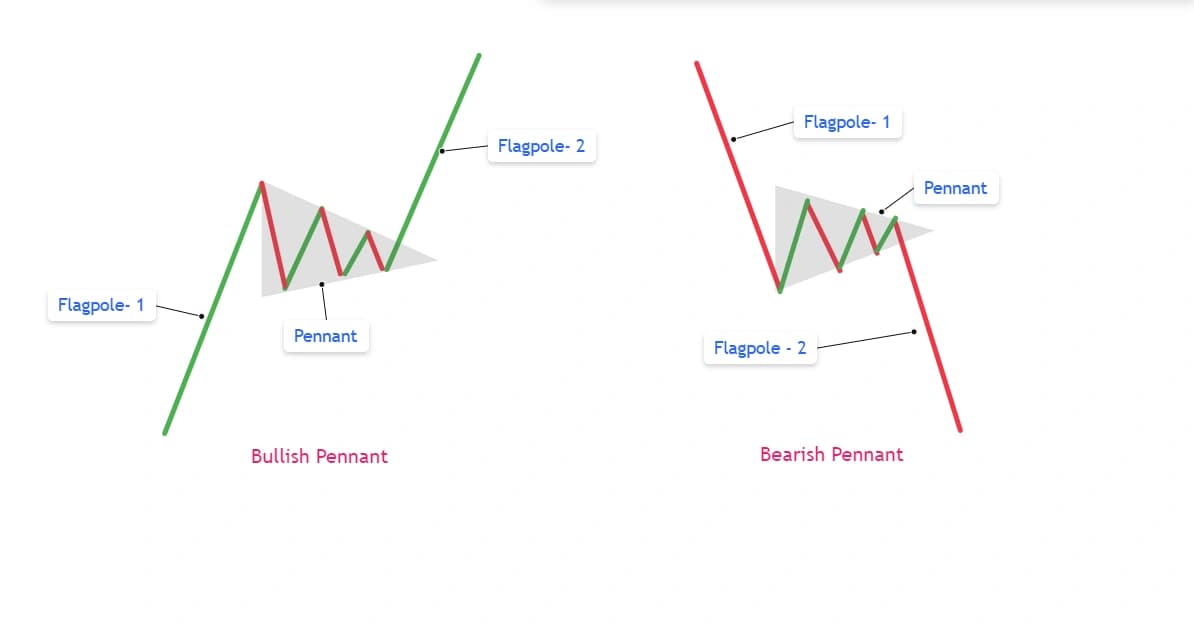
- Bullish Pennant: Flagpole is upward, pennant consolidates into a converging triangle, breakout continues upward
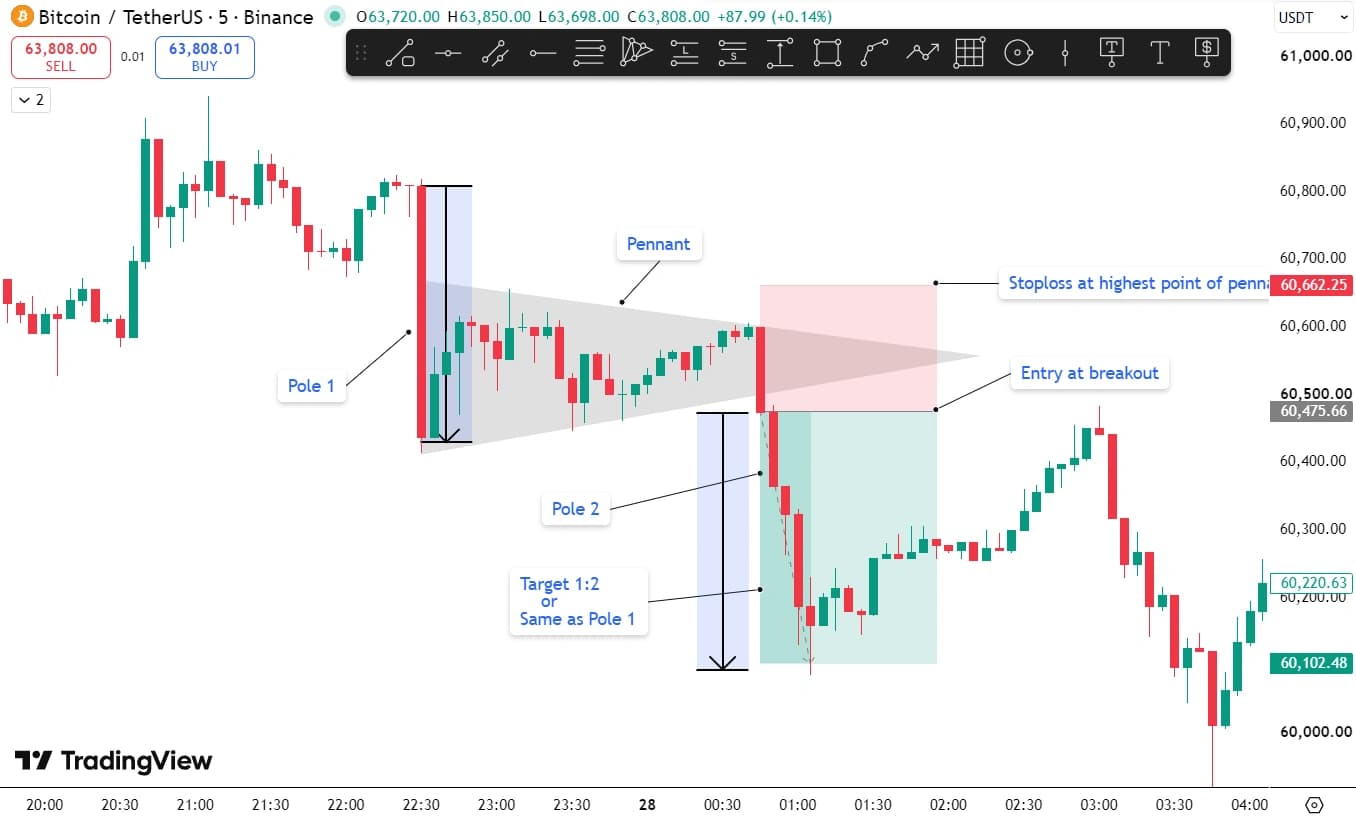
- Bearish Pennant: Flagpole is downward, pennant consolidates into a converging triangle, breakdown continues downward
The name comes from the visual resemblance to a sports pennant flag — a pole with a small triangular banner at the top.
Why Pennants Form — The Psychology
Understanding why the pattern forms makes you significantly better at identifying genuine setups versus random noise.
During the flagpole: A sudden imbalance between buyers and sellers — triggered by news, a technical breakout, or a momentum squeeze — pushes price sharply in one direction. This initial move attracts attention but also creates a first wave of profit-takers among those who were already positioned before the move.
During the pennant: Profit-takers from the flagpole begin selling (for a bullish pennant) or covering (for a bearish pennant), while a new group of traders who missed the original move are waiting for a pullback to enter at a better price. This temporary standoff between the two groups creates the converging triangle — neither side dominates, range contracts, volume falls. The market is redistributing shares from early participants to new buyers (or in a bearish pennant, redistributing short positions from covered shorts to fresh shorts).
At the breakout: The profit-taking exhausts itself. The traders who were waiting for a pullback entry finally commit. The original momentum reasserts itself — and because the new participants are entering with fresh conviction at a tighter, lower-risk entry point, the breakout often carries comparable force to the original flagpole.
Pennant vs Flag vs Symmetrical Triangle — The Critical Difference
These three patterns are closely related and frequently confused. Getting this distinction right matters because they have different trade dynamics.
| Feature | Pennant | Flag | Symmetrical Triangle |
|---|---|---|---|
| Consolidation shape | Converging triangle (symmetrical) | Rectangular channel (parallel lines) | Converging triangle |
| Requires flagpole | YES — mandatory | YES — mandatory | NO — can form without prior sharp move |
| Trendline slope | Both converging toward apex | Parallel, slight counter-trend slope | One rising, one falling |
| Typical duration | 1–3 weeks (shorter than flag) | 1–4 weeks | Can be weeks to months |
| Breakout direction | Same as flagpole | Same as flagpole | Either direction |
| Volume at breakout | Expanding sharply | Expanding sharply | Expanding sharply |
The pennant vs flag test: If the consolidation has two parallel lines forming a slight channel (even tilted), it is a flag. If the consolidation has two lines converging toward a point (a triangle shape), it is a pennant.
The pennant vs symmetrical triangle test: Both have converging trendlines — the difference is the flagpole. A pennant always requires a sharp, impulsive move immediately before the consolidation. A symmetrical triangle can form gradually without any preceding sharp move. It is often mistaken for a flag or triangle pattern, but the pennant is unique because of its symmetrical, tapering structure formed by converging trendlines after a sharp flagpole move.
How to Identify the Flagpole
The quality of the entire pennant setup depends largely on the quality of the flagpole. A weak or ambiguous flagpole produces a lower-probability pennant.
A valid flagpole has four characteristics:
1. Nearly vertical price movement. The flagpole should be a sharp, steep move — visually distinct from the surrounding price action. A slow, gradual rise does not qualify.
2. High volume during formation. The flagpole should have high volume, creating a flagpole that gives more credence to the pattern's strength. Volume during the flagpole should be visibly above average — the surge in participation is what makes the initial move legitimate.
3. Short duration. The flagpole forms quickly — typically 1 to 5 candles on daily charts, or a few hours on intraday charts. A move that takes weeks to develop is a trend, not a flagpole.
4. Consolidation immediately follows. The pennant should begin forming directly after the flagpole ends — there should be no extended, wandering price action between the pole and the triangle.
Measuring the flagpole: Measure from the starting point of the sharp move to its end point. This measurement becomes your price target projection later.
How to Identify the Pennant — 5-Point Checklist
Once the flagpole is confirmed, the pennant itself must meet these criteria:
1. Converging trendlines (not parallel). The consolidation must form a triangle with two trendlines getting closer together. For a bullish pennant, draw a line connecting the lower highs and a line connecting the higher lows — they should converge toward an apex. If the lines are parallel, you have a flag, not a pennant.
2. Symmetrical structure. The pennant should be roughly symmetrical — lower highs declining at approximately the same rate that higher lows are rising. A pennant that is heavily skewed in one direction is better classified as a wedge.
3. Volume contracts through formation. During consolidation, volatility contracts and volume typically declines. As price compresses, stop orders accumulate outside the structure. Volume should visibly decline from candle to candle through the pennant's formation. Flat or rising volume inside the pennant is a warning sign.
4. Consolidation stays shallow — the 50% rule. Fibonacci retracement levels are used for verifying that the pennant's consolidation does not retrace more than 50% of the initial flagpole move. A consolidation that retraces more than 50% of the flagpole suggests the original momentum was insufficient to sustain the move — the pattern loses reliability significantly beyond this threshold.
5. Duration stays proportionate. A pennant should be short — typically 1 to 3 weeks on daily charts, or a few hours to a few sessions on intraday charts. A pennant usually has slightly stronger potential breakouts due to the tighter consolidation range — if the consolidation drags on too long, that tightness is lost and the pattern's character changes.
How to Trade the Pennant Pattern
Entry
Standard breakout entry: Wait for a candle to close above the upper trendline (bullish pennant) or below the lower trendline (bearish pennant) with volume expanding on the breakout candle. This is the most widely used approach.
Retest entry: Conservative traders could wait for a retest of the broken resistance before entering. After the initial breakout, price frequently pulls back to test the broken trendline from the other side — where former resistance becomes support (bullish) or former support becomes resistance (bearish). Entering on this retest gives a tighter stop and better risk-reward.
9 EMA entry (intraday): For short-term, intraday pennants, an area to keep an eye on for a possible entry would be to enter inside the pennant near the 9 EMA on a specific timeframe. The 9-period EMA frequently acts as a dynamic support within bullish pennant consolidations and a dynamic resistance within bearish pennant consolidations.
Stop Loss
Bullish pennant: Below the pennant's lowest point — the lowest low formed during the consolidation. This is the level where the pattern's structure breaks down and the bullish thesis is invalidated.
Bearish pennant: Above the pennant's highest point — the highest high formed during the consolidation.
Add a small buffer (0.2–0.5% for daily chart setups) beyond the exact trendline to avoid being stopped out by minor noise before the real breakdown occurs.
Measured Move Target
Flagpole Height = End of flagpole − Start of flagpole

Bullish Pennant Target = Breakout price + Flagpole height
Bearish Pennant Target = Breakdown price − Flagpole height
Some traders use a more conservative approach: target 61.8% or 100% of the flagpole height (Fibonacci extensions), taking partial profits at each level and trailing the rest.
Bull Pennant vs Bear Pennant — Comparison Table
| Feature | Bullish Pennant | Bearish Pennant |
|---|---|---|
| Flagpole direction | Sharp move UP | Sharp move DOWN |
| Consolidation shape | Converging triangle | Converging triangle (identical) |
| Volume on flagpole | High | High |
| Volume in pennant | Declining | Declining |
| Volume at breakout | Expanding | Expanding |
| Breakout direction | UP (above upper trendline) | DOWN (below lower trendline) |
| Entry trigger | Close above upper trendline | Close below lower trendline |
| Stop loss | Below pennant's lowest point | Above pennant's highest point |
| Target | Breakout + flagpole height | Breakdown − flagpole height |
| 50% rule | Consolidation < 50% of flagpole | Consolidation < 50% of flagpole |
Pannents Trading Examples — NSE India, Crypto, and USA
Example 1 — Crypto: Bitcoin (BTC/USDT) — Bearish Pennant
Bitcoin drops sharply from $68,500 to $61,200 in four days — a $7,300 bearish flagpole on heavily elevated volume, driven by a major exchange regulatory announcement.
Immediately after, BTC forms a bearish pennant: a converging triangle between $62,800 and $61,800, with lower highs and higher lows narrowing over seven days. Volume contracts significantly through the consolidation — the pattern's average daily volume is approximately 25% of the flagpole's volume.
Critically, the consolidation retraces only $1,600 of the $7,300 flagpole — just 22%, well within the 50% rule. This shallow retracement signals that sellers remain firmly in control despite the brief pause.
On day eight, BTC closes at $61,500 — below the lower trendline — on volume 1.9x the 7-day average.
Entry (short):   $61,500 (breakdown candle close)
Stop Loss:       $63,100 (above pennant high)
Risk:            $1,600

Flagpole Height: $68,500 − $61,200 = $7,300
Target:          $61,500 − $7,300 = $54,200

Reward:          $7,300
Risk-Reward:     $7,300 ÷ $1,600 = 4.6:1
Crypto-specific note: The bearish pennant pattern, as a rule, signals the continuation of the downtrend. The pennant itself looks like a triangle with successive increasing lows and decreasing highs. In crypto, bearish pennants during strong sentiment-driven selloffs often produce the cleanest, most reliable breakdowns because the broader market fear sustains the selling pressure throughout the consolidation — making false breakdowns relatively rare when volume confirms the pattern.
Example 2 — USA: Apple (AAPL) — Bullish Pennant
AAPL surges from $178 to $196 over six sessions following a surprise product announcement — an $18 flagpole on volume more than 2.5x the 50-day average.
After the surge, AAPL enters a bullish pennant: converging trendlines between $192 and $194, narrowing over ten trading sessions. Volume contracts to the lowest level in six weeks during the pennant's formation.
The consolidation retraces only $4 of the $18 flagpole (22%) — well within the 50% rule. The 9-period EMA on the daily chart sits at $192.50 and holds as support throughout.
On session eleven, AAPL closes at $195 above the upper trendline, on volume 1.8x the 50-day average.
Entry:           $195 (breakout candle close)
Stop Loss:       $191.50 (below pennant low)
Risk:            $3.50

Flagpole Height: $196 − $178 = $18
Target:          $195 + $18 = $213

Reward:          $18
Risk-Reward:     $18 ÷ $3.50 = 5.1:1

Conservative:    $204 (61.8% of $18 = $11.12 — $195 + $11.12)
R:R conservative: $9 ÷ $3.50 = 2.6:1
US market note: For US large-cap stocks, the most reliable bullish pennants form in the first wave of momentum — the first or second consolidation after a major breakout from a longer base. The further along a momentum run a stock is, the more likely the pennant consolidation represents exhaustion rather than a genuine continuation. If you are just starting with continuation patterns, focus on bull flags first and add pennants to your playbook once you are consistently profitable — but when the flagpole is genuine and volume confirms, the pennant's converging tightness produces explosive breakouts that flags often cannot match.
Common Pennant Pattern Mistakes — And Exact Fixes
Mistake 1 — Calling a parallel-channel consolidation a pennant. If the consolidation lines are parallel (equal distance apart) rather than converging, you have a flag — not a pennant. The trading rules for entries and stops are slightly different. Fix: Before labeling any consolidation a pennant, confirm that the upper and lower trendlines are genuinely getting closer together as you move right across the chart.
Mistake 2 — Trading a pennant with a weak flagpole. Entering a pennant where the flagpole was a slow, gradual move rather than a sharp, impulsive surge — and finding the breakout fails to follow through. Fix: The flagpole must be steep, on high volume, and short in duration. If you cannot clearly point to it as the most visually dominant move in the vicinity, it is likely not a valid flagpole.
Mistake 3 — Ignoring the 50% retracement rule. The consolidation retraces more than 50% of the flagpole, but the trader enters anyway. Fix: Measure the consolidation's depth against the flagpole height before entering. A retracement exceeding 50% signals insufficient momentum from the original move — skip the setup or require substantially stronger breakout volume as compensation.
Mistake 4 — Entering before the breakout candle closes. Buying or selling as soon as price touches the pennant's trendline boundary, before the candle has actually closed beyond it. Fix: Wait for a full candle close beyond the relevant trendline with volume confirmation. An intrabar spike through the trendline is not a confirmed breakout and produces a meaningfully higher false-breakout rate.
Mistake 5 — Trading on low breakout volume. The price closes beyond the trendline but volume on the breakout candle is flat or below average. Fix: Low trading volume during consolidation and high trading volume during the breakout work as confirmation of the pattern. If volume stays low on the breakout, the move may fail or reverse due to a fake breakout. Require at minimum 1.5x the recent average volume on the breakout candle before committing.
Final Thoughts
The pennant pattern earns its place in a trader's toolkit because it captures something real: a sharp, genuine directional move briefly pausing to redistribute participants, before resuming with the original momentum. The converging triangle structure — tighter than a flag's rectangular channel — often produces faster, more explosive breakouts, precisely because the increasing compression builds pressure that releases quickly once price exits the pattern.
Three rules to carry into every pennant trade:
1. The flagpole is the foundation — evaluate it first, always. A weak, slow flagpole produces an unreliable pennant regardless of how clean the triangle itself looks. Sharp, high-volume, short-duration poles produce the most reliable continuation setups.
2. The 50% retracement rule is your quality filter. Pennants where the consolidation stays shallow (under 30% of the pole is ideal) signal that the original momentum was genuine and that the opposing side is weak. Beyond 50%, skip the setup.
3. Volume tells you whether the pattern is real or noise. Declining volume through the pennant's formation, followed by a clear expansion on the breakout candle, is the complete, non-negotiable confirmation sequence. A visually perfect triangle that lacks this volume sequence is not a tradeable pennant — it is an unconfirmed consolidation.
Disclaimer: This blog is for educational purposes only and is not investment advice. Trading chart patterns involves substantial risk of capital loss. Past performance of any pattern does not guarantee future results. Always use appropriate stop-loss orders and position sizing before entering any trade.
FAQ
Q: What is a pennant pattern in trading? A pennant pattern is a short-term continuation chart pattern consisting of three phases: a sharp directional move called the flagpole, a brief consolidation shaped like a small converging (symmetrical) triangle called the pennant, and a breakout in the same direction as the original flagpole. It appears in both bullish and bearish versions and is used to identify high-probability entry points with defined risk and a measured-move target based on the flagpole's height.
Q: What is the difference between a bull pennant and a bear pennant? A bull pennant forms after a sharp upward move (flagpole) and consists of a converging triangle consolidation before breaking out upward to continue the uptrend. A bear pennant forms after a sharp downward move and consists of a converging triangle consolidation before breaking down to continue the downtrend. Both patterns have identical internal structure — the only difference is the direction of the flagpole and the resulting breakout direction.
Q: How is a pennant different from a flag? A pennant and a flag both require a flagpole before the consolidation, and both are continuation patterns. The difference is the consolidation's shape: a flag consolidates in a rectangular channel with parallel trendlines that typically slope slightly against the trend. A pennant consolidates in a converging triangle with trendlines getting progressively closer together. Pennants typically produce more explosive breakouts due to the tighter, more compressed consolidation.
Q: How do you calculate the price target for a pennant pattern? Measure the flagpole height — the price distance from where the sharp move started to where it ended. For a bullish pennant, add this height to the breakout price (where price closes above the upper trendline). For a bearish pennant, subtract this height from the breakdown price. For example, if a flagpole covers ₹77, and the breakout occurs at ₹561, the measured-move target is ₹638.
Q: What is the 50% rule for pennant patterns? The pennant's consolidation should not retrace more than 50% of the flagpole's height. If the consolidation pulls back more than half of the original move, it signals that the initial momentum was insufficient — the pattern loses reliability. The best pennants consolidate only 15–30% of the flagpole, keeping the potential reward large relative to the tight risk of the consolidation stop.
Q: Does the pennant pattern work on NSE India, crypto, and US stocks? Yes — the pennant pattern applies across all actively traded, liquid markets. The same identification rules (sharp flagpole on high volume, converging triangle consolidation with declining volume, breakout on expanding volume) apply in every market. For NSE intraday traders, confirm the pennant forms above VWAP (bullish) or below VWAP (bearish) for additional institutional-bias confirmation. For crypto, bearish pennants during sentiment-driven selloffs produce particularly reliable breakdowns when the consolidation stays shallow.
Related Articles
- Flag and Pole Pattern: How to Identify and Trade It — Sibling pattern — parallel consolidation vs converging triangle
- Cup and Handle Pattern: How to Identify and Trade It — Both are continuation patterns with measured-move targets
- Head and Shoulders Pattern: How to Identify & Trade — Reversal counterpart — useful contrast with the pennant's continuation nature
- Volume Analysis: The Complete Trading Guide — Volume contraction plus breakout expansion is the core pennant confirmation
- Best Online Trading Journal — Track every pennant trade to identify which flagpole quality produces the best results
Have a question about this article?
Comment on our latest Instagram post or send us a DM — we reply to every one.
@dhanith_officialWas this article helpful?
Click to rate
Founder, Dhanith Trading
7+ years trading Nifty, Bank Nifty, NSE stocks, and commodities — specializing in Smart Money Concepts (SMC) and ICT price action. Founder of Dhanith — a trading journal, intraday screener, and risk tools platform built for retail traders.
Dhanith Newsletter
Enjoyed this article? Get more like it.
New trading guides, candlestick patterns, SMC strategies, and tool updates — straight to your inbox. Free, for Indian traders.
No spam. Unsubscribe anytime.
Continue Reading