On this page
- What Is an Order Block?
- How to Identify a Valid Order Block
- How to Mark the Order Block Zone
- Bullish Order Block: Explained and How to Trade It
- Bearish Order Block: Explained and How to Trade It
- Why Order Blocks Work
- Best Timeframe to Identify and Trade an Order Block
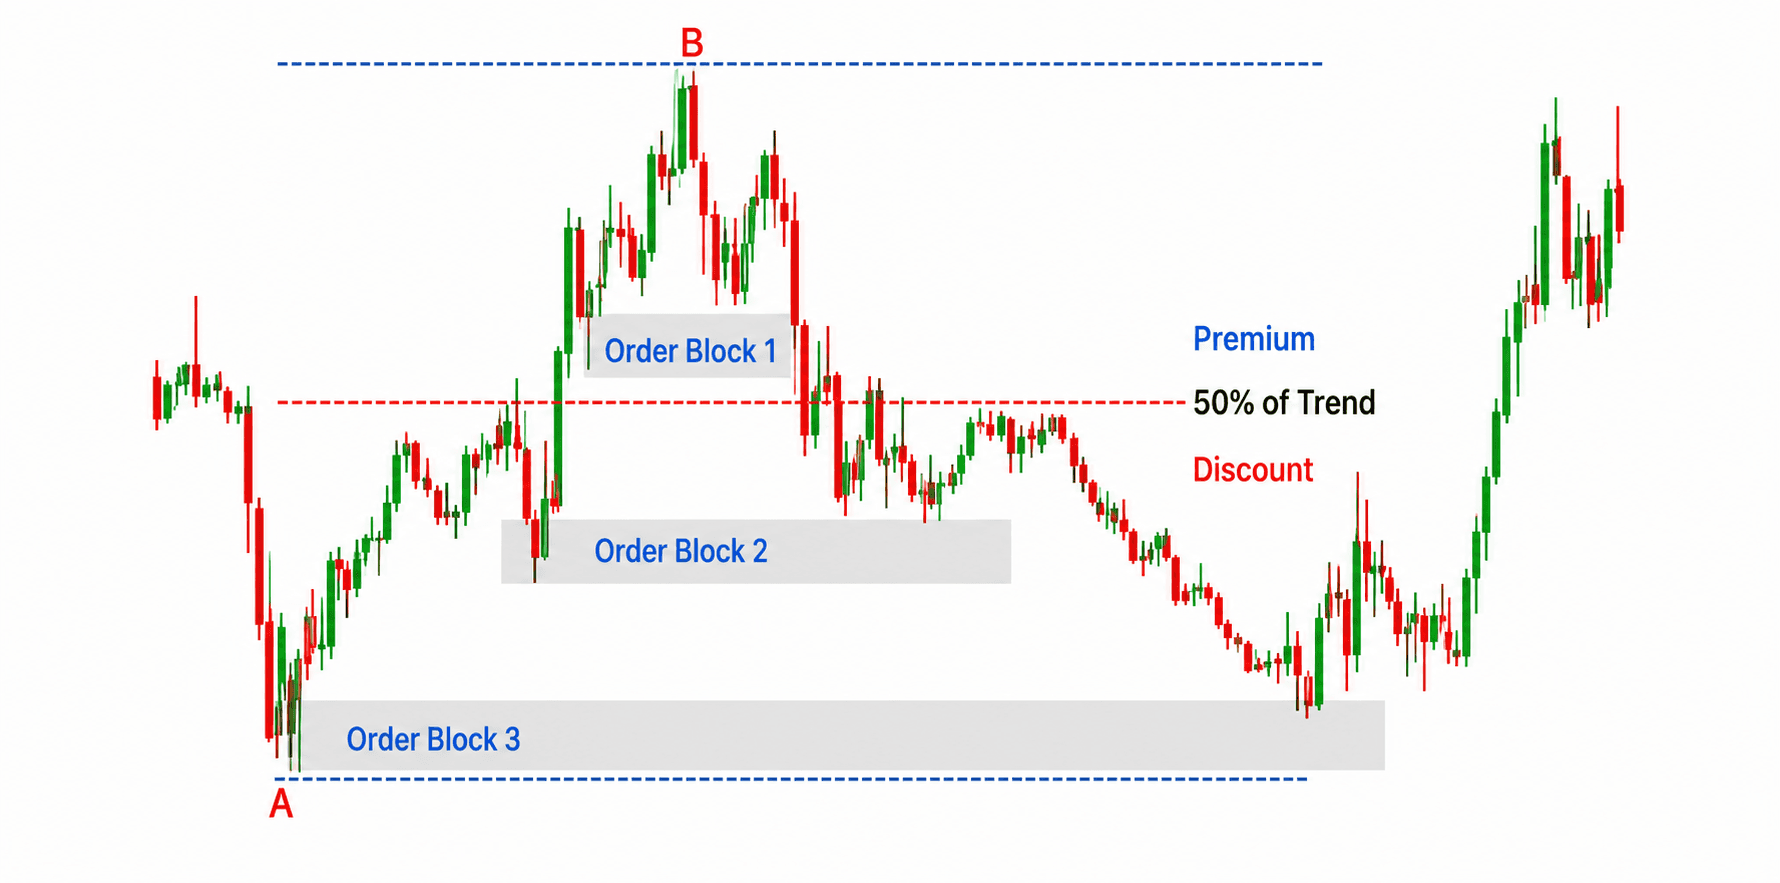
- Premium and Discount Zones
- The 5-Point Grading System
- Finding the Real Target: The Fibonacci Extension Method (Crypto & Gold)
- Order Blocks Don't Exist in Isolation — They're Paired With Liquidity
- What Happens If an Order Block Fails?
- Rejection Block
- Mitigation Block
- My Observations on Order Blocks (Jan–June 2026)
- Mistakes to Avoid With Order Blocks
- FAQ
- Conclusion
What an order block is, how to identify a valid one, and the full bullish/bearish trading strategy — entry models, stop-loss, targets, and grading.
TL;DR — Key Takeaways
- An order block is the last footprint of institutional buying or selling before price makes a strong, structure-breaking move — supply from hunted retail stops, demand from institutions stepping in
- The qualifying candle isn't always "the last opposite-colored candle" — a spinning top or a large-wick candle can be the real order block too
- A valid zone needs a decisive impulse, a broken swing point, ideally a fair value gap, and higher volume than the candles around it
- Mark the full candle range as the zone, with the 50% midpoint (or the 50% CE of an FVG inside it) as the highest-probability entry
- Stop loss always goes beyond the OB wick, never inside the body — and which OB you measure from (the higher-timeframe zone or the lower-timeframe one that triggered your entry) changes how tight that stop can be
- A mitigated order block (price already closed through it) is used up — don't trade it as fresh
- Minimum target is the next liquidity pool at 2:1 reward-to-risk, refined further with fibonacci extensions or a structural 2x swing-low-to-high measured move
- Don't treat every target as all-or-nothing — if price shows a reversal signal after tagging Target 1, book full profit rather than mechanically holding for Target 2
- Position within the trend matters as much as the candle: a bullish OB in discount (below the swing's 50% midpoint) is a far stronger trade than an identical-looking one sitting in premium
- The order block zone gets refined, not just re-drawn, as you step down timeframes — a wide 4H box tightens into a precise zone on the 30-min chart of the same move
- Always establish the order block on a higher timeframe first, then refine down toward your entry timeframe
What Is an Order Block?
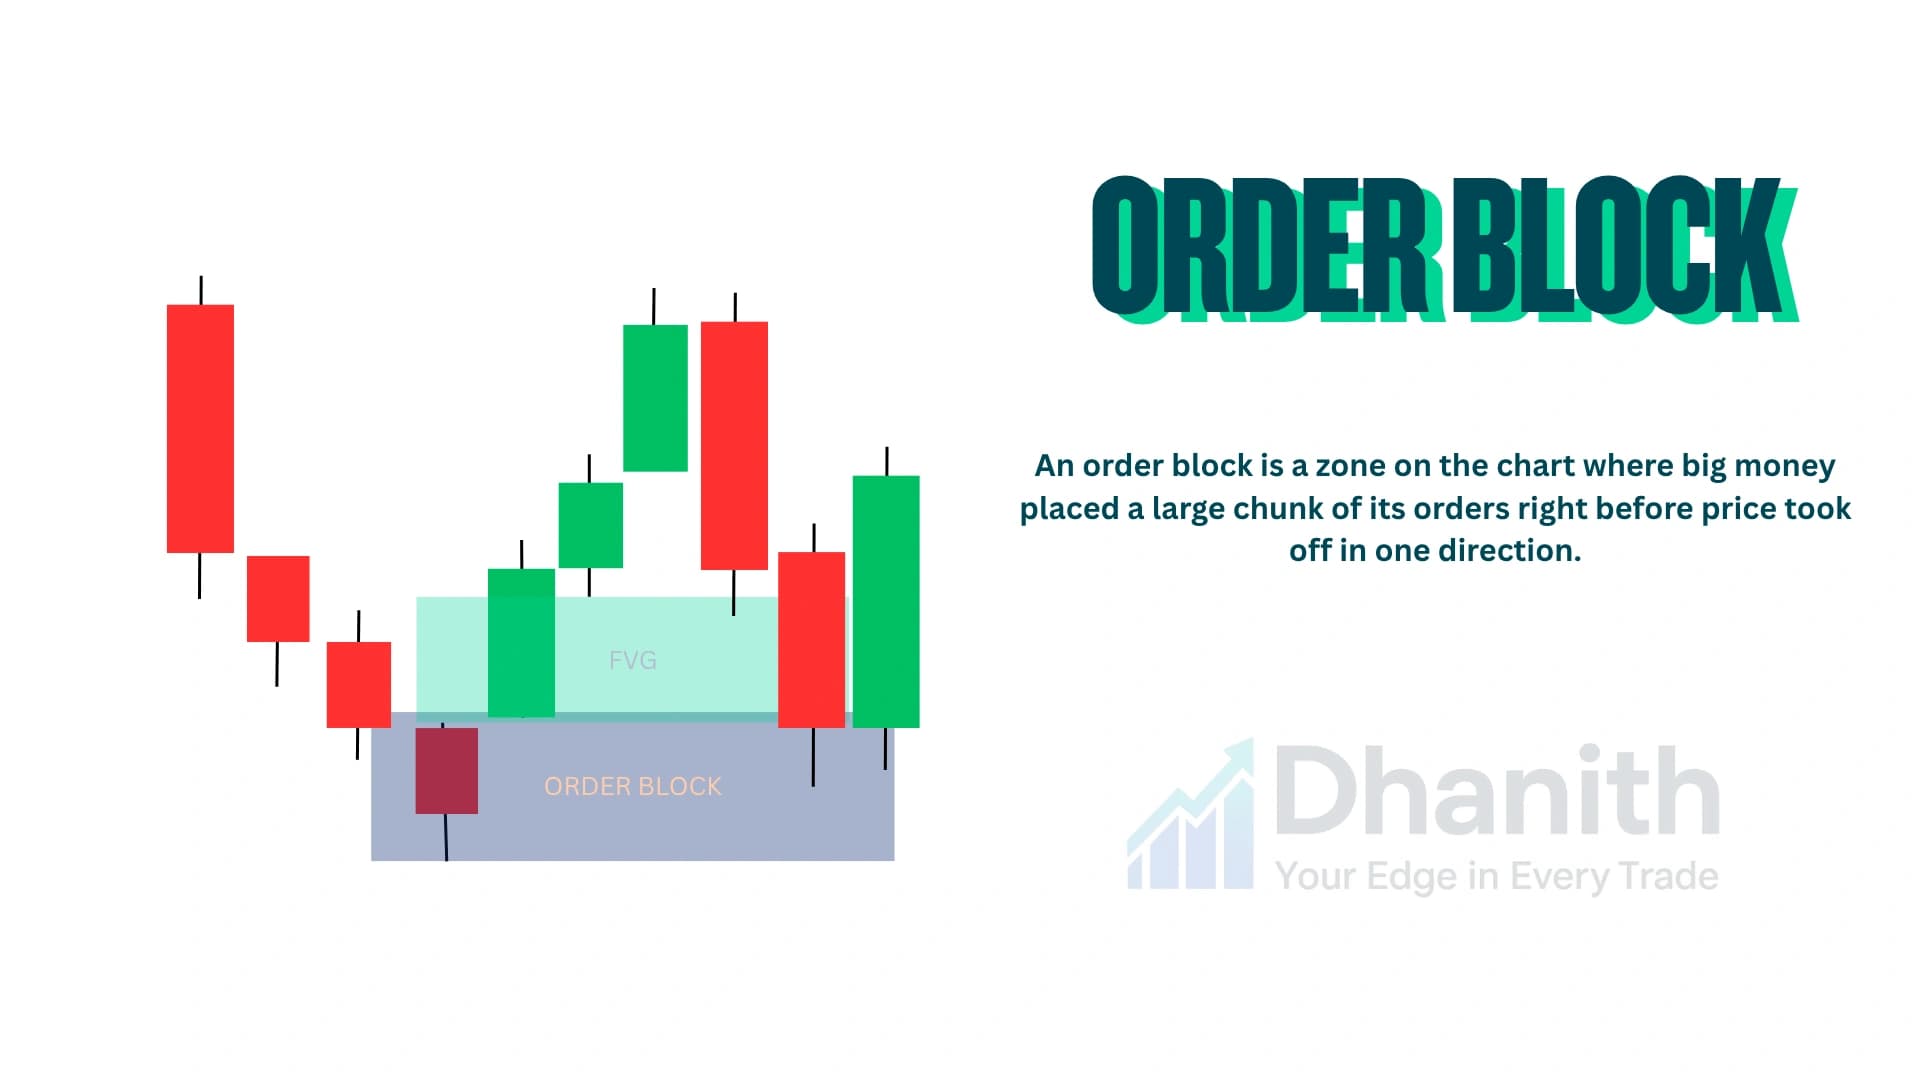
An order block is a zone on the chart where big money placed a large chunk of its orders right before price took off in one direction. It's not a random candle — it's the last footprint left behind before the real move started. Basically an order block is a supply and demand zone, where supply is created from retail traders' stop-loss liquidity and demand is created by smart money stepping in.
Here's the actual mechanism. A fund can't buy or sell a huge position in one click without grabbing retail liquidity. So they hunt retail stop-losses, which fills part of the order; price reacts, and the rest of that order stays unfilled at the same level. When price eventually comes back to that zone, the institution finishes filling what's left — which is exactly why price so often reacts there again instead of just drifting through.
How to Identify a Valid Order Block
Most traders think an order block is simply "the last opposite-colored candle before a big move," and stop there. That's incomplete, and it's the reason so many people mark zones that never actually react.
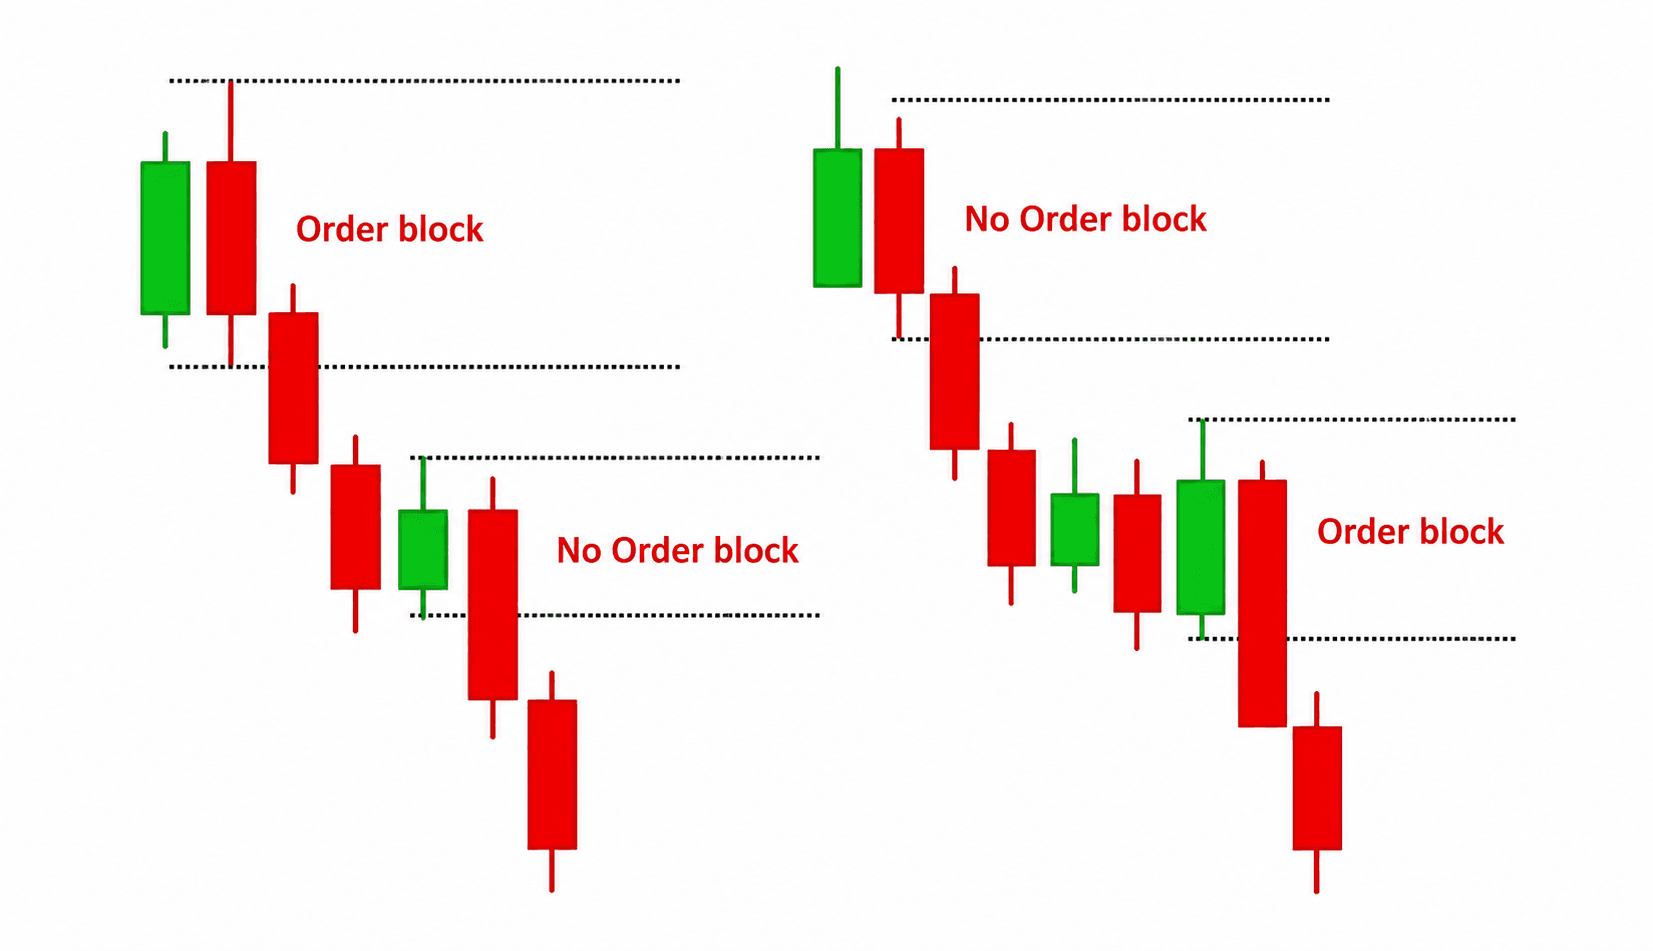
The candle itself doesn't have to be a plain opposite-colored candle. It can also be a spinning top within the trend — a small body with wicks on both sides, showing real indecision right before the reversal. Or it can be a large-wick candle at a support or resistance level, where at least half the candle is wick rather than body. Either of these can be the genuine order block, not just the textbook "last red candle before a green rally."
Beyond the candle itself, a few conditions need to hold before a zone is worth marking:
The move away from that candle must be a strong, decisive impulse — not a slow grind. A weak, overlapping move away from the candle doesn't carry the same institutional weight.
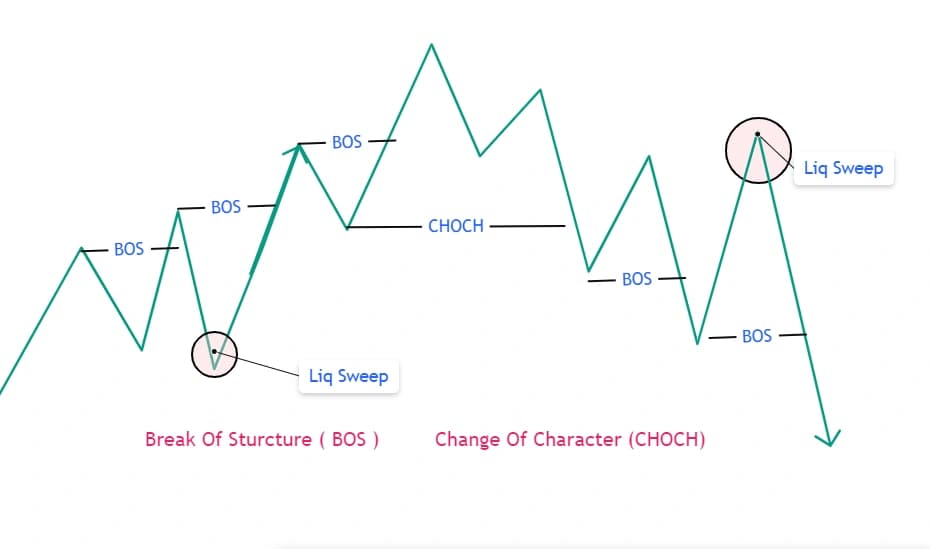
That impulse has to break a meaningful prior swing point. Without a liquidity grab, the move is just volatility, not evidence of institutional commitment.
Ideally, the impulse leaves behind a fair value gap. When it does, the order block and the FVG together become a much stronger zone than either alone.
The candle should show higher volume than the ones around it. That's often the clearest sign real size moved through that zone rather than retail noise.
The zone must still be unvisited. If price has already come back and closed all the way through it, the order block is used up — mitigated — and no longer worth marking.
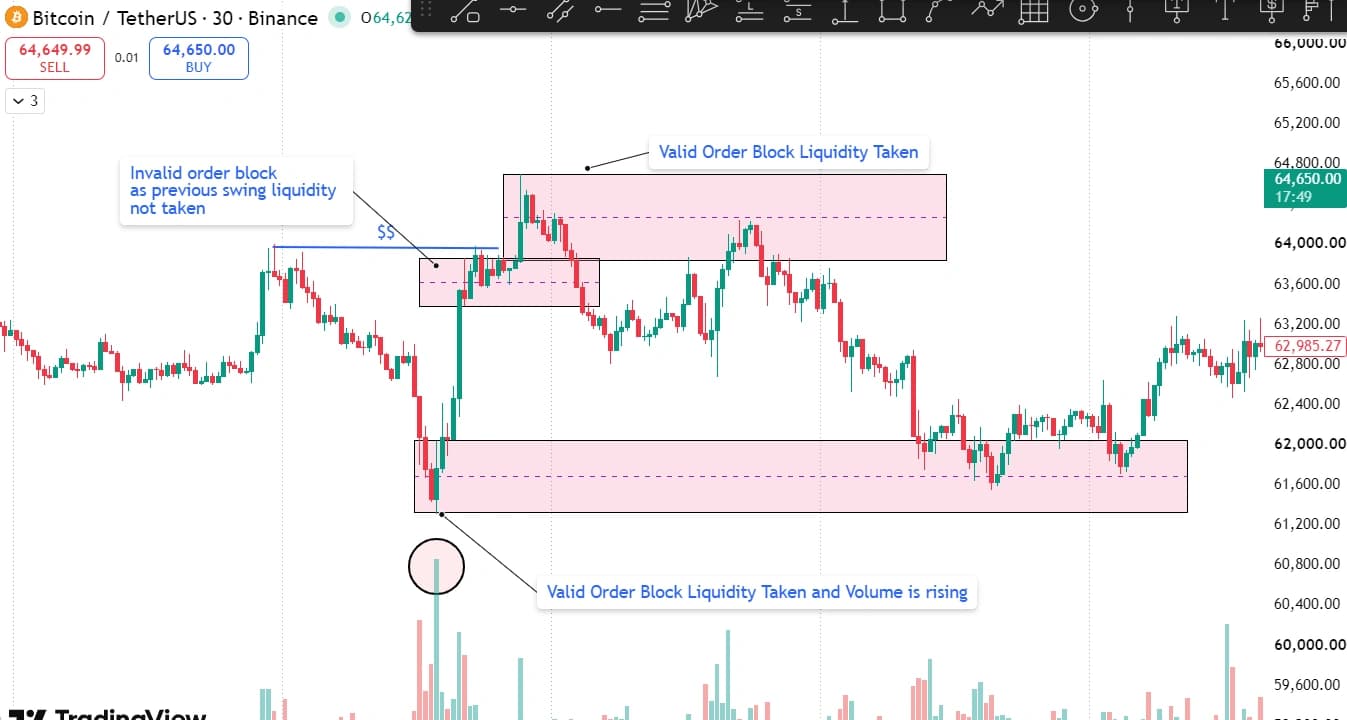
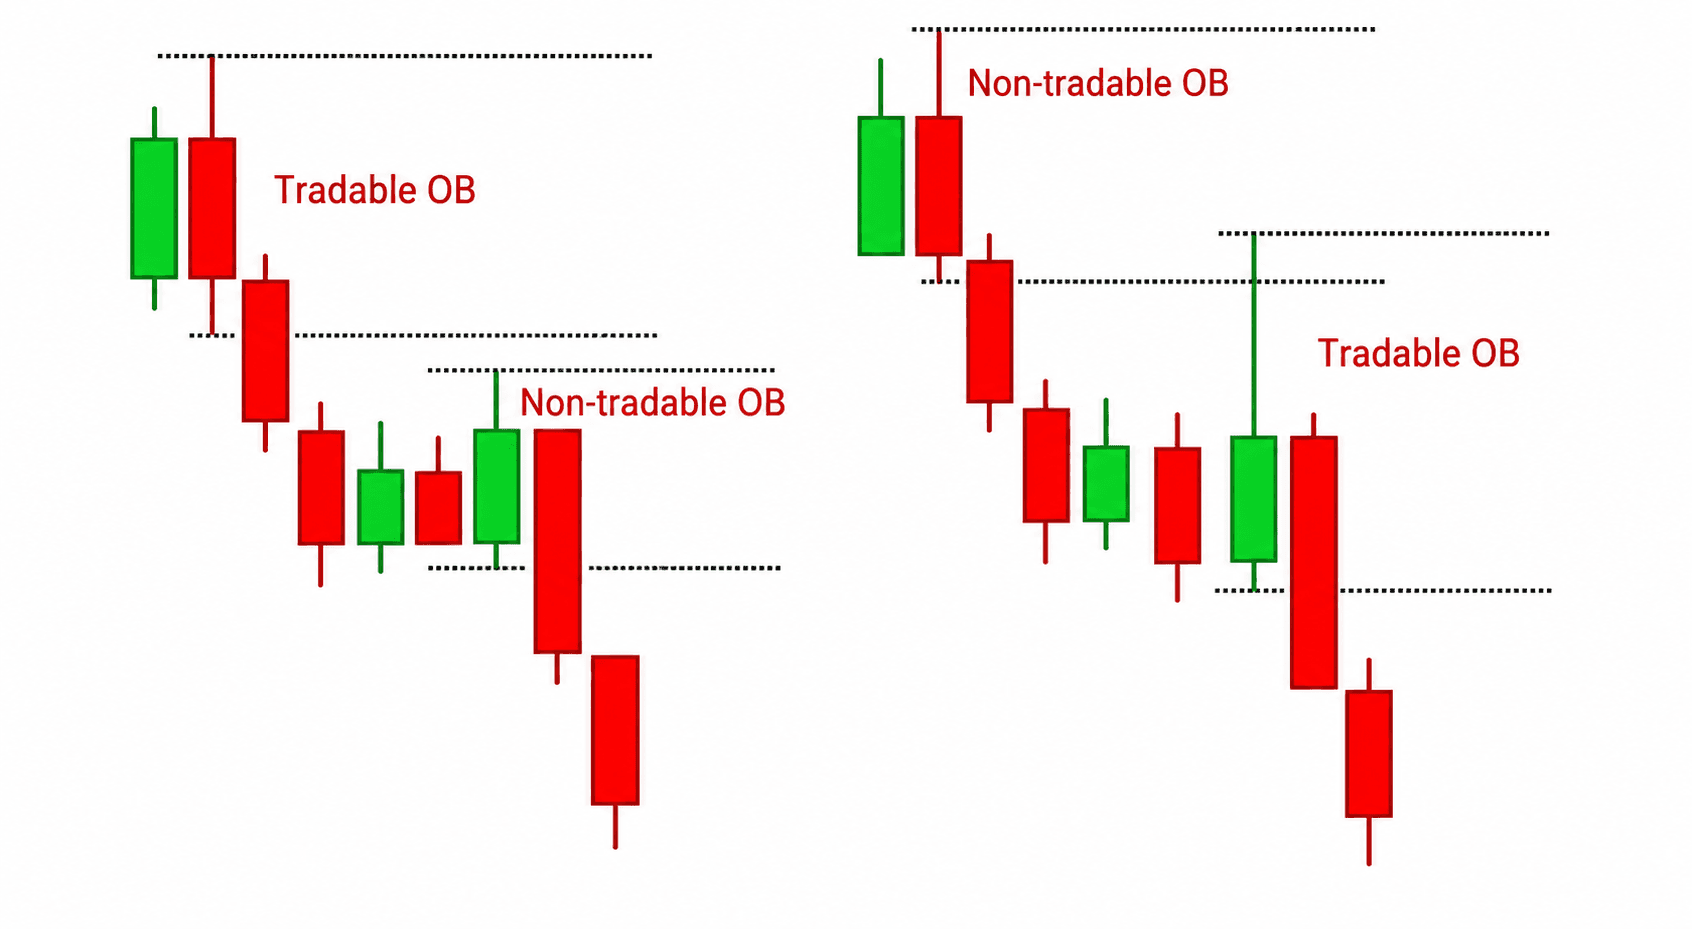
Two visually identical candles aren't always equally valid. The clearest way to see this is side by side: in a down-move made of several small-bodied candles, more than one spot can look like "the last opposite candle before a reversal." Only one of them actually is. The real order block is the one followed by a genuine structural break — the other is just a candle sitting inside a consolidation cluster, with no impulse or break behind it. Same color, same rough position, completely different validity.
How to Mark the Order Block Zone
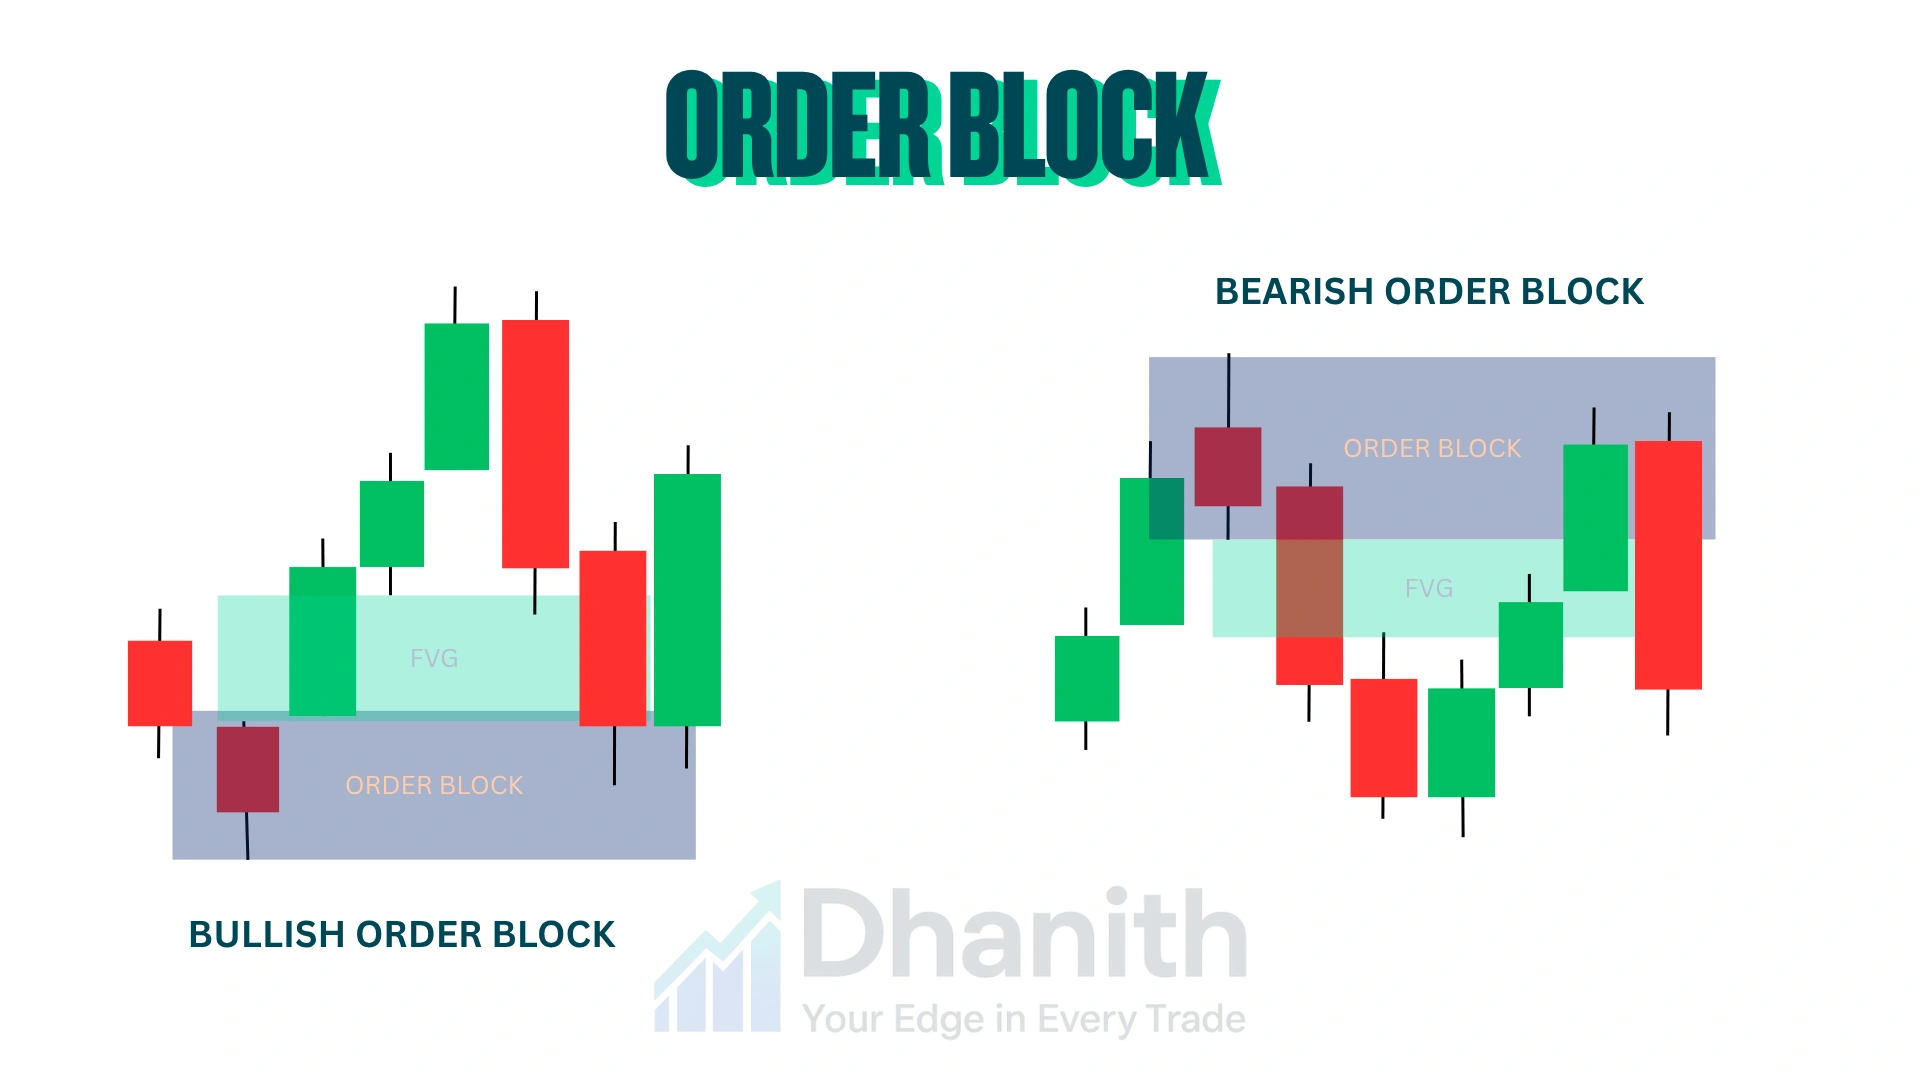
Once a valid order block is confirmed, the zone is simply the full range of that candle — its high down to its low. The midpoint of that range, the 50% level, is generally treated as the most efficient entry point within the zone — the same idea used for the consequent encroachment (CE) level in fair value gaps.
A wick briefly poking into the zone and reversing doesn't invalidate it. Only a candle actually closing all the way through the opposite boundary counts as mitigation.
Bullish Order Block: Explained and How to Trade It
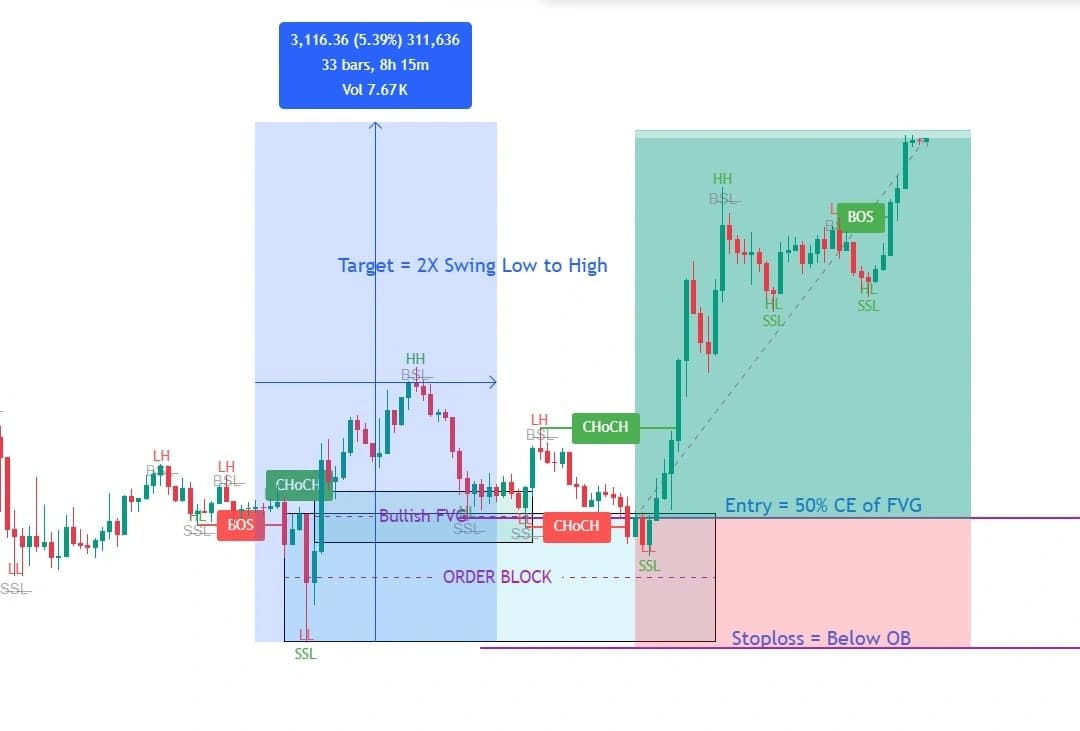
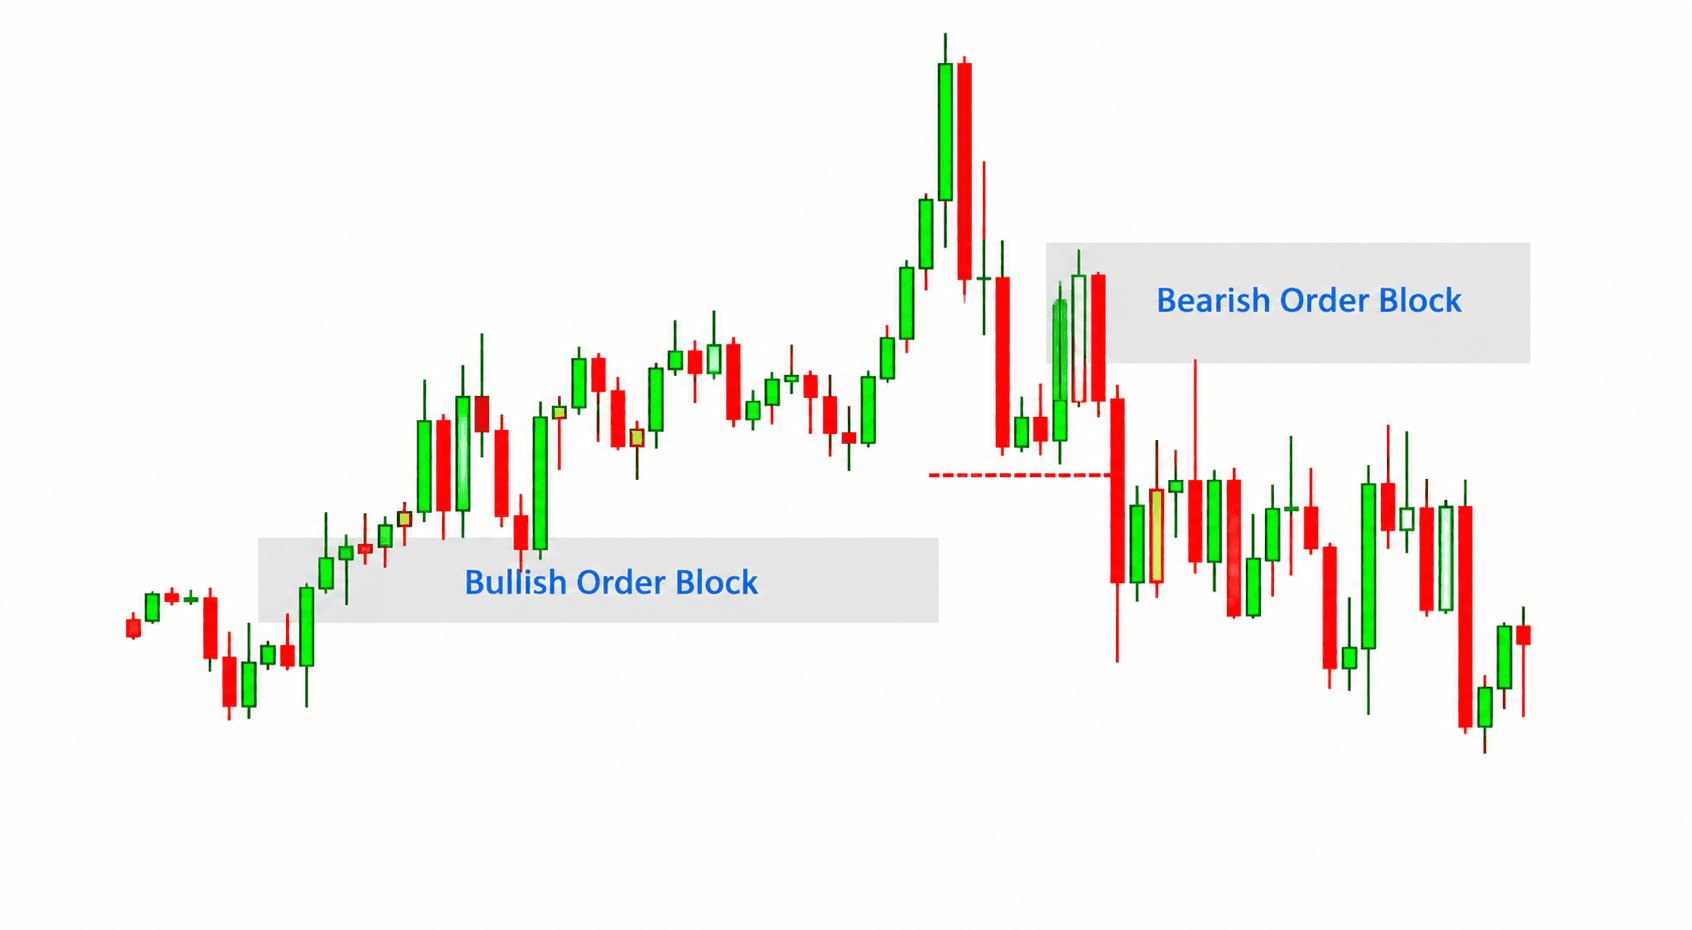
A bullish order block forms during a downward move or a pullback, right before buyers take control. It's the last candle — whether that's a plain bearish candle, a spinning top, or a large-wick candle — sitting just before a strong bullish push that breaks a prior swing high.
Once that break is confirmed, the zone becomes worth watching. When price pulls back down into it later, that's where buyers are expected to step back in and defend the level, since part of the original buying interest is likely still unfilled there.
The strategy around a bullish OB comes down to three decisions: how you enter, where you place your stop, and where you take profit.
Entry models. The direct tap is the aggressive route — a limit order at the 50% midpoint of the OB body, no lower-timeframe confirmation. It gives the tightest stop and best reward-to-risk, but it only belongs on your highest-graded setups.
The FVG refinement model is the middle ground — wait for price to enter the OB, then enter at the 50% CE (consequent encroachment) of any fair value gap sitting inside the impulse leg that came from it, rather than the first wick that touches the zone. That precision is what keeps your risk defined trade to trade instead of varying with how far the wick happened to reach.
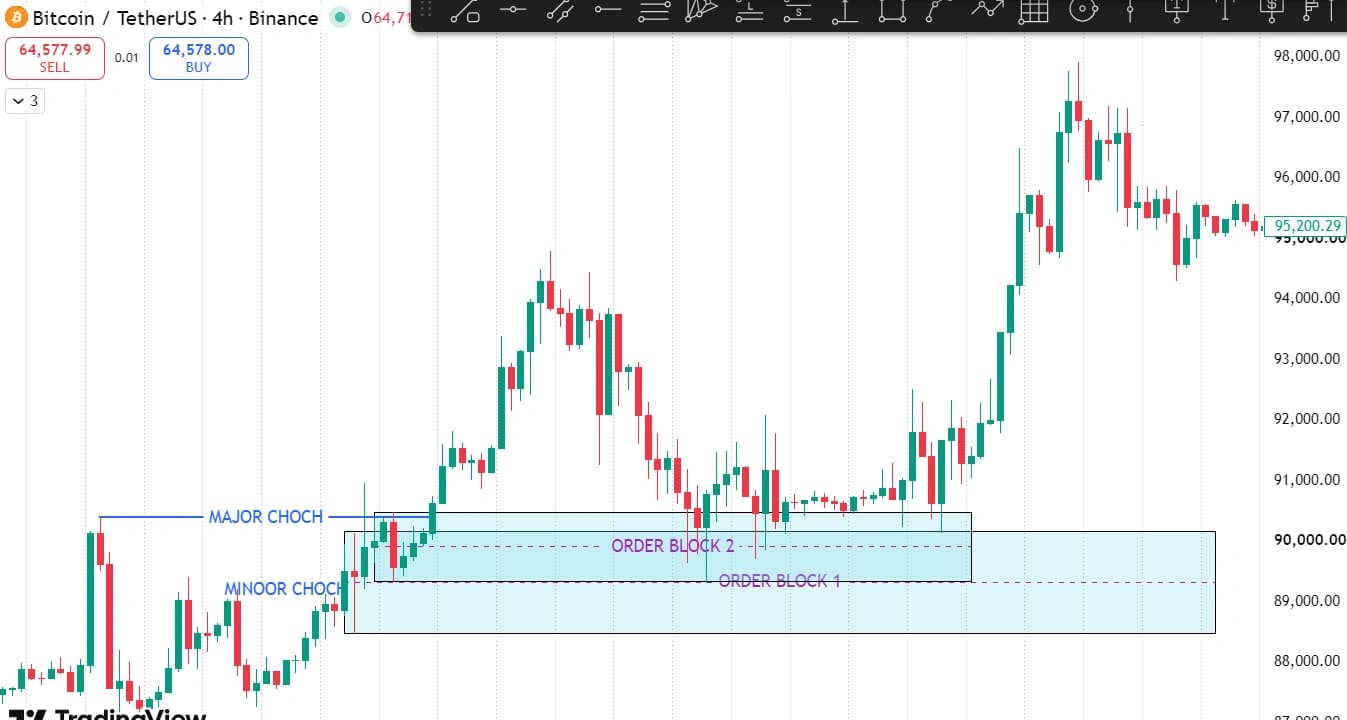
The most conservative option is waiting for a lower-timeframe CHoCH or MSS once price is inside the zone before entering at all — wider stop, smaller reward multiple, but the highest-conviction entry of the three. In practice, this usually means dropping from the 4-hour chart where the OB is marked down to a lower timeframe, marking a fresh OB/FVG there, and entering on that retest — the lower-timeframe structure becomes your actual trigger.
Don't skip the volume check on the retest. A retest that taps the zone on visibly weak volume is a caution flag, not a signal to enter — it suggests the move back into the zone is corrective rather than a genuine institutional return. This doesn't override the entry models above, but it's worth checking before committing size, especially on the direct-tap and FVG-refinement models where you're not already waiting for a structural confirmation.
Stop loss placement. Below the lowest wick of the order block, with a small buffer added. Never inside the candle's body — a normal wick into the lower half of the zone would trigger it on a setup that's still perfectly valid. One nuance worth being explicit about: if your entry trigger came from a lower-timeframe OB, the stop goes below that lower-timeframe zone, not the wider higher-timeframe one — it keeps risk proportionate to the structure that actually generated your signal. If you're using the direct-tap model straight off the higher-timeframe OB, the stop goes below the full HTF zone instead.
Target placement. The baseline is the next significant liquidity pool above current price, at a minimum 2:1 reward-to-risk. For a more precise approach, see the fibonacci extension method further down this article — or, as a simpler structural alternative, a measured move of 2x the distance from the recent swing low to swing high, projected forward from entry. Both are valid; keep both available rather than treating either as "the" method.
Bearish Order Block: Explained and How to Trade It
A bearish order block is the mirror image. It forms during an upward move, right before sellers take control — the last candle before a strong bearish push that breaks a prior swing low.
Once confirmed, that zone becomes resistance. When price rallies back up into it, that's where the remaining institutional selling interest is expected to resurface.
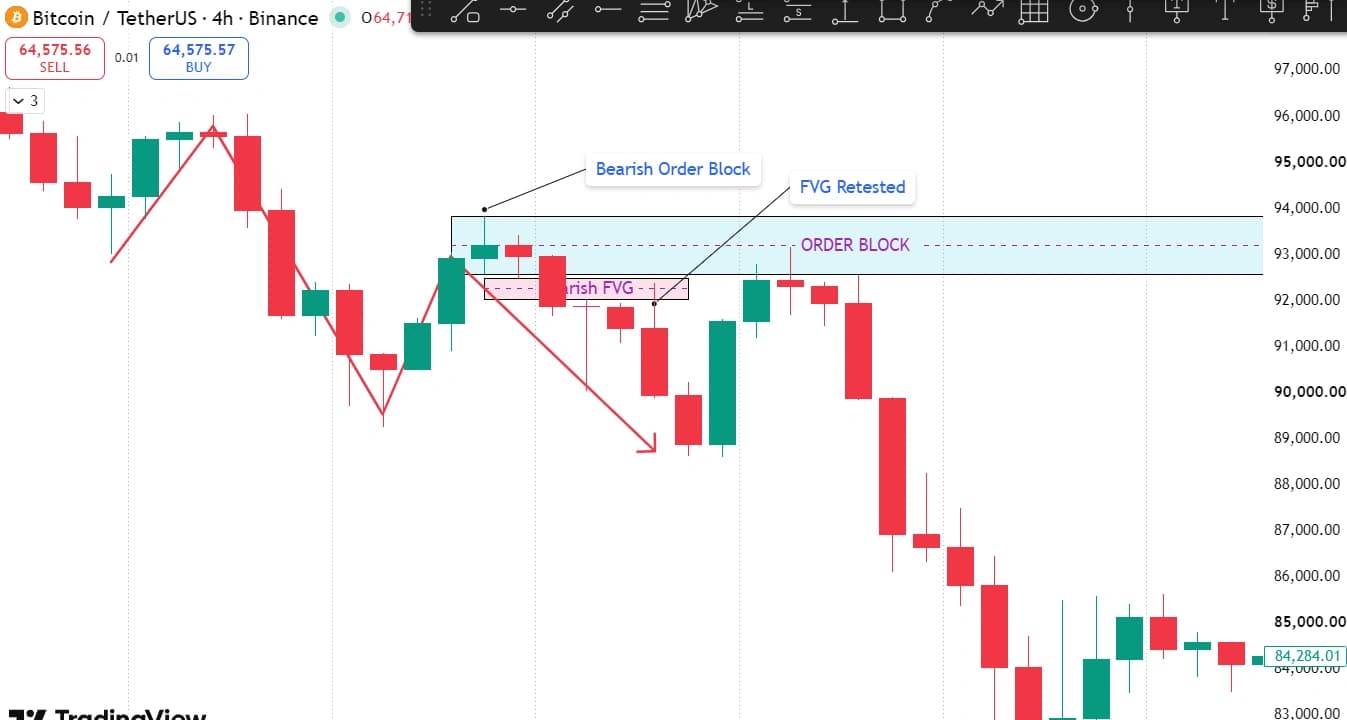
Everything from the bullish side applies in reverse: liquidity gets swept to the upside first (sometimes across two stacked pools rather than one — a double sweep is a stronger exhaustion signal than a single one), the rejection creates the OB and FVG at the high, and the retest can take more than one touch before the actual entry trigger shows up. It's worth being patient for a second rejection from the zone rather than committing on the first tap.
Entry models. Same three options as the bullish side, just flipped in direction: direct tap at the 50% midpoint for aggressive setups, entry at the 50% CE of an FVG within the bearish impulse leg for the balanced approach, or waiting for a lower-timeframe bearish CHoCH/MSS for the highest-conviction entry.
Stop loss placement. Above the highest wick of the order block, plus a buffer. Same rules as the bullish side — never inside the body, and match the stop to whichever timeframe's zone actually triggered the entry.
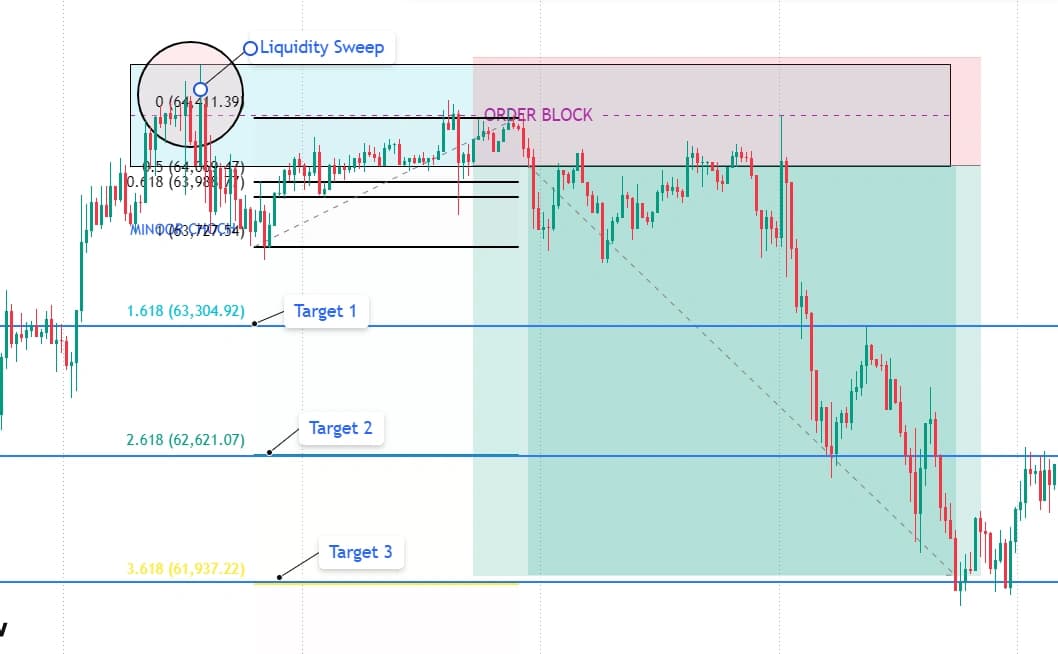
Target placement. The next significant liquidity pool below current price, again at a minimum 2:1 reward-to-risk, refined further using the fibonacci extension method below or the 2x structural measured move. And the same profit-booking discipline applies: if price hits your first target and then shows a reversal signal — a candle closing back through the level, for instance — that's a legitimate reason to close the full position there rather than holding out for a second target that may never come.
Why Order Blocks Work
It comes down to unfinished business. Institutions rarely fill an entire position in a single move — some portion of the order stays unfilled at the price where it started. That leftover interest doesn't disappear. It sits there, waiting.
When price eventually returns, two things tend to happen together: the institution finishes filling what's left, and that same buying or selling pressure pushes back against the market, creating the reaction traders see on the chart. That's a fundamentally different reason for a level to hold than "price bounced here before, so it might again" — which is really all traditional support and resistance offers.
Best Timeframe to Identify and Trade an Order Block
Start on the daily chart, and use it only to establish the overall trend — nothing more at this stage. Once the trend is clear, move to the 4-hour chart and mark the order block there. That's the primary zone.
Here's the practical trade-off worth knowing upfront: if you trade purely off the 4-hour timeframe, you'll get very few order blocks to work with — genuine 4-hour setups are scarce by nature. For that reason, the 30-minute timeframe is worth using for order block trading if you're trading intraday. It gives you meaningfully more setups to work with, though — as covered in the observations section below — it comes with its own trade-offs in reliability.
In practice, combine both: mark the OB on the 4-hour chart, then once price retests it, shift down to a lower timeframe — 30-minute, or 5-minute for the tightest possible entry — to mark a fresh OB/FVG and find the actual entry trigger, whether that's a CHoCH/MSS confirmation or a retest of that lower-timeframe FVG's 50% CE. The higher timeframe gives you the zone; the lower timeframe gives you the trigger and the tighter stop. How far down you drop depends on the entry model you're using — the more conservative your entry model, the further down the timeframe you'll typically confirm it on.
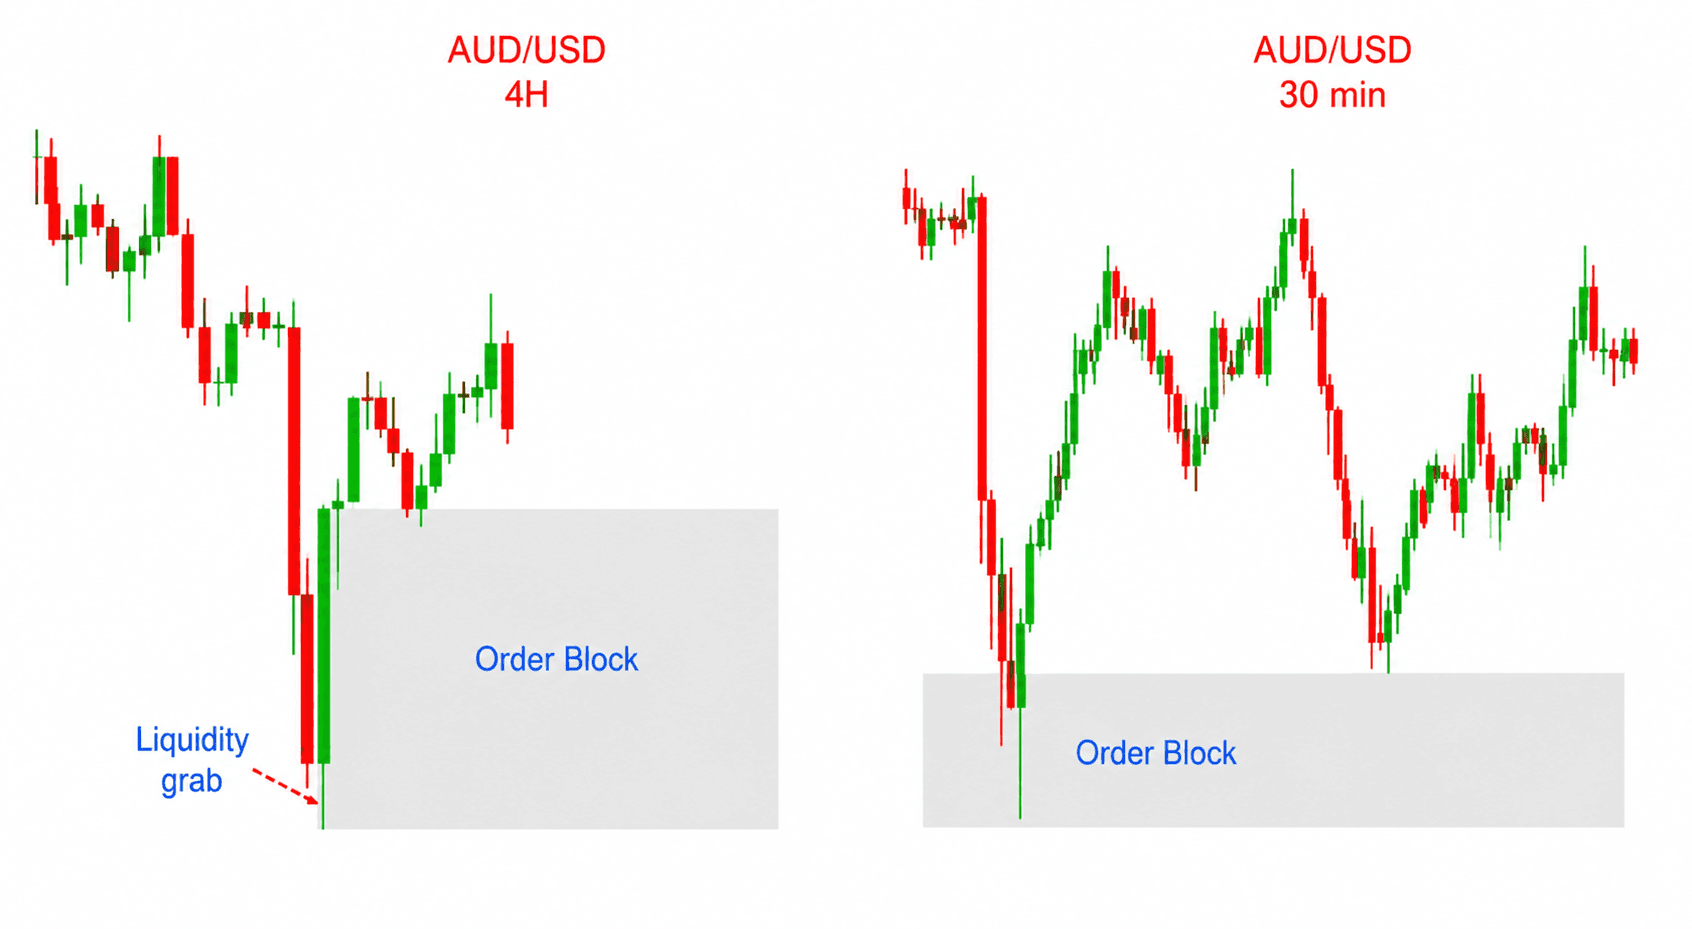
One more thing worth noting: the zone itself gets refined, not just re-drawn, as you step down timeframes. The same swing on a 4-hour chart produces a wide, blunt order block box — it has to cover the whole liquidity grab and reaction candle. Drop to the 30-minute chart for the same move, and the zone tightens considerably, hugging the actual reaction candles instead of the full swing. The higher timeframe tells you where to look; the lower timeframe is what turns that into a usable, precise zone.
Premium and Discount Zones
Not every order block in a trend is worth trading, even when several look valid at a glance — position within the trend matters as much as the candle itself.
Take the swing from a low (A) to a high (B) and mark the 50% midpoint of that range. Everything above the midpoint is the premium zone; everything below it is the discount zone. A bullish order block sitting deep in discount — well below the 50% line — is in the ideal spot: buying cheap relative to the swing. The same-looking bullish order block sitting up in premium is a much weaker trade, even though the candle itself is identical, because you'd be buying into the expensive half of the range. The mirror applies to bearish order blocks: discount is the weak spot for a short, premium is the strong one.
This is exactly what the premium/discount point in the grading system below is checking for — it's not a minor detail, it's often the difference between two order blocks that look equally valid on the chart.
The 5-Point Grading System
Not every valid order block is worth trading. A bullish OB in a bearish daily trend, sitting in a premium zone, already tested twice, with no volume confirmation, is technically valid and still a poor trade.
Higher timeframe alignment (0–2 points). Matches both daily and 4H structure = 2. Matches daily only = 1. Fights the daily trend = 0.
Mitigation status (0–2 points). Unmitigated, first touch = 2. Mitigated once = 1. Mitigated twice or more = 0.
FVG confluence (0–1 point). An FVG overlapping the OB zone = 1, no overlap = 0.
Liquidity sweep before the OB (0–1 point). A sweep occurred before price entered the zone = 1, no sweep = 0. A double sweep across two stacked liquidity levels before the rejection is an even stronger version of this signal, though it doesn't add extra points on its own.
Premium/discount position (0–1 point). Bullish OB in discount, or bearish OB in premium = 1. Wrong half of the range = 0.
Add it up: 7 is maximum conviction, 5–6 is a full-size trade, 3–4 warrants reduced size, 1–2 should usually be skipped, and 0 means don't trade it. Run this checklist in writing, every time, before entering.
Finding the Real Target: The Fibonacci Extension Method (Crypto & Gold)
Where real precision comes in isn't the entry — it's target placement, using fibonacci extensions rather than the generic "nearest liquidity pool" rule.
The moment an order block candle forms, mark its high and low and project a 4.618 fibonacci extension from it. That level is where the move is statistically likely to run into real resistance or reverse. Watch how price behaves once it arrives there — if a large, high-volume candle breaks straight through instead of stalling, don't take profit at that level. Double the target instead, since a clean break through 4.618 signals real strength behind the move.
When the order block gets retested later, use the 4.618 level's high and the retest low to project a fresh 1.618 extension — that becomes the next target. This has produced some of the most precise target hits on both crypto and gold.
For a simpler, purely structural alternative — no fib tool required — a 2x measured move from the swing low to the swing high that preceded your entry works well too, especially as a sanity check against whatever the fib extension gives you.
One more habit worth stating explicitly: don't treat two fib-extension targets as a package deal. If price reaches the first extension and then prints a candle closing back through it, that's often a cleaner signal to bank the full position than continuing to hold for the second, deeper level.
One honest caveat: this framework has been most rigorously tracked on BTC's 4-hour and 30-minute charts specifically. The same approach applies on gold, but treat it as something to validate on your own charts and instruments before relying on it heavily for position sizing.
Order Blocks Don't Exist in Isolation — They're Paired With Liquidity
It's worth stating this directly because it changes how you read a chart: an order block at a low usually exists because it's about to fuel a run at liquidity resting above (old highs, a stack of stop-losses) — and a bearish OB at a high exists to fund a run at liquidity below. Once price reaches one of those pools, don't assume the move simply continues. Watch for a fresh, opposite order block to form right there — that new zone is often the actual origin of the reversal, not the liquidity pool itself. And when that reversal does come, it can run further than the nearest pool — sometimes all the way back through the original order block that started the move. Map the liquidity on both sides of your setup, not just the direction you're trading.
What Happens If an Order Block Fails?
Sometimes price doesn't respect the zone — it pushes straight through it instead of reacting. When that happens, the order block hasn't just failed quietly; it's been invalidated, and it often flips into the opposite kind of zone. A failed bullish order block that price breaks below can start acting as resistance the next time price returns to it.
This flipped version has its own name and its own behavior — a breaker block — worth understanding on its own, since trading it works differently from trading a fresh order block.
Seeing the full cycle described start to finish makes it clearer than describing the pieces in isolation: a bullish order block fuels a rally into a fresh bearish order block forming at the top. Price reverses from that bearish OB and breaks down through a support level. Later, price rallies back up to retest that same broken level — and instead of holding as support again, it now acts as resistance. That flipped level is the breaker block. The same structural point on the chart played two completely different roles depending on which side of the break price was on.
Rejection Block
A rejection block is a variation built around the wick rather than the candle body. It forms when price pushes into a level and gets rejected hard, leaving a long wick behind. That wick — not the body — becomes the zone worth watching, and it often works alongside a regular order block rather than replacing it.
Mitigation Block
A mitigation block is simply an order block that's already been visited once. The first touch used up part of the institutional interest sitting there; a second visit is trading whatever's left. It still tends to produce a reaction, just usually a smaller one than the first time — and by the third visit, there's rarely anything meaningful left to trade. This is the same mitigation status already scored in the grading system above.
My Observations on Order Blocks (Jan–June 2026)
A few things worth knowing before you build a strategy entirely around this concept, based on what's actually been tracked over the first half of 2026:
Not every order block works. Even a textbook-valid OB fails to produce a reaction a meaningful portion of the time. Grading reduces this, but doesn't eliminate it.
Not every order block creates a fair value gap. FVG confluence is a bonus, not a requirement — plenty of valid, reactive order blocks form without one.
Not every order block gets retested. Some zones simply never get revisited, especially on higher timeframes where price can trend away for a long stretch.
4-hour order blocks are more accurate to trade than 30-minute ones. The higher timeframe zone holds up more consistently — this is the direct trade-off against the "fewer setups" issue mentioned earlier.
30-minute order blocks don't always work — stop hunts are common. A meaningful share of 30-minute OBs get swept rather than respected. If you're trading this timeframe for the extra frequency, expect this trade-off and size accordingly.
Mistakes to Avoid With Order Blocks
Marking the whole consolidation instead of one candle. Only the specific qualifying candle — the last opposing candle, the spinning top, or the large-wick candle — counts, not the entire sequence leading up to the move.
Calling every strong candle an order block. Without a real structural break following it, a strong candle is just volatility, not proof of institutional involvement.
Ignoring volume entirely. Skipping the volume check means treating a low-conviction move the same as a genuine institutional footprint — and the same applies on the retest, not just at formation.
Trading a zone that's already been mitigated. Once price has closed all the way through a zone, it no longer holds meaningful institutional interest — remove it and move on.
Marking order blocks only on low timeframes. A zone on the 1-minute chart carries far less weight than one identified on the 4-hour or daily. Always establish the zone on a higher timeframe first.
Trading against the daily trend. A clean lower-timeframe OB inside an opposing daily trend can look perfect and still lose.
Placing the stop inside the OB body instead of beyond the wick. A normal wick into the zone shouldn't be enough to stop you out of a still-valid setup.
Entering the moment an OB forms, without waiting for the retest. The retest is where real confirmation shows up, not the initial print — "getting close" isn't a signal either; let price actually come to you.
Holding mechanically for a second target after a reversal signal. If price reaches Target 1 and then reverses through it, that's a reason to exit, not a reason to keep waiting for Target 2.
Opening new entries over the weekend, especially in crypto. Momentum can simply stall through low-liquidity weekend hours — plan around it rather than assuming continuation.
Having no exit plan before entering. Decide your partial-exit and breakeven levels in advance, not while the trade is already live.
FAQ
What is an order block in trading? A zone where big money placed a large chunk of its orders right before price took off in one direction — the last footprint of institutional activity before a strong, structure-breaking move.
Does an order block have to be a single candle? Not necessarily. While the classic definition points to one last opposing candle, a spinning top or a large-wick candle within the trend can just as validly mark the zone — what matters is that it shows the same signs of institutional activity before the reversal.
Can a valid order block exist without a fair value gap? Yes, though it's a weaker version. An FVG forming inside the impulse away from the order block adds a second, independent reason for price to return to that zone — without it, the setup relies on the order block alone.
Is a higher-volume candle always required for a valid order block? It's not strictly mandatory, but it's one of the clearest signs real size moved through that zone rather than retail activity. Treat it as a strong supporting signal rather than an absolute requirement.
How is an order block different from a rejection block? An order block is defined by the candle's body — where the last opposing candle sat before the move. A rejection block is defined by the wick — where price got pushed into and firmly rejected. They can appear at the same structural level and reinforce each other.
Does every order block eventually get mitigated? Most do, eventually, as price tends to revisit levels over time. But an order block can remain unmitigated for a long stretch if price simply never trades back to that zone again, especially on higher timeframes.
Where exactly should I enter inside the order block? It depends on your entry model. The tightest, most precise entry is the 50% CE of the FVG sitting inside the OB's impulse leg — not the first wick that touches the zone. If you're waiting for a lower-timeframe CHoCH/MSS instead, your entry is wherever that confirmation completes, which is usually deeper inside the zone.
What's the minimum reward-to-risk I should accept on an OB trade? 2:1 as a floor. If the distance to target is less than double the distance to the stop, skip the setup.
Should I trade order blocks on the 4-hour or the 30-minute timeframe? The 4-hour gives fewer but more reliable setups. The 30-minute gives more frequency but a higher rate of stop hunts. Choose based on whether you're trading intraday or swing, and size positions accordingly on the less reliable timeframe — or combine both, using the 4-hour zone with a lower-timeframe entry trigger.
Is there a guaranteed win rate for order block trading? No — and be wary of any source that claims one without showing real, sourced data. Treat this as a probability edge that needs strict risk management behind it, not a system with a fixed win rate.
Do I have to hold until my furthest target is hit? No. If price reaches an earlier target and then shows a reversal signal — like a candle closing back through the level — booking full profit there is a legitimate exit, not a missed opportunity.
How many order block setups should I expect in a month? On the 4-hour timeframe, roughly 2–4 valid setups a month is normal. On the 30-minute timeframe, expect more frequency but weigh it against the higher stop-hunt rate.
Conclusion
An order block is easy to spot once you stop looking for just "the last red candle before a rally" and start checking the full list: the right kind of candle, a decisive impulse, a broken swing point, ideally an FVG, and volume to back it up. Skip any one of those checks and you're marking a zone that looks right but has no real institutional weight behind it.
Once identification is solid, the rest is the system around it: grading the setup, choosing the right entry model, placing the stop beyond the wick (and against the right timeframe's zone), reading the liquidity on both sides of the trade, and using a target method suited to the instrument. That's what turns an institutional footprint into a repeatable edge rather than a lucky guess.
Grade every setup before risking capital, match your entry model to your risk tolerance, check volume before trusting a retest, don't hold mechanically for a second target once price gives you a reversal signal, and treat any target methodology — including the fibonacci extension approach above — as something to validate on your own charts before trusting it with real size.
Have a question about this article?
Comment on our latest Instagram post or send us a DM — we reply to every one.
@dhanith_officialWas this article helpful?
Click to rate
Founder, Dhanith Trading
7+ years trading Nifty, Bank Nifty, NSE stocks, and commodities — specializing in Smart Money Concepts (SMC) and ICT price action. Founder of Dhanith — a trading journal, intraday screener, and risk tools platform built for retail traders.
Dhanith Newsletter
Enjoyed this article? Get more like it.
New trading guides, candlestick patterns, SMC strategies, and tool updates — straight to your inbox. Free, for Indian traders.
No spam. Unsubscribe anytime.
Continue Reading