On this page
- Introduction
- What Is AMD in Trading?
- Why NY Open Is Important for AMD Traders
- Accumulation Before NY Open
- Manipulation at NY Open
- Distribution After the Liquidity Sweep
- Bullish AMD NY Open Setup
- Bearish AMD NY Open Setup
- AMD Setup for NQ Futures
- AMD Setup for ES Futures
- AMD Setup for SPY and QQQ
- AMD + Fair Value Gap Entry Model
- AMD NY Open Checklist
- Common Mistakes Traders Make
- FAQs About AMD and NY Open Trading
- Related Articles
AMD Trading Strategy for NY Open: Accumulation, Manipulation, Distribution Explained (2026)
Learn the AMD trading strategy for the New York open — accumulation, manipulation, and distribution explained with bullish and bearish setups for NQ, ES futures, SPY, and QQQ, plus the Fair Value Gap entry model.
Introduction
Every New York session opens with the same institutional script playing out, instrument after instrument. Price quietly builds a range. Then it lies to you — spiking through an obvious level just long enough to trigger every retail stop-loss sitting there. And then, once those stops are gone, the real move begins.
This is the AMD trading strategy — Accumulation, Manipulation, Distribution — and the New York open is where it shows up with the most consistency and the most liquidity behind it of any window in the trading day. This guide breaks the model down specifically for the instruments most commonly traded around NY open: NQ futures, ES futures, SPY, and QQQ, with complete bullish and bearish setups, a dedicated Fair Value Gap entry model, and a checklist you can run through before every session.
Quick Summary
- AMD = Accumulation, Manipulation, Distribution — also called ICT AMD or the Power of 3 trading strategy
- Accumulation builds the range before NY open; Manipulation is the liquidity sweep (stop hunt / fake breakout) through that range; Distribution is the real move that follows
- The NY open kill zone is the highest-liquidity window for this setup across NQ, ES, SPY, and QQQ
- The entry trigger is a confirmed market structure shift, not the sweep itself
- The most precise entry method layers a fair value gap entry on top of the market structure shift
- NQ futures move faster and require wider stops than ES futures; SPY and QQQ mirror NQ/ES respectively but trade on stock market hours
What Is AMD in Trading?
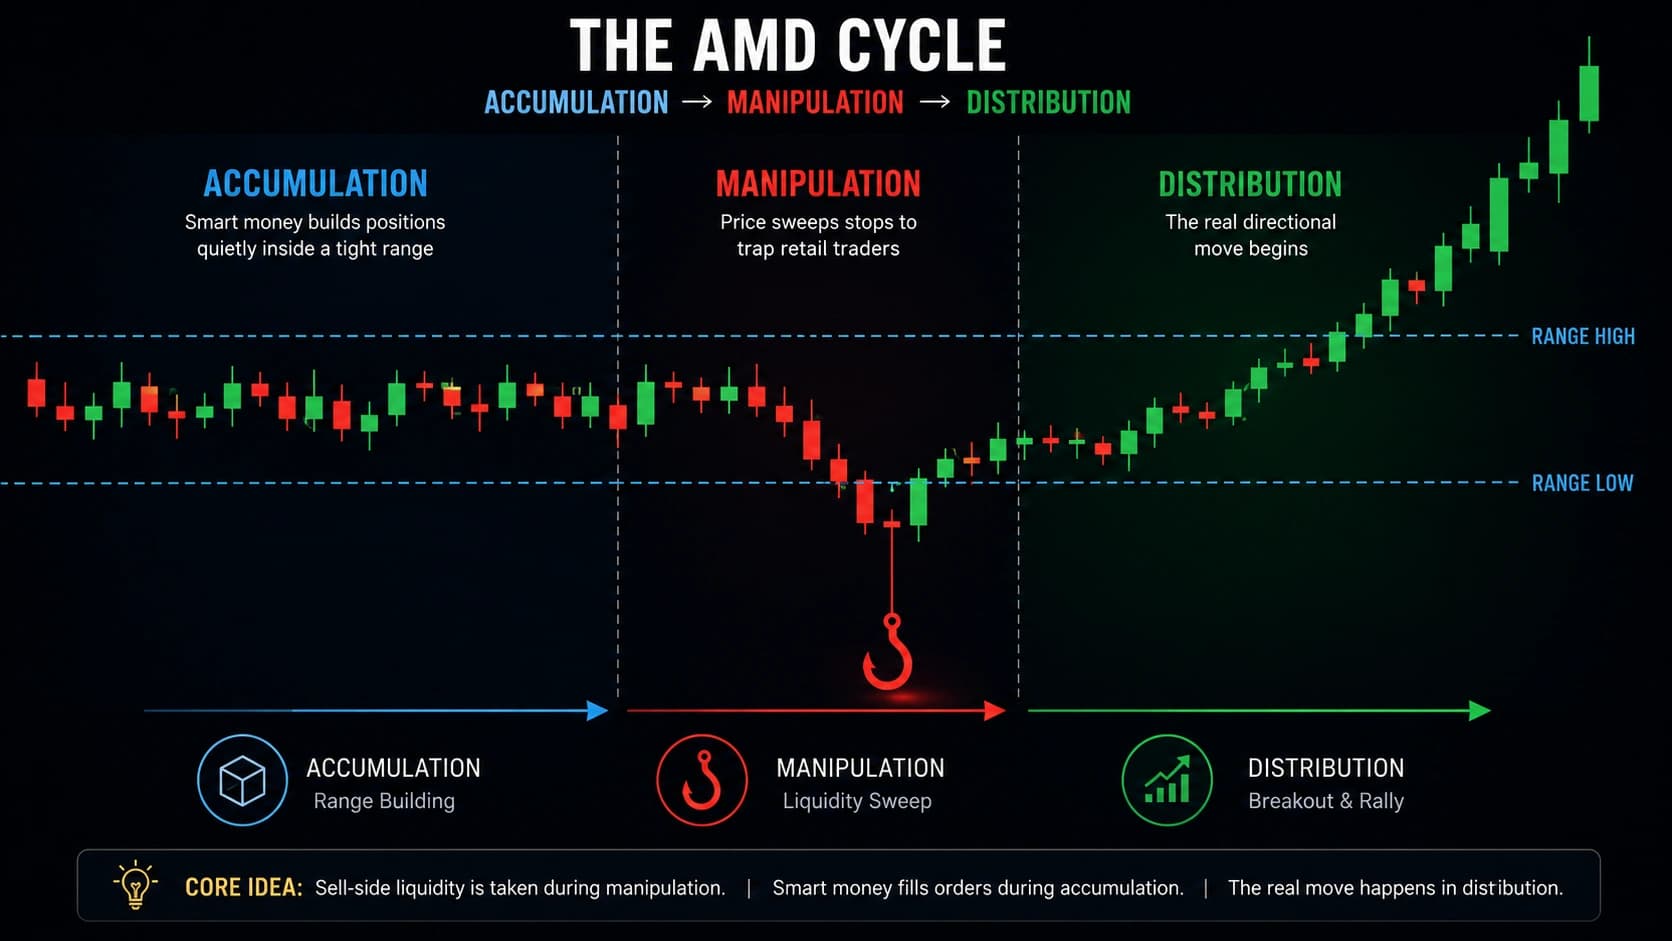
AMD stands for Accumulation, Manipulation, Distribution — a three-phase model describing how institutional order flow moves price across a session. It is also known as ICT AMD, named for Michael J. Huddleston (the Inner Circle Trader), or the Power of 3 trading strategy, since it breaks every session into exactly three repeating stages.
Accumulation is the build-up phase — price ranges quietly while large positions are built without alerting the broader market. Manipulation is the deliberate liquidity sweep — a sharp, often violent move through the accumulation range's high or low, designed to trigger a stop hunt and lure in fake breakout traders on the wrong side. Distribution is what comes after: the real, sustained directional move, and the only phase of the three that actually produces consistent profit.
The reason this model works is mechanical, not theoretical. Institutions need genuine liquidity to fill large orders. Retail stop-losses cluster predictably at obvious technical levels — the prior session's high, the prior session's low, the overnight range boundaries. When price pushes through one of those levels, it simultaneously triggers stop-losses and pulls in breakout traders entering on the spike. That combined order flow is exactly what large players use to get filled before reversing price in the direction they actually intended to trade. Once you see this mechanism clearly, the AMD trading strategy stops looking like a chart pattern and starts looking like exactly what it is: a map of where stop-losses get harvested, every single session.

Why NY Open Is Important for AMD Traders
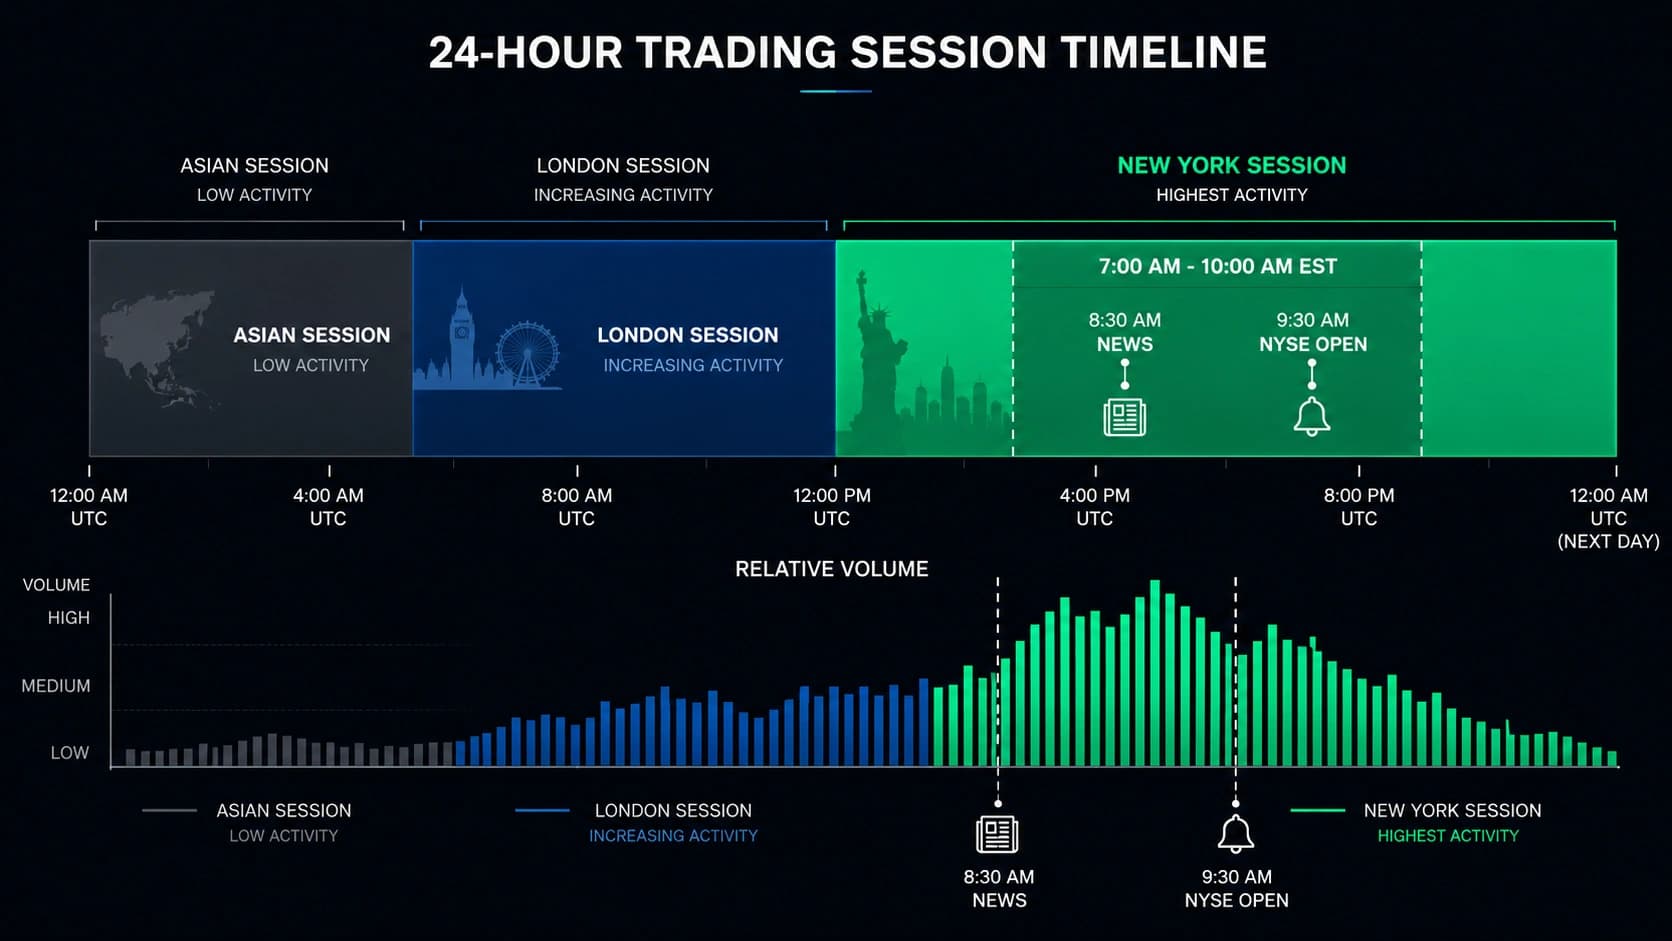
Not every hour of the trading day offers equal opportunity for this model. New York session trading specifically — and the New York open in particular — concentrates more genuine institutional volume into a short window than almost any other period across forex, futures, or US equities.
The official ICT New York kill zone runs from 7:00 AM to 10:00 AM EST, with two especially important sub-windows for AMD purposes:
- 8:30 AM EST — the standard US economic data release time, which frequently produces the cleanest, most violent manipulation phase of the entire session
- 9:30 AM EST — the NYSE and Nasdaq cash market open, which adds a second, distinct wave of volume and often a second manipulation-and-reversal sequence for equity-linked instruments like SPY and QQQ specifically
This matters enormously for NQ futures, ES futures, SPY, and QQQ because all four of these instruments draw their deepest liquidity from the same overlapping pool of US institutional capital. A liquidity sweep that occurs at 3:00 AM EST on these instruments is operating on a fraction of the volume that the same sweep carries at 8:30 or 9:30 AM EST — meaning the resulting distribution phase is statistically far less reliable outside the kill zone than within it.
Practical rule: mark your accumulation range before 7:00 AM EST, and do not act on anything that happens before the kill zone genuinely opens. Acting early means trading thin, low-conviction price action instead of the structured institutional sequence this entire model is built around.
Accumulation Before NY Open
The accumulation phase for NY-open AMD trading is the range that builds during the overnight session — broadly, the period from the prior NY session's close through the Asian session and into the early London hours, right up until the New York kill zone opens.
What to mark before the session begins:
- The overnight high and overnight low — the boundaries of the accumulation range itself
- The prior day's high and low — a secondary liquidity reference that often becomes the eventual distribution target
- Any equal highs or equal lows — multiple swing points sitting at nearly the same price, which represent an unusually concentrated, attractive pool of resting stop-losses
- Any unfilled fair value gaps from the prior session, which frequently act as magnets for the eventual distribution move
What genuine accumulation looks like on the chart: tight, sideways price action with no strong directional conviction, paired with comparatively low and declining volume. If the overnight session already shows a powerful, one-directional trending move with rising volume, you are likely looking at someone else's distribution phase rather than a genuine accumulation range still waiting to be tested at NY open.
For NQ and ES futures specifically, this overnight range is often referred to informally as the "Asian range" or "globex range," and is visible directly on most futures charting platforms as the low-volume consolidation that precedes the NY session's open. For SPY and QQQ, since US cash equities do not trade around the clock the way futures do, the relevant accumulation reference becomes the pre-market range — the high and low established during pre-market trading hours, plus the prior day's regular-session high and low.
Manipulation at NY Open
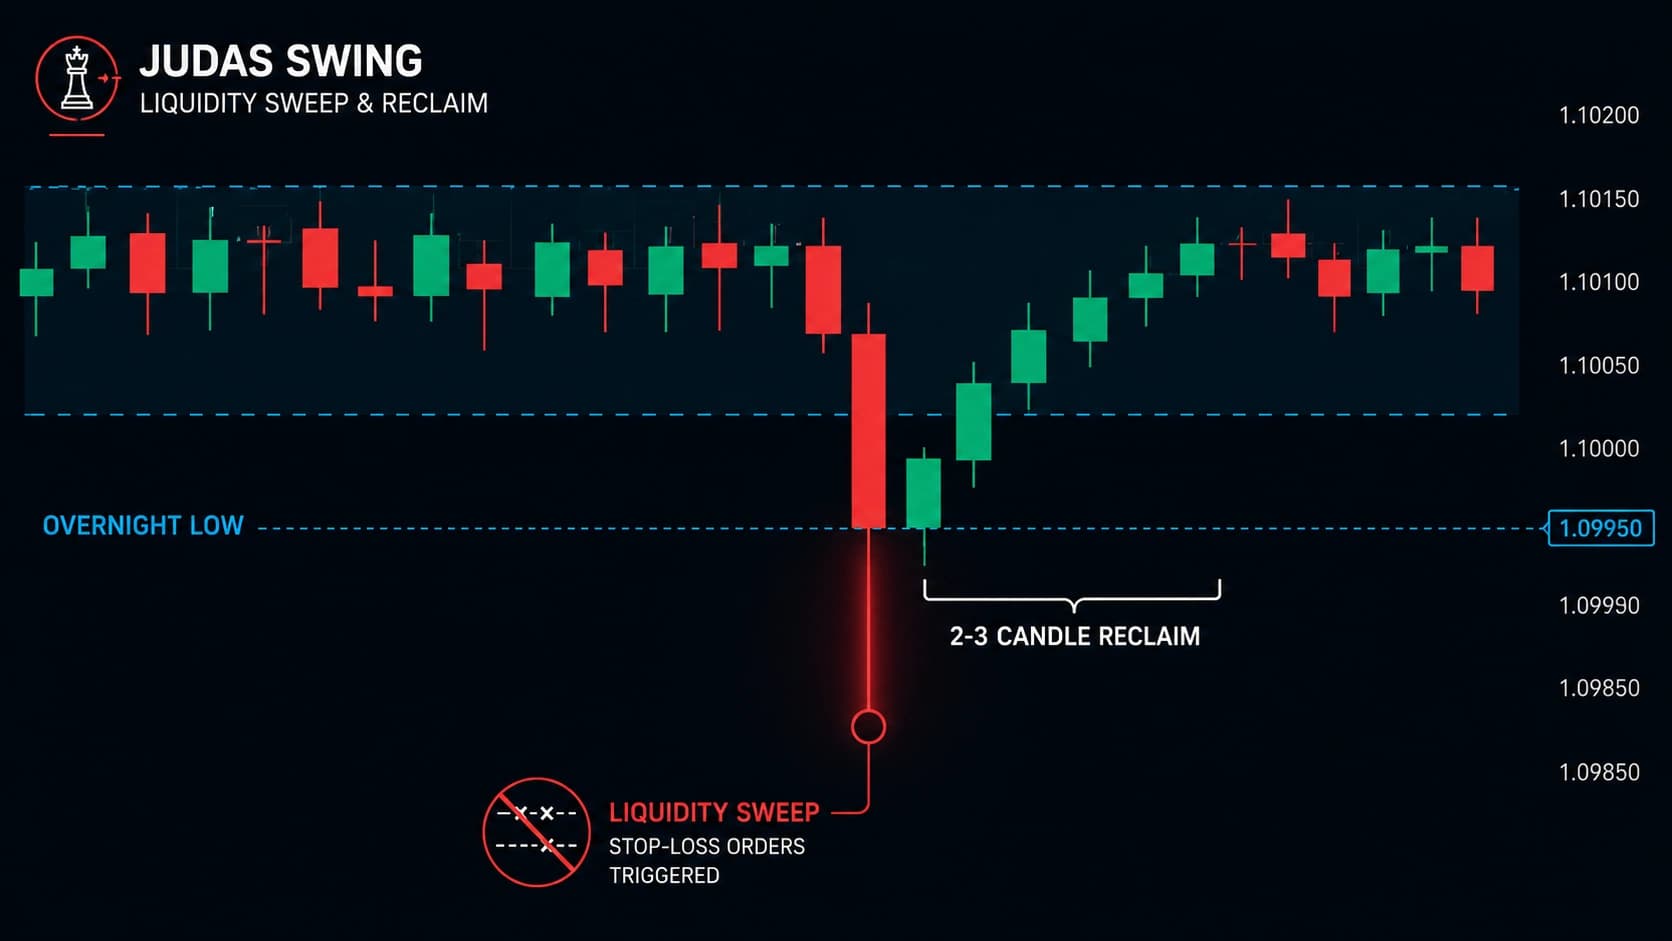
The manipulation phase is where the liquidity sweep happens — and where most retail traders get caught.
What it looks like: price spikes sharply through the accumulation range's high or low, frequently coinciding with the 8:30 AM EST news release or the 9:30 AM cash open. This spike triggers two things simultaneously: stop-losses belonging to traders positioned against the move, and fresh entries from breakout traders who see price clearing an obvious level and assume a genuine trend continuation is underway. Both groups end up on the same side of the market — the side about to lose.
This is the textbook stop hunt: a quick, aggressive price spike designed specifically to trigger retail stop-losses placed just outside a consolidation range. It is also, from the perspective of the trader who buys or sells the spike itself, a fake breakout — a move that looks structurally identical to a genuine trend continuation but resolves in the opposite direction within a handful of candles.
The critical test — is it manipulation, or a real breakout?
This is the single most important judgment call in the entire AMD trading strategy. The rule: if price cannot reclaim the swept level within roughly 2–3 candles on the 5-minute chart, it was not manipulation — it was a genuine breakout, and you should not fade it.
Concretely: NQ sweeps above yesterday's high at 8:30 AM, then five minutes later is still trading above that level with no sign of reversing. That is not a Judas Swing playing out — that is real, continuing order flow, and the correct response is to abandon any reversal bias immediately rather than waiting stubbornly for a reversal the price action is actively telling you is not coming.
Pro Tip: Watch ES and NQ together during the manipulation phase. If NQ sweeps a high but ES fails to make an equally aggressive new high at the same time — a divergence sometimes referred to as SMT (Smart Money Tool) divergence — this lack of agreement between the two correlated indices is itself a warning sign that the move lacks broad conviction, increasing the odds you are watching genuine manipulation rather than a real breakout.
Distribution After the Liquidity Sweep
Once the sweep has occurred and price fails the reclaim test in the expected direction — meaning it reverses back through the swept level — you are now watching the distribution phase begin. This is the part of the AMD trading strategy that actually pays, and it requires one further confirmation before you risk capital: a market structure shift.
A market structure shift (MSS) occurs when price breaks a previously established swing high or swing low on your entry timeframe, in the direction opposite to the sweep. For a bullish sequence — where the sweep took out a low — the MSS is a clean break above the most recent minor swing high on your 1-minute or 5-minute chart. For a bearish sequence, the MSS is a break below the most recent minor swing low.
This break, not the sweep and not even the reclaim alone, is what confirms institutional intent has genuinely shifted. Many traders shorten this to a simple internal rule: no MSS, no trade. The sweep tells you where liquidity was taken. The MSS tells you which direction that liquidity is now being delivered.
Once the MSS confirms, the distribution phase typically runs toward the next external liquidity pool — the opposite side of the prior day's range, an untested equal-highs/equal-lows cluster, or a significant unfilled fair value gap sitting further along the chart. Distribution is not random; it has a destination, and that destination is almost always one of the levels you marked during the accumulation phase, before the session even began.
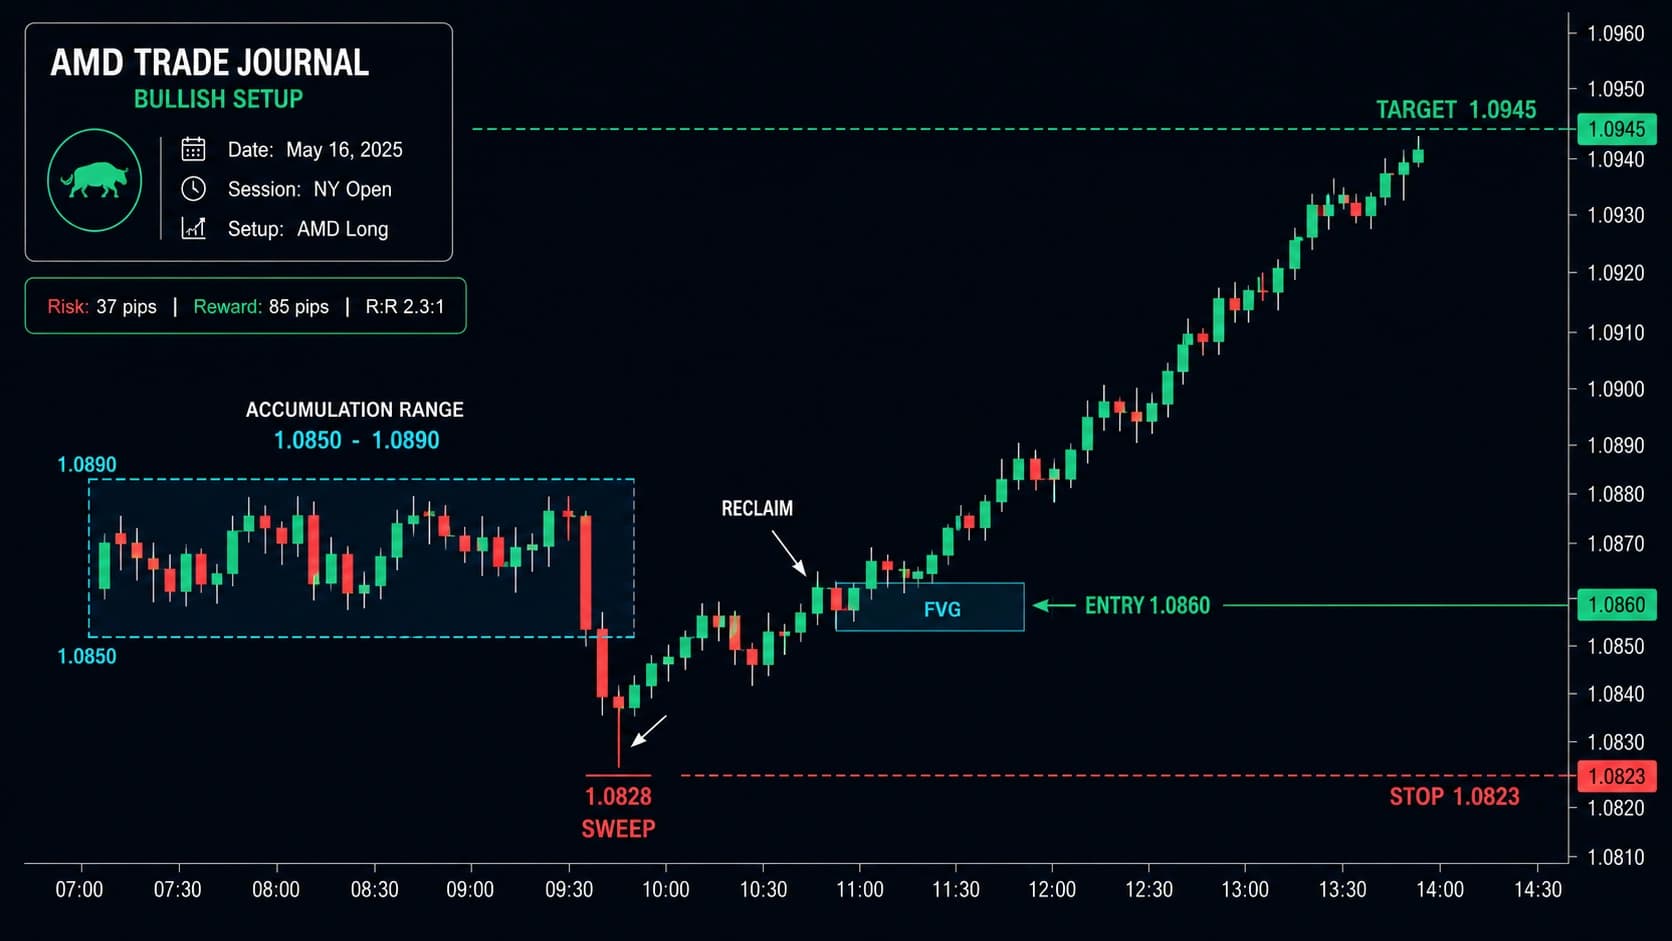
Bullish AMD NY Open Setup
Step-by-step sequence:
- Accumulation: Price ranges overnight between a defined high and low — for example, NQ holding between 24,420 and 24,475.
- Manipulation: At 8:30 AM EST, a news release spikes price below 24,420, sweeping sell-side liquidity (stops belonging to long positions) down to 24,395.
- Reclaim test: Within 2–3 candles on the 5-minute chart, price reclaims back above 24,420 — confirming this was manipulation, not a genuine breakdown.
- Market structure shift: Price breaks above the most recent minor 5-minute swing high, confirming bullish intent.
- Entry zone: The sharp upward displacement that produced the MSS leaves behind a fair value gap. Price retraces into this gap.
- Entry: Long, at or near the 50% level of the fair value gap.
- Stop loss: Below the swept low of 24,395, with a small buffer — for example, 24,388.
- Target: The prior day's high, or the next untested equal-highs cluster above current price.
Entry:  24,430 (FVG midpoint)
Stop:   24,388
Risk:   42 points

Target: 24,540 (prior day high)
Reward: 110 points

Risk-Reward Ratio: 110 ÷ 42 ≈ 2.6:1
Bearish AMD NY Open Setup
Step-by-step sequence:
- Accumulation: ES ranges overnight between a defined high and low — for example, 5,820 to 5,840.
- Manipulation: At the 9:30 AM cash open, price spikes above 5,840, sweeping buy-side liquidity up to 5,848, triggering breakout buyers and stopping out short positions.
- Reclaim test: Within 2–3 candles, price reclaims back below 5,840 — confirming manipulation rather than genuine continuation.
- Market structure shift: Price breaks below the most recent minor 5-minute swing low, confirming bearish intent.
- Entry zone: The sharp downward displacement leaves a fair value gap. Price retraces upward into this gap.
- Entry: Short, at or near the 50% level of the fair value gap.
- Stop loss: Above the swept high of 5,848, with a small buffer — for example, 5,851.
- Target: The prior day's low, or the next untested liquidity pool below current price.
Entry:  5,837 (FVG midpoint)
Stop:   5,851
Risk:   14 points

Target: 5,795 (prior day low)
Reward: 42 points

Risk-Reward Ratio: 42 ÷ 14 = 3:1
AMD Setup for NQ Futures
NQ futures (the E-mini Nasdaq-100) are the most volatile of the major index futures, and the AMD trading strategy needs specific adjustments to account for that.
Why NQ behaves differently: Due to fewer large resting orders in the NQ order book relative to ES, price moves can stretch quickly and reverse just as fast. This means NQ's manipulation phase often produces a larger, sharper wick than the equivalent ES sweep at the same moment — and it also means NQ demands tighter risk discipline and faster decision-making once the reclaim test and MSS confirmation arrive.
Adjustments for trading AMD on NQ:
- Wider stop buffers. Because NQ's sweep wicks tend to overshoot further than ES, place your stop with a more generous buffer beyond the swept extreme than you would on ES, to avoid being clipped by a second, smaller probe of the same level.
- Watch for SMT divergence with ES. If NQ sweeps a high but ES does not make an equally convincing new high at the same time, this divergence is a useful early warning that the NQ move lacks broad market agreement — a higher-probability signal that you are watching manipulation rather than genuine continuation. This is one of the most widely used confluence tools specifically for NQ-based AMD setups, since the strategy depends on comparing two correlated instruments' highs and lows against each other.
- Watch for confirmation candles, not just MSS. Given NQ's tendency to fake out even the MSS itself on lower timeframes, some traders require the MSS to be confirmed on a slightly higher timeframe (3-minute or 5-minute, rather than 1-minute) before entering on NQ specifically.
A documented real-world NQ example: price action on NQ swept buy-side liquidity on the daily timeframe during a Thursday New York session, then consolidated just below that high — setting up a classic ICT "Reversal Friday" scenario. Traders watching for this specific sequence looked for a Judas Swing to the upside during the following session's New York AM window, luring breakout buyers above the prior day's high. Once that buy-side liquidity was taken, the plan was to wait for a market structure shift on the 5-minute or 3-minute chart, enter on a fair value gap or refined order block, place the stop just above the sweep high, and target the weekly open area or a 1-hour order block as the first objective, with a deeper previous balance range as a secondary target. This kind of fully pre-planned sequence — accumulation already identified, manipulation anticipated in advance, entry and target levels mapped before the session even opens — is the level of preparation that separates disciplined NQ AMD trading from reactive guessing.
AMD Setup for ES Futures
ES futures (the E-mini S&P 500) are comparatively more stable than NQ, with fewer extreme fluctuations — which makes ES generally better suited to more structured, mechanically rules-based AMD setups than the faster, more volatile NQ.
Why ES is often the preferred instrument for AMD beginners: the accumulation ranges tend to be tighter and more clearly defined relative to ES's overall daily range, the manipulation wicks tend to be less extreme (reducing the risk of an oversized stop loss), and the resulting distribution moves, while smaller in absolute point terms than NQ, tend to be cleaner and more orderly.
Adjustments for trading AMD on ES:
- Tighter stops are generally appropriate. Since ES's manipulation wicks are typically less extreme than NQ's, you can often place your stop closer to the swept level without being clipped by ordinary noise — improving your risk-reward ratio relative to the equivalent NQ setup.
- ES often leads or confirms NQ moves. Many traders specifically watch ES's reaction to a sweep as a confirmation filter before trusting the equivalent NQ setup, given ES's relative stability — if ES is not confirming the same directional bias NQ's structure suggests, treat the NQ setup with additional caution.
- The 9:30 AM cash open often produces ES's cleanest manipulation phase, given ES's tight correlation with the broader S&P 500 cash market and the concentrated order flow that floods in at the cash open specifically.
AMD Setup for SPY and QQQ
SPY and QQQ are the ETF equivalents of ES and NQ respectively, and the same principles apply — but trading AMD on these instruments requires a few specific adjustments since they trade on standard US stock market hours rather than the nearly continuous futures session.
Key differences from futures trading:
- No true overnight session in the same sense. SPY and QQQ's "accumulation" reference becomes the pre-market range (typically 4:00–9:30 AM EST) plus the prior regular session's high and low, rather than a continuous overnight futures range.
- The 9:30 AM cash open is the dominant manipulation window, since this is the moment SPY and QQQ transition from comparatively thin pre-market liquidity into full regular-session liquidity — producing a sharp, often violent initial spike that frequently represents the manipulation phase in its purest form for these two tickers.
- SPY and QQQ tend to mirror their futures counterparts (ES and NQ) closely, since both ETFs are designed to track the same underlying indices. A trader watching ES and NQ for SMT divergence during the futures pre-market session can carry that same directional read directly into the SPY/QQQ cash-market open.
A practical SPY/QQQ AMD setup:
- Mark the pre-market high/low and the prior regular session's high/low before 9:30 AM EST
- At the 9:30 AM open, watch for an immediate spike through one of these levels — this is frequently the manipulation phase compressed into the first few minutes of regular trading
- Apply the reclaim test on the 1-minute or 5-minute chart
- Wait for the market structure shift before considering any entry
- Enter on the retracement into the resulting fair value gap, exactly as with NQ or ES
An important caution specific to SPY and QQQ: because these are ETFs rather than futures, after-hours and pre-market liquidity is meaningfully thinner than the corresponding futures market — meaning pre-market price action on SPY and QQQ should be weighted with somewhat more caution as an accumulation reference than the deeper, more continuously liquid NQ and ES futures range.
AMD + Fair Value Gap Entry Model
The fair value gap entry is the precision layer that turns a confirmed AMD sequence into an exact, repeatable trade trigger rather than a vague directional read.
What a fair value gap is: a three-candle price imbalance, created during a sharp displacement move, where the wick of the first candle does not overlap with the wick of the third candle — leaving a visible gap in the price delivery between them. This gap represents a zone the market moved through too quickly to establish genuine two-sided trading interest, and price frequently returns to "fill" or partially fill this zone before continuing in its original direction.
How it fits into the AMD sequence: the displacement move that produces your market structure shift is, by definition, a sharp, often single-direction push — and this exact kind of move is what creates fair value gaps. So in practice, every clean MSS following an AMD-style liquidity sweep tends to leave behind a tradeable fair value gap automatically, without needing to search for one separately.
The entry rule: wait for price to retrace back into this fair value gap — many traders specifically target the 50% midpoint of the gap — and enter there, rather than chasing the displacement candle itself after the MSS has already occurred.
Why this matters for NQ, ES, SPY, and QQQ specifically: these instruments, particularly NQ and ES around the NY open, regularly produce clean, well-formed fair value gaps during their displacement moves, given the volume and order flow concentrated in this specific window. The fair value gap entry model gives you a precise, advance-defined price level to enter at — rather than entering reactively the moment the MSS confirms, which often means chasing price after the best part of the move has already happened.
A related, more advanced variant — the Inverse Fair Value Gap (IFVG): some traders wait for price to actually displace through the original fair value gap and close back through it, inverting the gap's role from support into resistance (or vice versa), before entering on a return to this inverted zone. This model is specifically built around comparing two correlated instruments — most commonly NQ and ES, or SPY and QQQ — checking for SMT divergence between them as an additional confirmation layer before trusting the inverted gap as a valid entry zone.
AMD NY Open Checklist
Run through this sequence before and during every NY-open AMD setup:
Before the kill zone opens (pre-7:00 AM EST):
- Mark the overnight (or pre-market, for SPY/QQQ) high and low
- Mark the prior day's high and low
- Mark any equal highs/equal lows
- Mark any unfilled fair value gaps from the prior session
- Note any scheduled high-impact news releases (especially 8:30 AM EST)
During the kill zone (7:00–10:00 AM EST):
- Wait for the kill zone to genuinely open before acting on anything
- Watch for the liquidity sweep through one of your marked levels
- Apply the 2–3 candle reclaim test before assuming manipulation
- If trading NQ, check ES for SMT divergence confirmation (or the reverse)
- Wait for a confirmed market structure shift — no MSS, no trade
- Identify the fair value gap left behind by the MSS displacement
- Enter on the retracement into the gap, not on the displacement candle itself
Risk management:
- Stop loss placed beyond the swept extreme, with an instrument-appropriate buffer
- Target set at the next genuine external liquidity pool, not an arbitrary distance
- Position sized so the stop loss represents no more than 1% of account risk
- No more than 1–2 AMD setups taken per session
Dhanith Trading Journal
Track every trade. Find your real edge.
Log your setups, grade your entries, and review your trading patterns — all in one place. The journal built for serious SMC traders.
Common Mistakes Traders Make
Mistake 1 — Entering during the manipulation wick itself. Buying or selling the moment price spikes through a level, without waiting for the reclaim and the MSS. This is guessing, not trading the model.
Mistake 2 — Fading every sweep automatically, regardless of follow-through. Not every sweep is manipulation. Applying the 2–3 candle reclaim test rigorously, every time, is what prevents you from fighting a genuine breakout under the mistaken belief you are fading a fake breakout.
Mistake 3 — Ignoring SMT divergence between correlated instruments. Trading NQ in isolation without glancing at ES (or SPY without QQQ) means missing one of the simplest, most accessible confirmation tools available for exactly this kind of liquidity sweep setup.
Mistake 4 — Treating SPY/QQQ pre-market levels with the same confidence as NQ/ES overnight futures ranges. Thinner pre-market liquidity on the ETFs means these reference levels deserve somewhat more skepticism than the deeper, continuously liquid futures equivalents.
Mistake 5 — Skipping the market structure shift and entering on the reclaim alone. A reclaim of the swept level is necessary but not sufficient. The MSS — a genuine break of the opposing swing point — is the actual entry trigger.
Mistake 6 — Overtrading the model across too many instruments simultaneously. Trying to run the full AMD checklist live across NQ, ES, SPY, and QQQ all at once during a single kill zone window typically produces worse execution on all four than focusing on one or two correlated instruments with full attention.
FAQs About AMD and NY Open Trading
Q: What does AMD stand for in trading? AMD stands for Accumulation, Manipulation, Distribution — a three-phase price-action model, also called ICT AMD or the Power of 3 trading strategy, describing how institutional order flow builds positions quietly (accumulation), triggers a liquidity sweep or stop hunt to trap retail traders (manipulation), and then delivers the real directional move (distribution).
Q: What is the best time to trade the AMD strategy at NY open? The official New York kill zone runs 7:00–10:00 AM EST, with the 8:30 AM economic news release and the 9:30 AM cash market open as the two highest-probability windows for the manipulation phase specifically, given the concentrated institutional volume present at both moments.
Q: How do I know if a move is manipulation or a real breakout? Apply the reclaim test: if price cannot reclaim the swept level within roughly 2–3 candles on the 5-minute chart, it is not manipulation — it is a genuine breakout, and the correct response is to abandon any reversal bias rather than continuing to fade the move.
Q: Is NQ or ES better for trading the AMD strategy? ES is generally considered more suitable for traders newer to the AMD model, given its comparatively tighter ranges and less extreme manipulation wicks. NQ moves faster and offers larger point-based rewards but requires wider stops and faster decision-making given its higher volatility and thinner resting liquidity.
Q: Can the AMD strategy be applied to SPY and QQQ? Yes — SPY and QQQ closely mirror ES and NQ respectively, but trade on standard stock market hours rather than a continuous futures session. The relevant accumulation reference becomes the pre-market range plus the prior regular session's high and low, with the 9:30 AM cash open typically producing the clearest manipulation phase for both tickers.
Q: What is a fair value gap entry in the AMD model? A fair value gap entry uses the three-candle price imbalance left behind by the sharp displacement move that confirms your market structure shift. Rather than entering on the displacement candle itself, traders wait for price to retrace back into this gap — often targeting its 50% midpoint — for a more precise, better-defined entry price.
Q: What is a market structure shift and why is it required before entering? A market structure shift is a confirmed break of a recent swing high or swing low, in the direction opposite to the manipulation sweep, on your chosen entry timeframe. It is required because the sweep and the reclaim alone do not confirm genuine directional intent — the MSS is the specific structural evidence that distribution has actually begun, which is why many traders apply a strict "no MSS, no trade" rule.
Related Articles
- Accumulation, Manipulation, Distribution (AMD Cycle) — The pillar guide this article builds on: the complete AMD framework, Judas Swing mechanics, and multi-timeframe application
- SMC Killzones: The Complete Trading Guide — The session-timing foundation: why the NY AM window (7:00–10:00 AM EST) produces the highest-probability AMD setups
- Liquidity Sweeps: The Complete Mastery Guide — The complete mechanics of stop hunts and how to enter after the sweep confirms the reversal
- Fair Value Gaps: The Complete Mastery Guide — Every AMD distribution impulse creates FVGs — learn to grade and trade them with precision
- SMC Market Structure: BOS, CHoCH and Strong vs Weak Levels — The market structure shift (MSS) that confirms distribution has begun is the entry trigger for every AMD setup
- Support and Resistance: The Complete Trading Guide — Accumulation ranges function as dynamic support/resistance — understand why AMD levels hold
- Volume Analysis: The Complete Trading Guide — Declining volume in accumulation and expanding volume in distribution are the mechanical confirmation tools for AMD
Further reading: RSI Trading Strategy: Complete Guide | Bollinger Bands Trading Strategy | Important Candlestick Patterns: The Complete Guide | Technical Analysis Mastery: The Complete Guide
Disclaimer: This article is for educational purposes only and does not constitute financial or investment advice. Trading futures, ETFs, and other leveraged financial products carries a high level of risk and may result in losses exceeding your initial investment. Past performance of any pattern or strategy does not guarantee future results. Always use proper risk management, including appropriate stop-loss orders and position sizing, before entering any trade.
Was this article helpful?
Click to rate
Trader & Founder, Dhanith Trading
Full-time trader focused on price action, Smart Money Concepts, and intraday strategies for Indian markets. Founder of Dhanith — a trading journal, intraday screener, and risk tools platform built for retail traders.
Dhanith Newsletter
Enjoyed this article? Get more like it.
New trading guides, candlestick patterns, SMC strategies, and tool updates — straight to your inbox. Free, for Indian traders.
No spam. Unsubscribe anytime.
Continue Reading

