On this page
- What Is a Liquidity Sweep SMC ICT Trading?
- Types of Liquidity — Where It Sits on the Chart
- Why Liquidity Sweeps Are Necessary
- How to Identify Liquidity Sweeps on Chart?
- Bullish and Bearish Liquidity Sweeps
- How to Trade a Liquidity Sweeps
- Entry, Stop Loss, and Target Rules for Liquidity Sweeps
- Marking Liquidity Before the Session
- Where Liquidity Sweeps Generally Happen
- Common Mistakes while Identify Liquidity
- FAQ
- Conclusion
Master liquidity sweeps in 2026. Learn buy-side vs sell-side liquidity, how to identify stop hunts, liquidity sweep vs breakout, 4 proven strategies, entry models, and the 8 most common mistakes — with stock trading examples.
Liquidity Sweeps Explained: The Complete SMC Trading Guide (2026)
What Is a Liquidity Sweep SMC ICT Trading?
Before understanding liquidity sweeps we must understand where Liquidity is available why liquidity needs to be sweep.
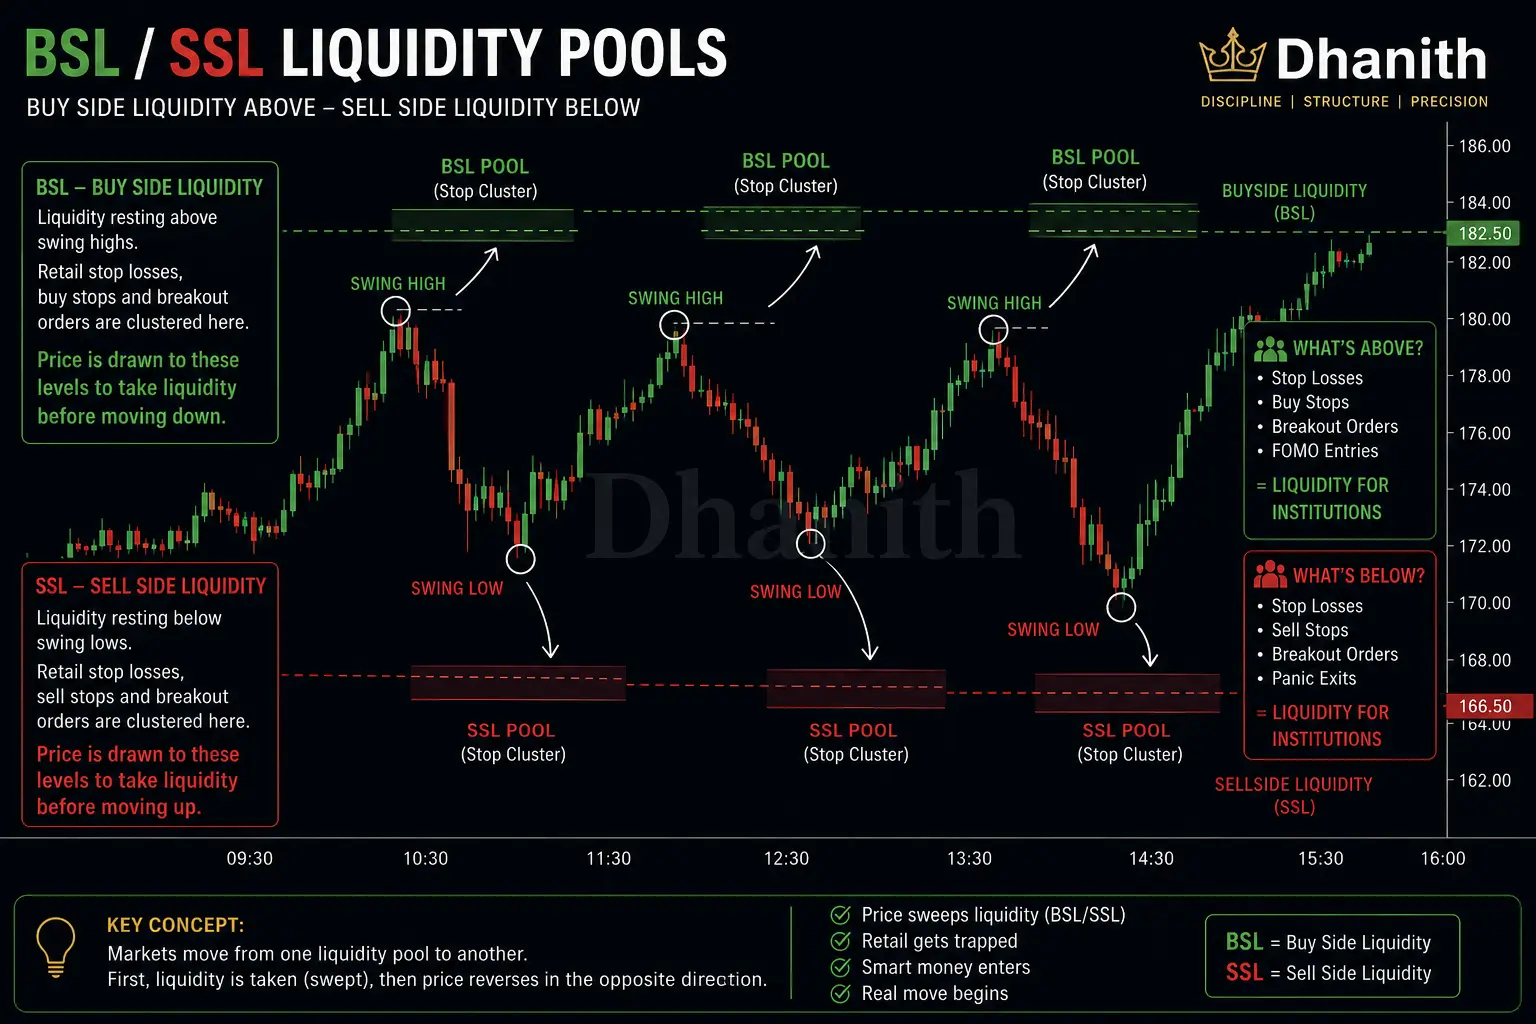
Liquidity, in this context, simply means resting orders — the stop losses and pending orders sitting on the order book at a given price. Every swing high and swing low on a chart has liquidity sitting just beyond it, because that's exactly where retail traders place their stops.
A liquidity sweep is what happens when price is deliberately pushed just beyond one of those levels to trigger that resting liquidity, before reversing. It isn't random, and it isn't targeting you personally — it's targeting the cluster of orders sitting at the most obvious level on the chart, the one every retail trader marked the same way.
Liquidity sweeps sit underneath almost every other SMC concept. Order blocks, fair value gaps, and market structure all connect back to the same reality: institutions need your stop losses to fill their orders. The sweep is how they collect that liquidity. The reversal that follows is the real move.
Types of Liquidity — Where It Sits on the Chart
Not all liquidity pools are equally significant. Here's where the meaningful ones actually form.
Swing highs and swing lows. Every clearly visible peak or trough attracts stop orders just beyond it — shorts stop above a swing high, longs stop below a swing low. The more prominent the swing point, the larger the cluster resting there.
Equal highs and equal lows. When price creates two or more peaks or troughs at nearly the same level, most traders read it as textbook "double top" or "double bottom" resistance and support — and place stops just beyond it. This uniform behavior is exactly what makes equal highs and equal lows the single most predictable liquidity pool in SMC.
Trendline liquidity. A trendline connecting a series of higher lows or lower highs is watched closely by a huge number of traders, and stops tend to cluster just beyond it. A sweep of trendline liquidity often looks like a "clean break of trend" right before price reverses back the other way.
Double tops and double bottoms. These are really a specific case of equal highs/lows, but worth calling out on their own — they're one of the most widely taught retail patterns, which is exactly why the liquidity sitting just beyond them is so reliably swept.
Prior day, week, or session highs and lows. These levels are tracked systematically by both retail traders and algorithmic systems, making them dependable sweep targets.
Round numbers. Psychological levels — like $100 or $200 — attract a disproportionate concentration of orders simply because so many traders use them as reference points.
Internal vs. external liquidity. External liquidity sits at the obvious swing highs and lows that define the overall trend — the primary targets before a major directional move. Internal liquidity sits inside the range between major swings, targeted before smaller, intermediate moves.
Why Liquidity Sweeps Are Necessary
Every trade needs a counterparty. For a retail trader, that's a non-issue — one contract, one share, filled instantly. For an institution trying to buy or sell millions of shares, it's a genuine problem: executing that size directly at market would move price sharply against itself before the position is even half filled.
Institutions solve this by finding liquidity pools — clusters of resting orders that can absorb a large position without excessive slippage. And the largest, most predictable clusters sit exactly where retail traders place their stops: just beyond the obvious swing highs and lows. A sweep isn't manipulation for its own sake — it's the mechanism by which a large position actually gets filled.
How to Identify Liquidity Sweeps on Chart?
This is the single most important skill in trading this concept — telling a genuine reversal sweep apart from a real breakout that happens to test the same level.
The close matters more than the wick. A liquidity sweep closes back inside the prior range, usually within 1–5 candles. A genuine breakout closes beyond the level and subsequent candles keep building structure outside the old range.
Volume behaves differently. In a sweep, volume spikes sharply at the moment stops are triggered, then fades quickly as price reverses. In a real breakout, volume expands on the break and tends to stay elevated.
Speed of the return. A sweep reverses fast. A breakout may retest the broken level, but it holds and continues rather than snapping back through it.
Higher timeframe alignment. A genuine breakout usually aligns with the higher timeframe trend. A sweep often runs directly against it — which is part of why it works as a trap.
How obvious the level is. The more visible and widely-watched a level is — equal highs, a clean trendline, a round number — the more likely it's a sweep target rather than a level that will actually hold as support or resistance once broken.
The rule that ties all five together: never act on a wick. Wait for the candle close, and judge whether price is accepting the new level (breakout) or rejecting it (sweep).
Bullish and Bearish Liquidity Sweeps
A sell-side Liquidity sweep (bullish setup): price drops below a swing low, triggering the stops of long traders and the sell orders of breakdown traders. Institutions buy against that flood of selling. Price reverses sharply upward. After this kind of sweep, bias shifts bullish — the liquidity needed for a real move up has just been collected.
A buy-side Liquidity sweep (bearish setup): price spikes above a swing high, triggering the stops of short traders and the buy orders of breakout chasers. Institutions sell against that surge. Price reverses sharply downward. Bias shifts bearish.
Difference between Liquidity grab and liquidity sweep. A grab wicks beyond the level and closes back inside on the very same candle. A sweep may spend a candle or two beyond the level before reversing — it takes slightly longer and convinces more traders the move is real, but for trading purposes, both are treated the same way: wait for the reversal, then look for confirmation.
How to Trade a Liquidity Sweeps
Sweep and reverse (the basic model). Wait for the sweep to close back inside the range, drop to a lower timeframe, and wait for a CHoCH or MSS in the new direction before entering. Stop below the sweep's wick extreme, target the next opposing liquidity pool.
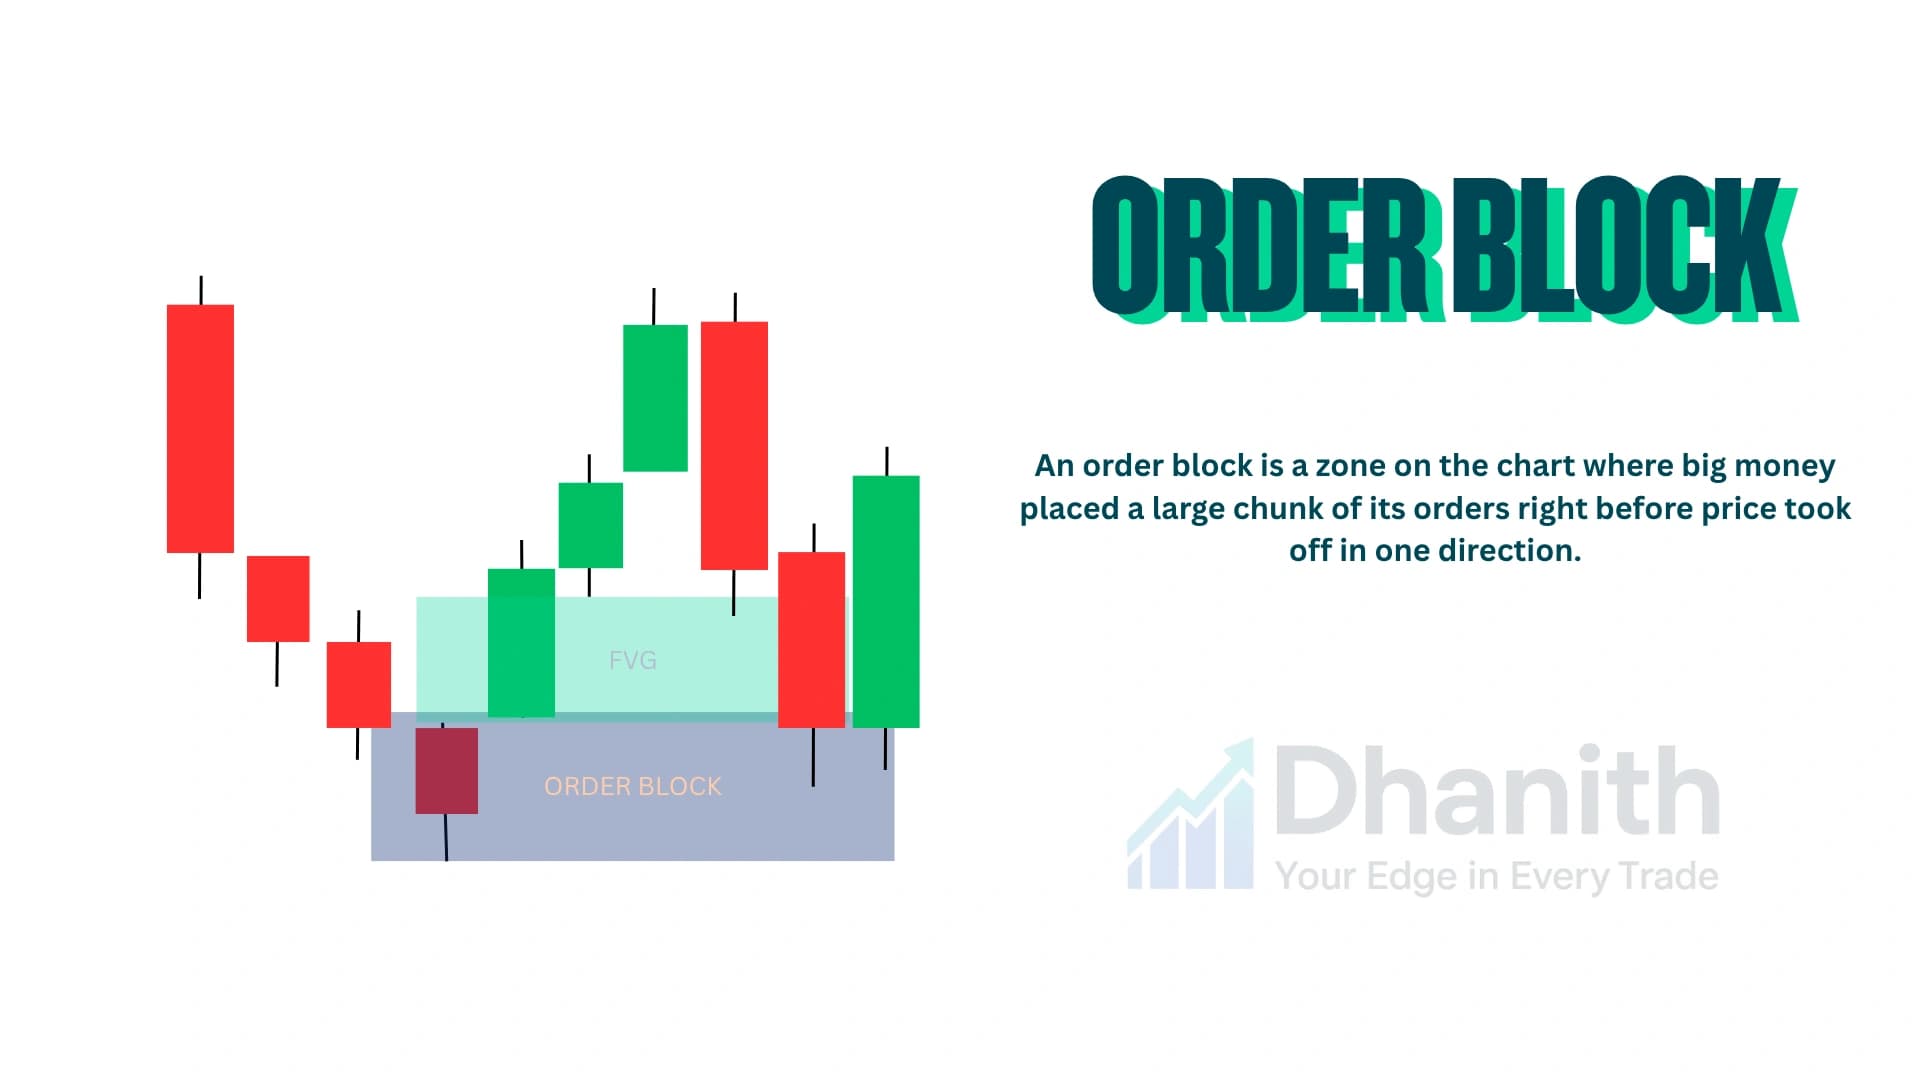
Sweep into an order block. The sweep is followed by price reversing into a nearby order block. Wait for a lower-timeframe CHoCH within that zone before entering — see Order Blocks for the full entry mechanics.
Sweep into a fair value gap. The reversal displacement after the sweep leaves behind an FVG. Enter at the FVG's midpoint once price retraces into it — see Fair Value Gaps for how to grade and enter these.
The multi-timeframe cascade (advanced). A weekly liquidity level gets swept, price approaches an unmitigated daily order block, a 4-hour FVG sits inside that zone, and a 15-minute CHoCH confirms entry. This stacking of confirmations across timeframes is what produces the largest reward-to-risk setups — often 5:1 or higher — because the stop stays tight while the target is a much larger liquidity pool.
Entry, Stop Loss, and Target Rules for Liquidity Sweeps
Never enter during the sweep itself. The sweep is not the trade — it's the setup. The entry comes after the reversal is confirmed.
Wait for the candle close, not just a wick through the level, before treating anything as a genuine sweep.
Require lower-timeframe confirmation — a CHoCH or MSS on a smaller timeframe after the sweep closes back inside the range.
Check the higher timeframe trend first. A sweep that aligns with the daily trend carries far more weight than one fighting it.
Stop placement: below the wick extreme of the sweep candle (for a bullish reversal), or above it for a bearish one — plus a small buffer. If price later closes beyond that wick extreme, treat it as a sign the sweep failed rather than tightening the stop further.
Target placement: the nearest opposing liquidity pool — the next significant swing high or low. Minimum 2:1 reward-to-risk; the strongest sweep trades often reach 3:1 to 5:1 because the stop sits tight against the sweep extreme while the target is comparatively far.
Marking Liquidity Before the Session
Work top-down. On the weekly chart, mark the swing highs and lows within roughly 5–10% of current price. On the daily chart, mark the more immediate swing highs and lows, equal highs/lows, and the prior day's high and low. On the 4-hour or 1-hour chart, mark the intraday pools most likely to be swept during the current session — recent swings, equal highs/lows, and the prior session's opening range.
Prioritize setups where an obvious equal high or low sits near an existing order block or FVG zone, in the correct half of the premium/discount range, aligned with the daily trend. That combination is worth watching closely; everything else is lower priority.
Where Liquidity Sweeps Generally Happen
A liquidity sweep isn't an isolated event — it's the mechanism behind several other SMC concepts.
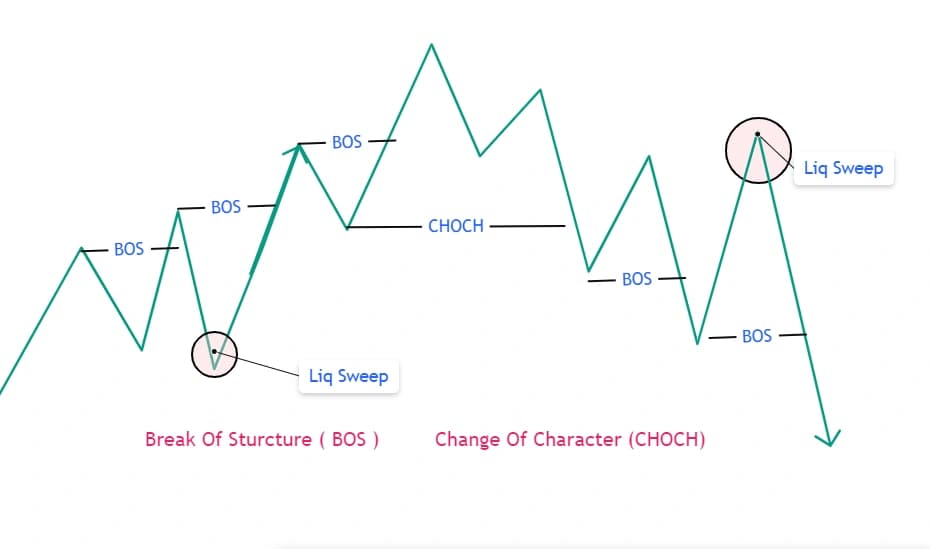
Market structure: most genuine BOS events are preceded by a sweep of the swing low or high the break originates from. Understanding this means a brief violation of a swing point right before a BOS isn't a false breakdown — it's the fuel for the break that follows. Full breakdown of BOS and CHoCH: SMC Market Structure.
The AMD cycle: the manipulation phase of any session is largely built around sweeping the prior range's liquidity before the real distribution move. Full explanation: Accumulation, Manipulation, Distribution.
Inducement: often, the very first sweep of a session is a smaller trap designed to catch early SMC traders before the larger, real sweep happens later. Full explanation: Inducement (IDM).
Common Mistakes while Identify Liquidity
Entering during the sweep instead of after. Seeing price break a level and reacting immediately is how most sweep trades go wrong — wait for the close and the reversal confirmation.
Treating every wick as a sweep. A wick on thin, below-average volume is more likely noise than a genuine institutional sweep.
Ignoring the higher timeframe trend. A bullish sweep setup inside a strongly bearish daily trend has a much lower success rate than the same setup aligned with it.
Placing the stop exactly at the swept level instead of beyond the wick. A second, smaller sweep can trigger a stop placed right at the level, right before price reverses as expected.
Trading every level regardless of significance. Only levels that are obviously visible — equal highs/lows, major swings, prior day/week highs and lows, round numbers — are worth marking.
Confusing genuine acceptance with a sweep. After a level breaks, watch several candles before assuming it's a sweep — if price keeps closing beyond the level, it's likely a real breakout, not a trap.
FAQ
What's the difference between buy-side and sell-side liquidity? Buy-side liquidity sits above the market, at swing highs and equal highs — made up of short sellers' stops and breakout buyers' orders. Sell-side liquidity sits below the market, at swing lows and equal lows — made up of long traders' stops and breakdown sellers' orders. Institutions sweep BSL to fill large sell positions and SSL to fill large buy positions.
How do I tell a liquidity sweep apart from a real breakout? Wait for the candle close rather than reacting to a wick, and watch how price behaves over the next few candles — a sweep closes back inside the range quickly with fading volume, while a breakout keeps closing beyond the level with volume holding up.
Where should the stop loss go after a sweep trade? Beyond the wick extreme of the sweep candle, not at the swept level itself — a small buffer beyond that extreme protects against a second, smaller sweep triggering the stop prematurely.
Are equal highs and equal lows always swept? Not always, but they're the highest-probability targets precisely because so many traders place stops at the same obvious level. The more visible and widely-discussed the level, the more likely it eventually gets tested.
What's the best time to trade liquidity sweeps? Sessions with the highest institutional volume tend to produce the cleanest, most reliable sweeps — thinner, lower-volume periods produce more false signals.
Conclusion
Once you understand liquidity sweeps, stop-outs stop feeling personal and start looking like predictable, mechanical events. The three principles worth carrying forward: never enter during the sweep itself, don't treat every wick as a sweep, and map your liquidity levels before the session rather than trying to identify them in real time.
Have a question about this article?
Comment on our latest Instagram post or send us a DM — we reply to every one.
@dhanith_officialWas this article helpful?
Click to rate
Founder, Dhanith Trading
7+ years trading Nifty, Bank Nifty, NSE stocks, and commodities — specializing in Smart Money Concepts (SMC) and ICT price action. Founder of Dhanith — a trading journal, intraday screener, and risk tools platform built for retail traders.
Dhanith Newsletter
Enjoyed this article? Get more like it.
New trading guides, candlestick patterns, SMC strategies, and tool updates — straight to your inbox. Free, for Indian traders.
No spam. Unsubscribe anytime.
Continue Reading