On this page
- Quick Reference: All 6 Examples at a Glance
- Example 1 — Bullish Order Block Trading on BTC/USD (4H)
- Example 2 — Bullish and Bearish Order Block on BTC/USD (4H)
- Example 3 — Order Block Entry, Stop-Loss, and Target
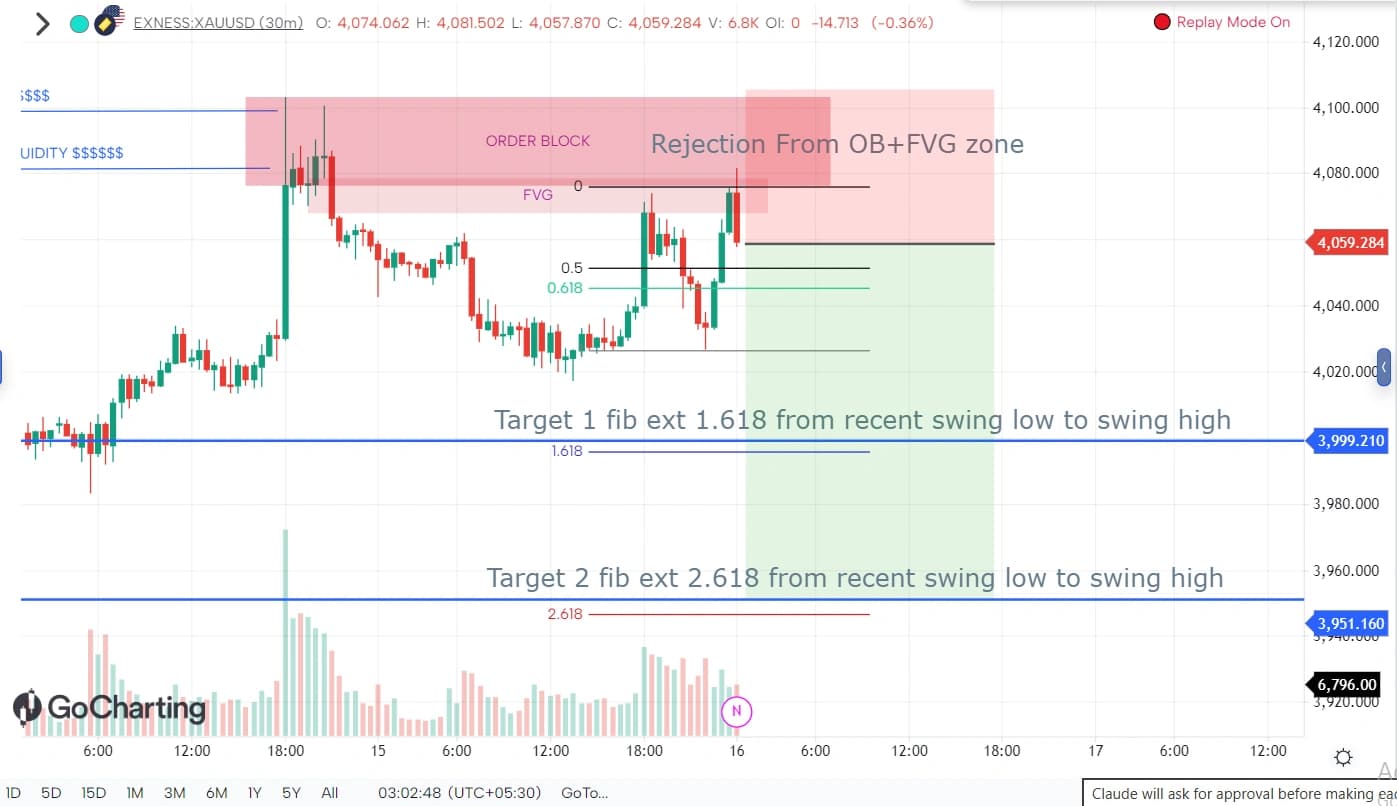
- Example 4 — Bearish Order Block on Gold (XAUUSD, 30-min)
- Example 5 — A Live Executed Order Block Trade on JPY/USD (4H)
- Example 6 — Order Block with FVG Stop-Loss Gets Hit
- Key Takeaways Across All Six Examples
- FAQ
Order Block Trading Examples: 6 Real Chart Trading Jan to Jul 2026 (Crypto, Gold, Forex)

See 6 real order block trades step by step — entry, stop-loss, and target on BTC, Gold & JPY/USD charts. Includes a real stop-loss hit.
Reading rules is one thing. Watching them actually play out on a chart — including the one that didn't work — is another. This post walks through six real order block trades, taken between January and July 2026: four on Bitcoin, one on Gold, and one on JPY/USD, covering bullish and bearish setups, a full liquidity round-trip, a live executed position with real P&L, and an honest stop-loss hit.
Quick Reference: All 6 Examples at a Glance
| # | Instrument | Timeframe | Traded | Direction | Entry Method | Stop-Loss | Target Method | Result |
|---|---|---|---|---|---|---|---|---|
| 1 | BTC/USD | 4H → 30-min drilldown | 3–21 Jan 2026 | Bullish | Lower-TF FVG retest after HTF OB retest | Below lower-TF OB | Fib ext 1.618 from swing high/low | Both targets hit |
| 2 | BTC/USD | 4H | 6 Jun 2026 | Bullish → Bearish round-trip | OB + FVG retest, then fresh bearish OB at liquidity | Below respective OB | Fib ext grid (23.6%–361.8%) | Full liquidity sweep completed |
| 3 | Reference | 4H | 1 Jul 2026 | Bullish (template) | 50% CE of FVG inside OB | Below full OB | 2x swing low-to-high measured move | Reference/template chart |
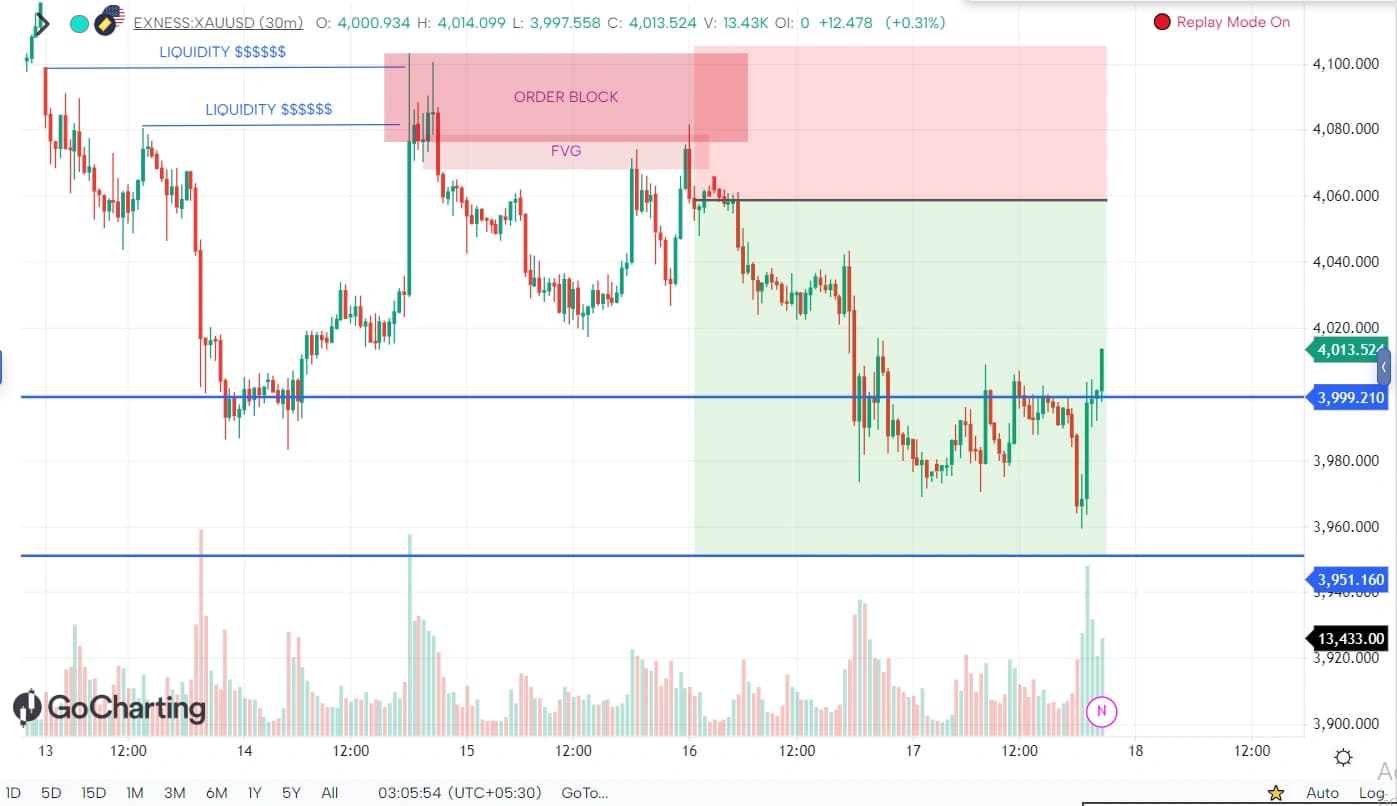
| 4 | XAUUSD (Gold) | 30-min | 11–17 Jul 2026 | Bearish | Second rejection from OB + FVG | Above OB | Fib ext 1.618 / 2.618 | Target 1 hit, booked early |
| 5 | JPY/USD | 4H | 9–13 Jul 2026 | Bullish | Entry at OB | Below OB (0.276%) | Fib ext 1.618 of swing | Target hit, 2.47 R:R |
| 6 | BTC/USD | 30-min | 30–31 Jan 2026 | Bearish | Rejection from FVG | Above OB | Fib ext 1.618 / 2.618 / 4.618 | Stop-loss hit |
This table alone is worth bookmarking — it's the fastest way to compare entry, stop, and target logic across every setup style covered below.
Example 1 — Bullish Order Block Trading on BTC/USD (4H)
Traded: 3–21 Jan 2026
This is the complete walkthrough: an order block forms, gets confirmed, retested on poor volume, swept, and finally triggers an entry on the lower timeframe — with both fib-extension targets eventually hit.
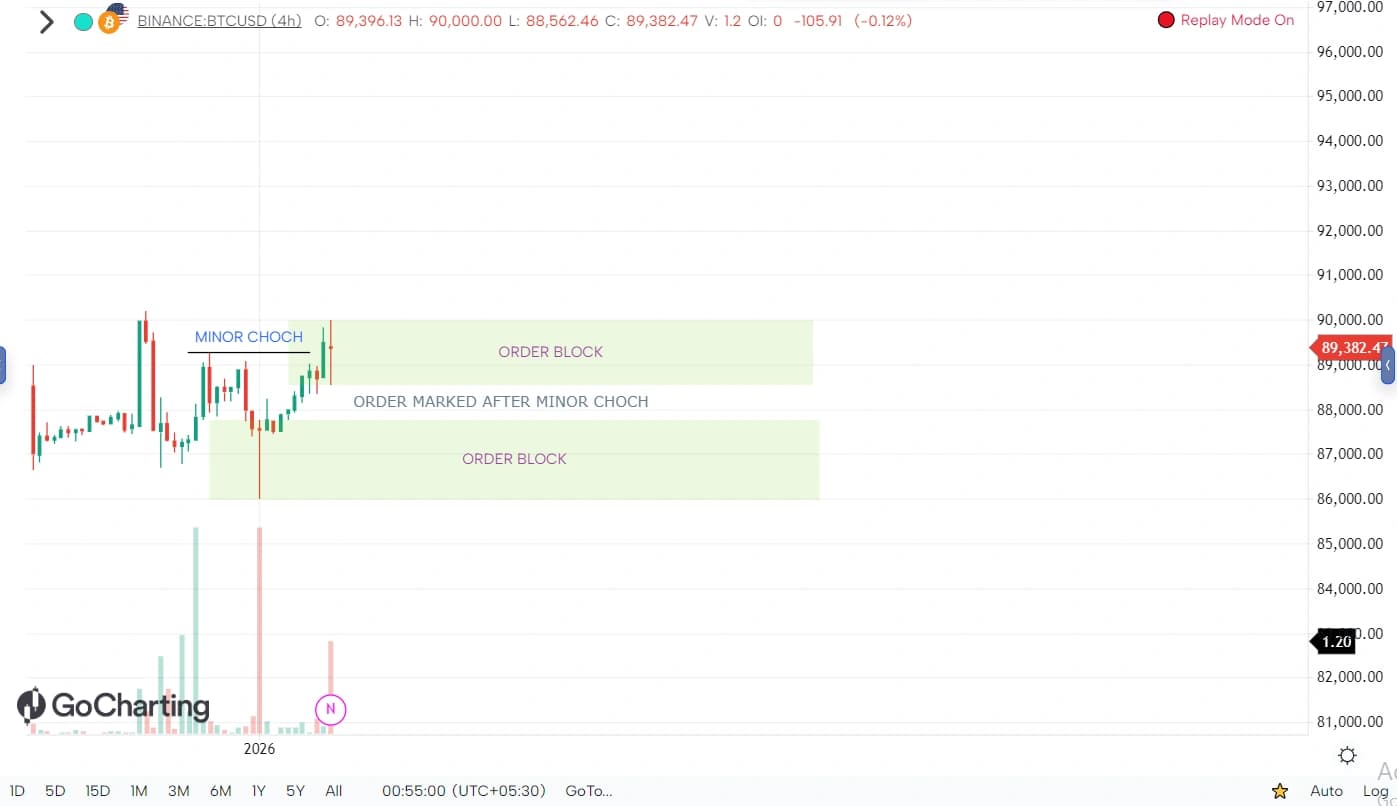
Step 1 — Order block marked after a minor CHoCH. A Change of Character signals the short-term trend may be turning, and the last opposing candle before the break is boxed as the OB.
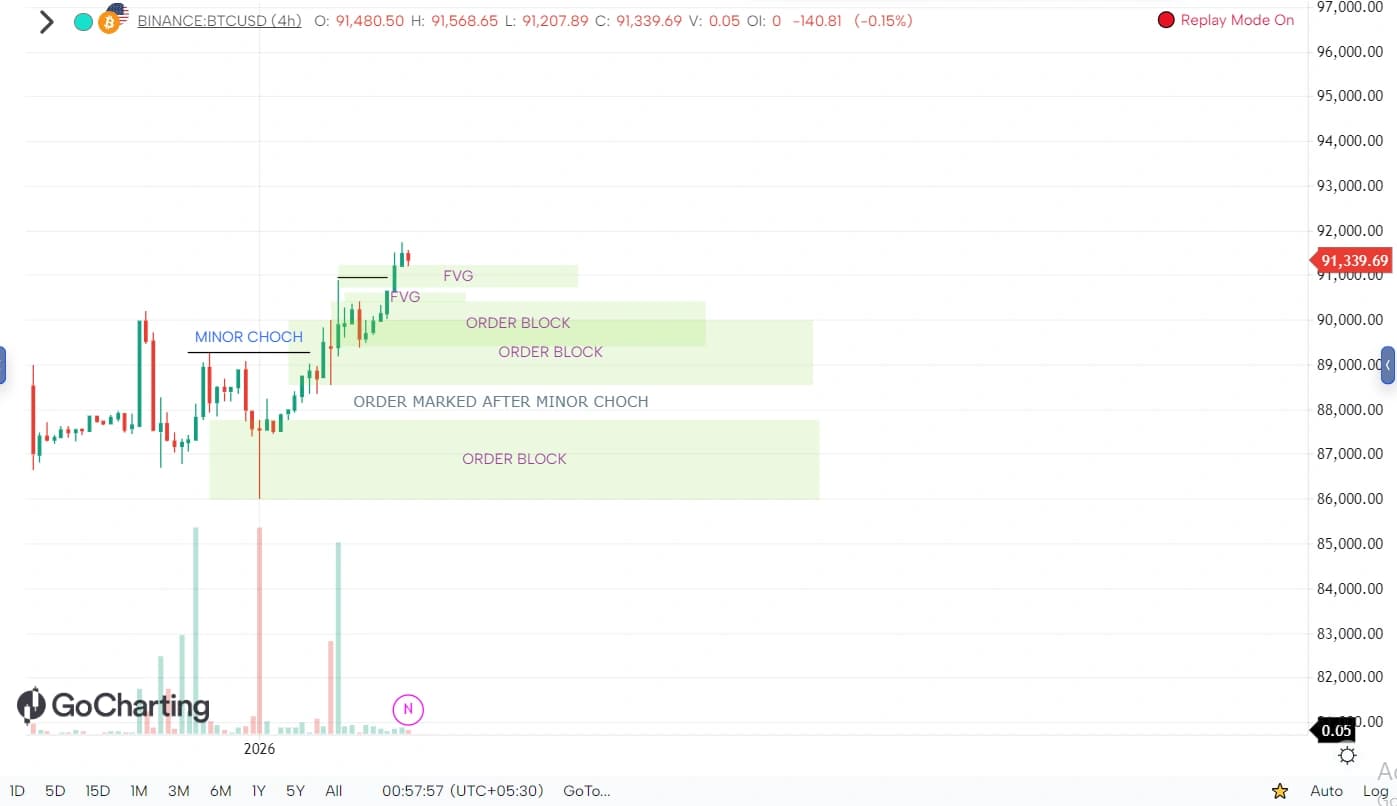
Step 2 — FVG confirms the order block. Two fair value gaps stack up as price accelerates away from the OB — real imbalance, not just a random swing.
Step 3 — Expected reversal zone mapped with a fib extension. A 4.618 extension from the OB candle projects where the move is statistically likely to react.
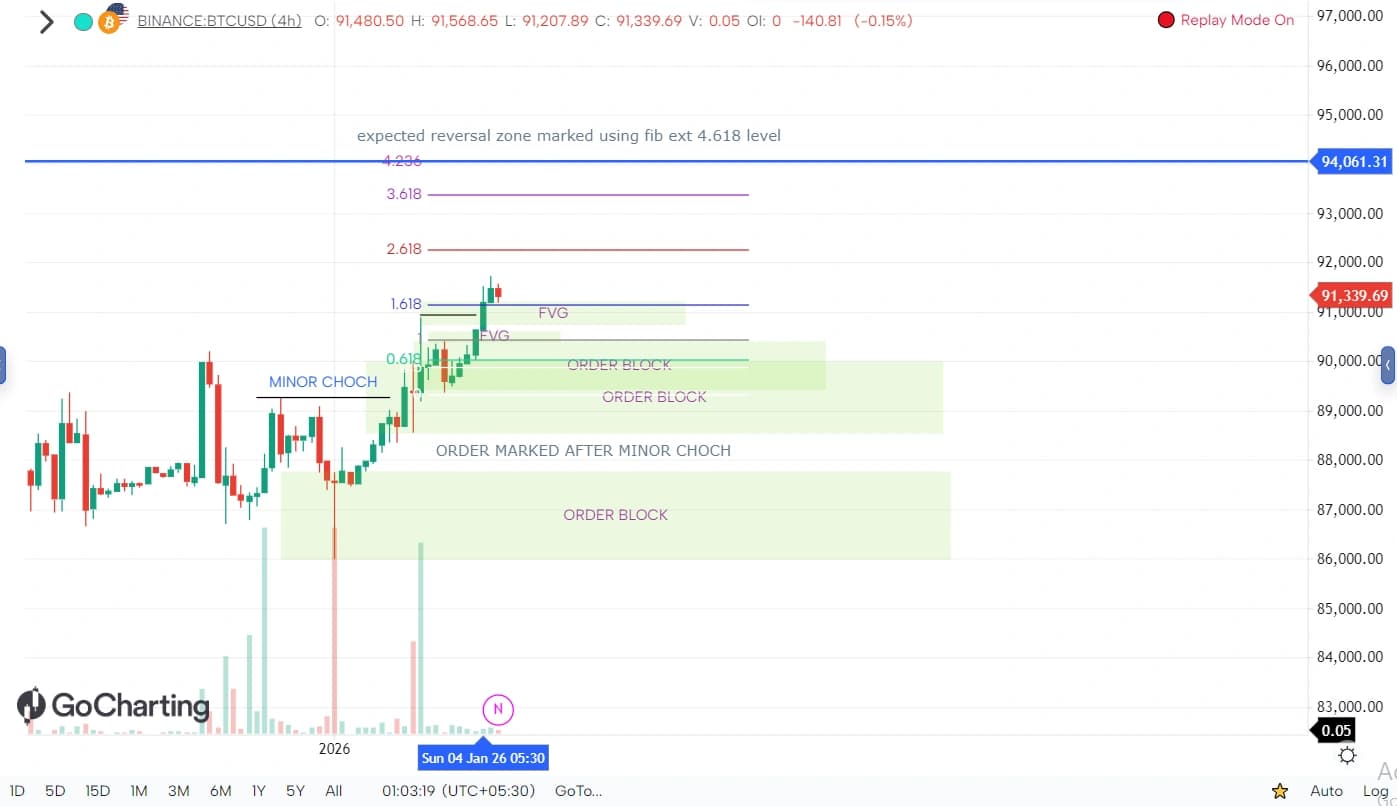
Step 4 — Price reaches the zone and rejects. The rally runs straight into the 4.618 zone, gets rejected, and starts pulling back toward the OB.
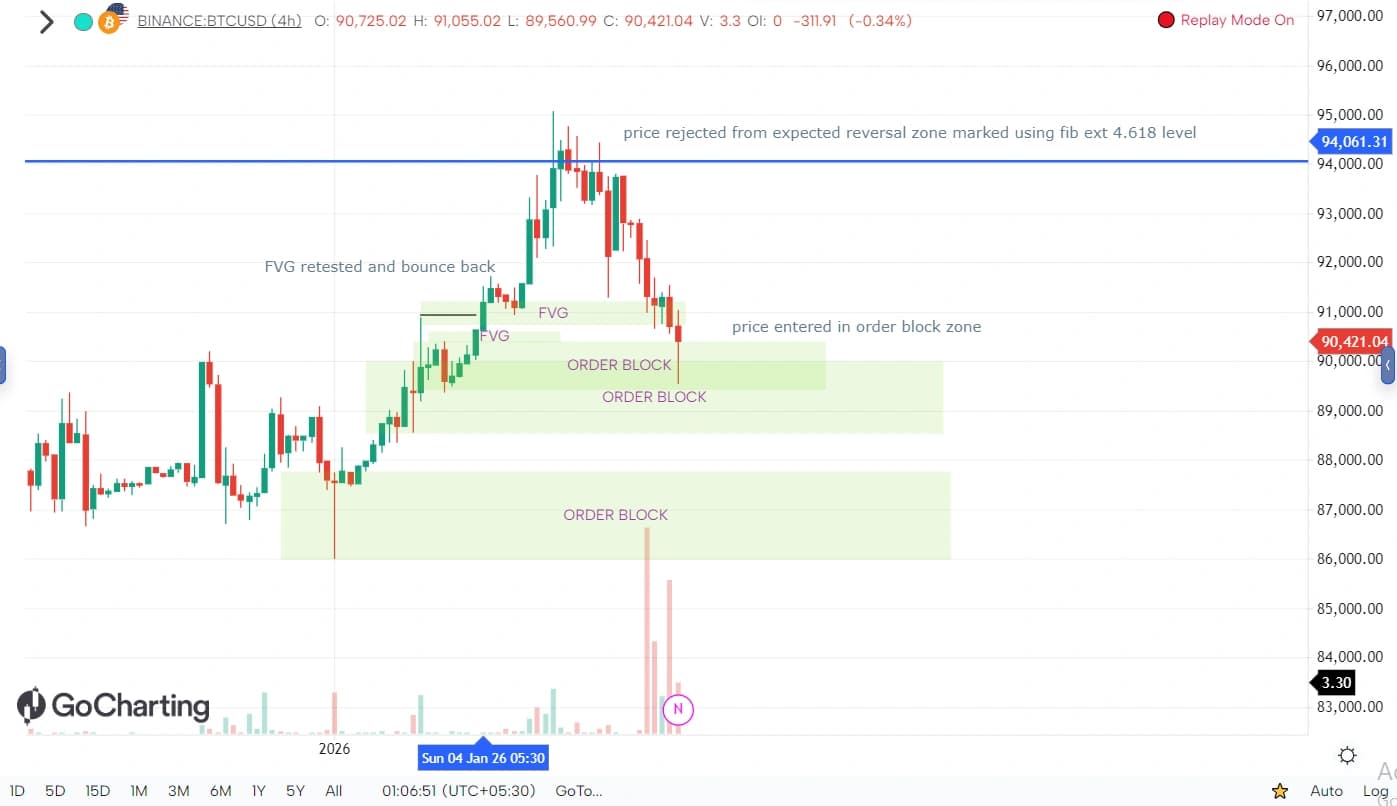
Step 5 — Retest on poor volume. Price returns to the OB, but the volume on the retest is weak — a caution flag, not a green light.
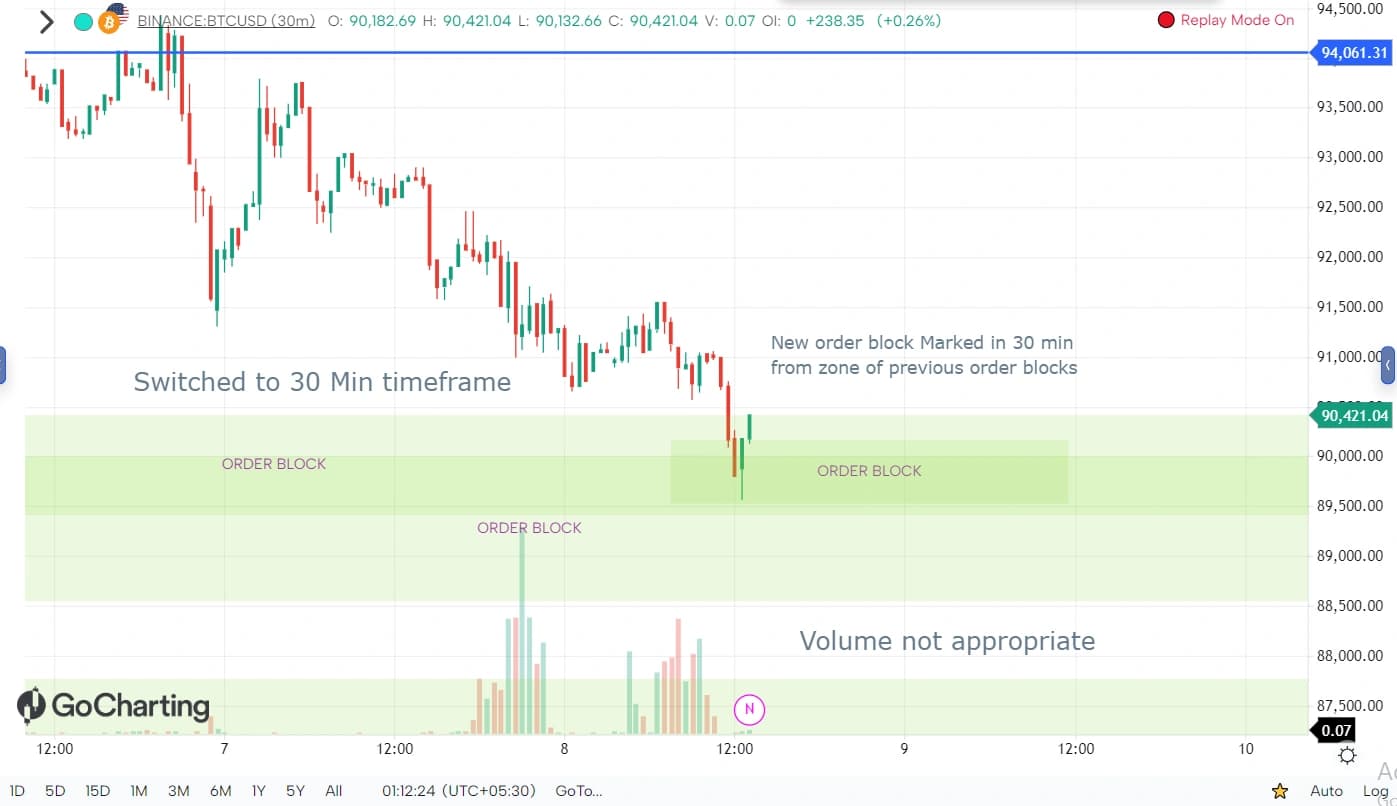
Step 6 — Liquidity sweep and structure shift, still no volume. Price sweeps the recent low and shifts structure back up, but conviction is still unconvincing on the tape.
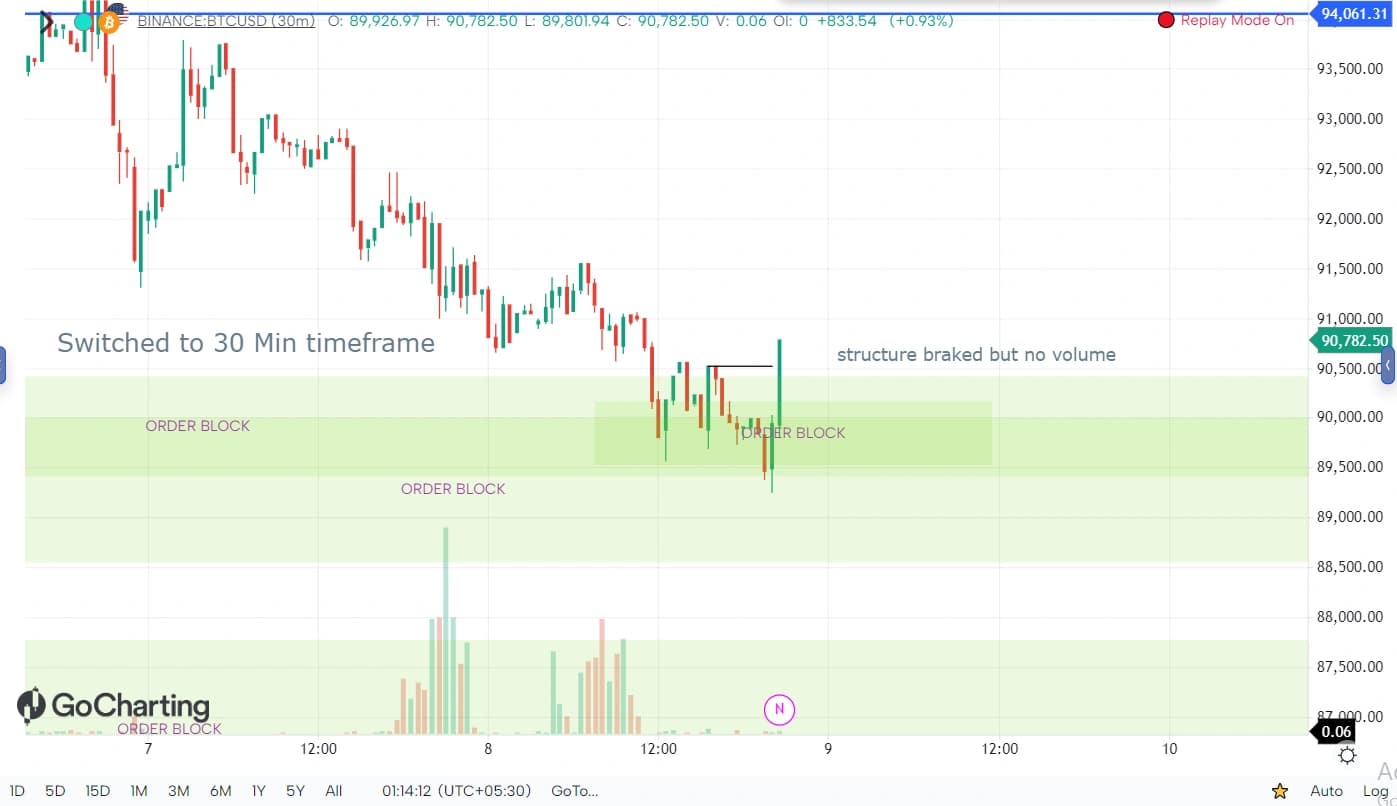
Step 7 — Entry at FVG retest (lower timeframe). Dropping to the 30-min chart, a fresh OB and FVG form inside the 4H zone. The retest of that lower-timeframe FVG is the actual entry trigger.
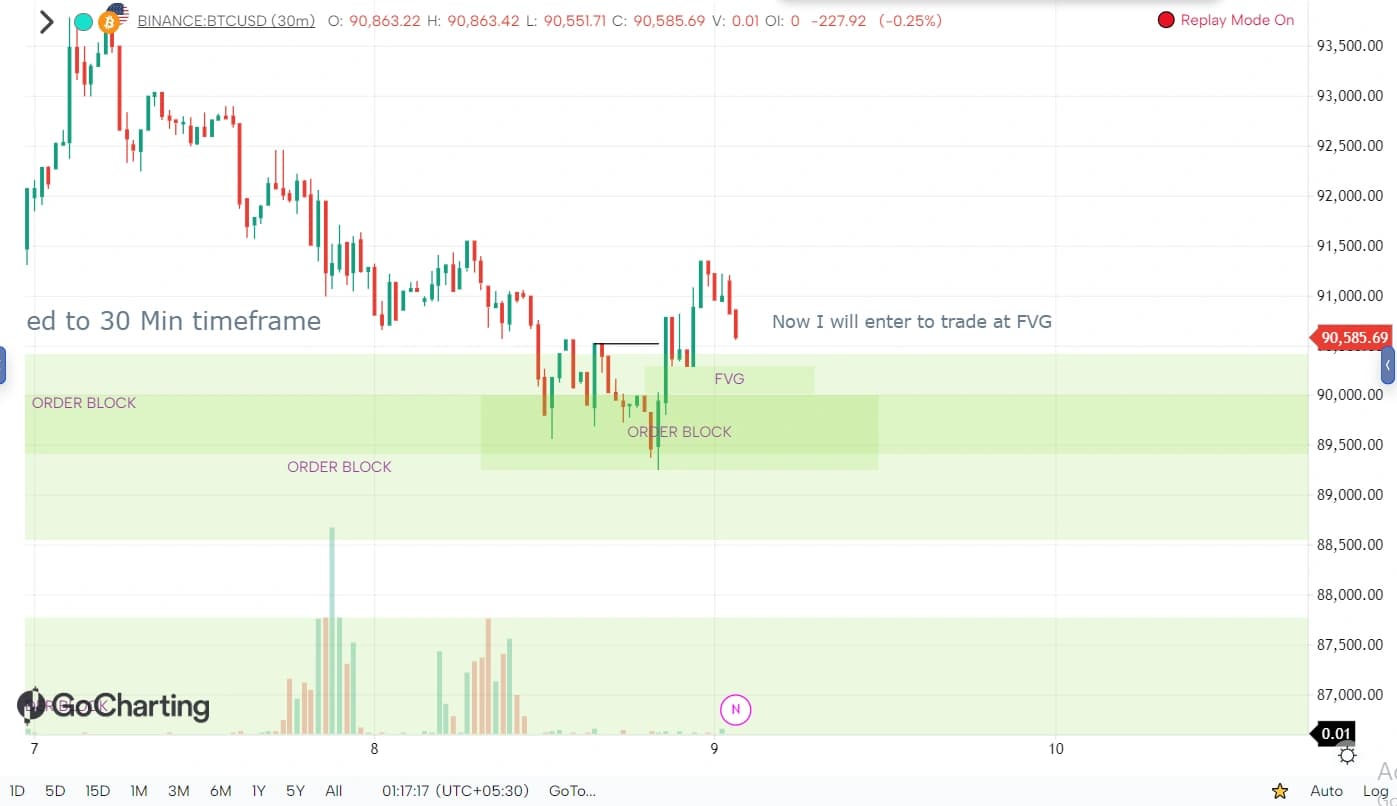
Step 8 — Entry executed, stop-loss below the new order block. The stop sits below the lower-timeframe OB that triggered the trade, not the wider 4H zone — keeping risk tight and proportionate.
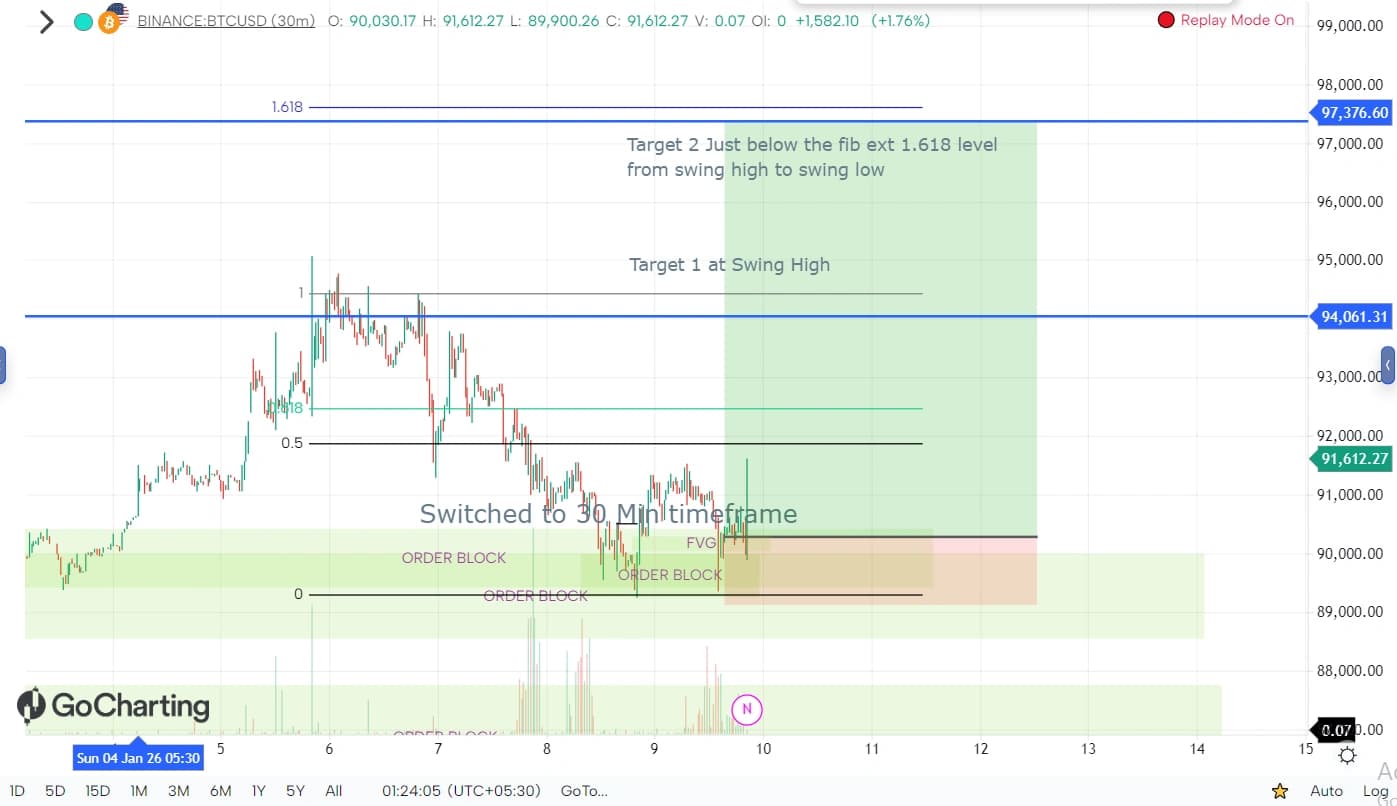
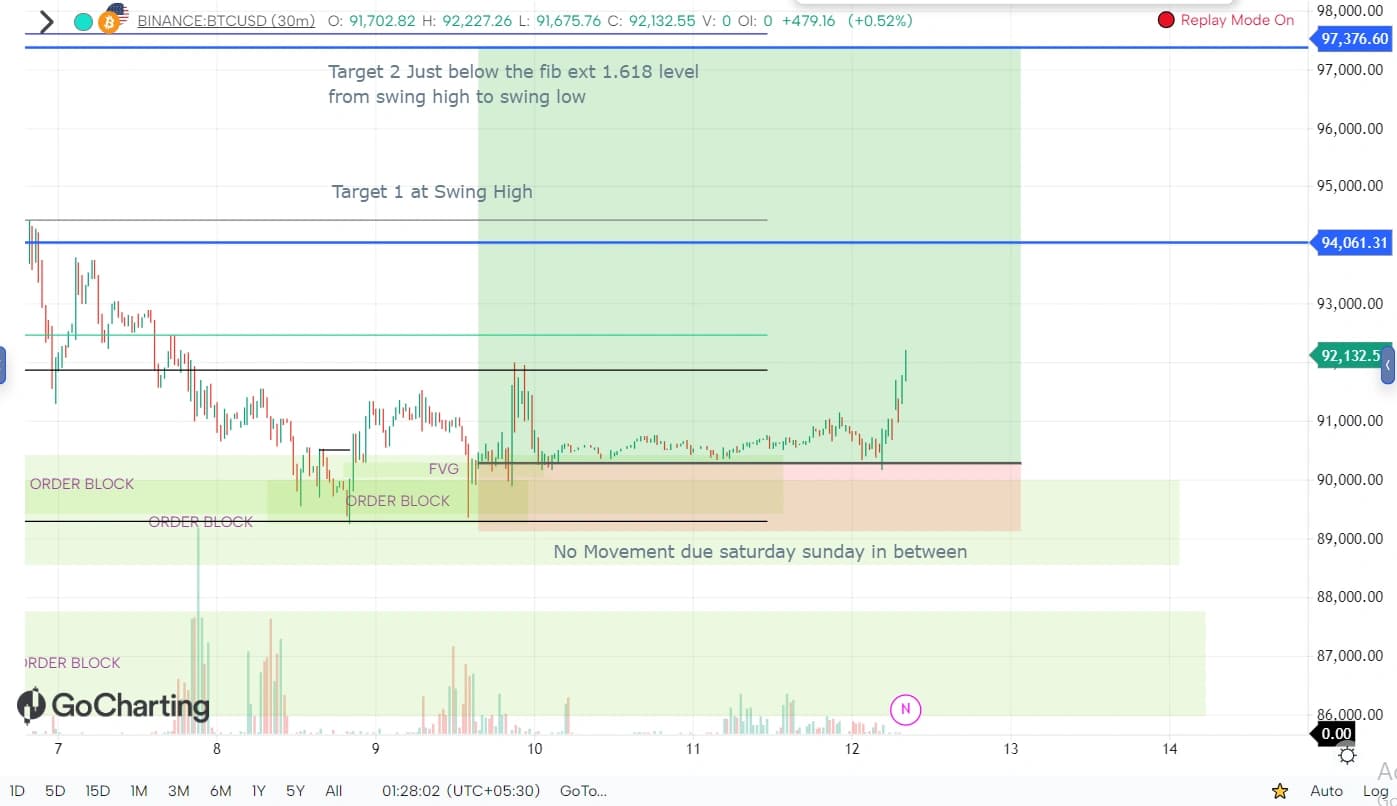
Step 9 — Wait: no movement over the weekend. Even in crypto, momentum can stall through low-liquidity weekend hours.
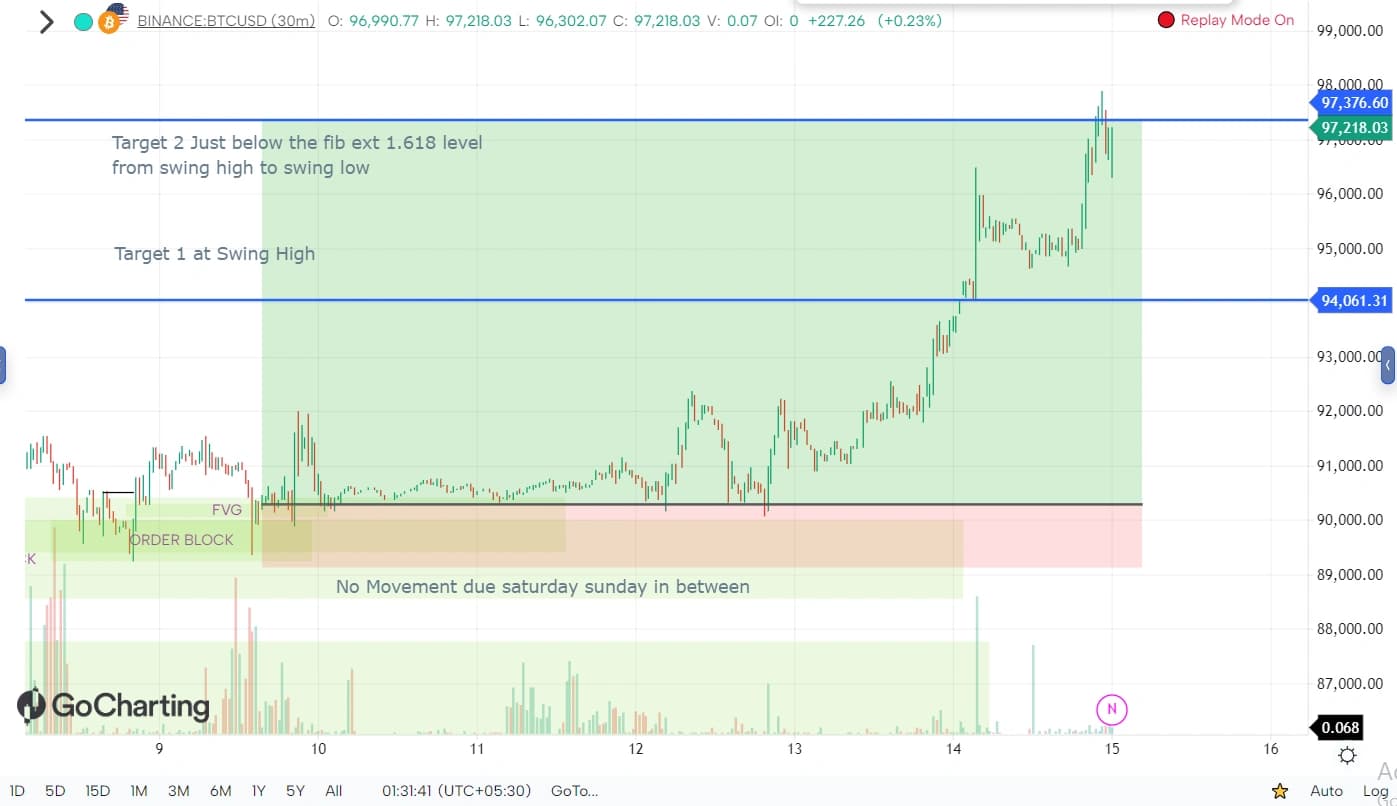
Step 10 — Target hit at the 1.618 fib extension. Price clears Target 1 (the prior swing high) and runs on to Target 2, just below the 1.618 extension of the swing high to swing low.
Example 2 — Bullish and Bearish Order Block on BTC/USD (4H)
Traded: 6 Jun 2026
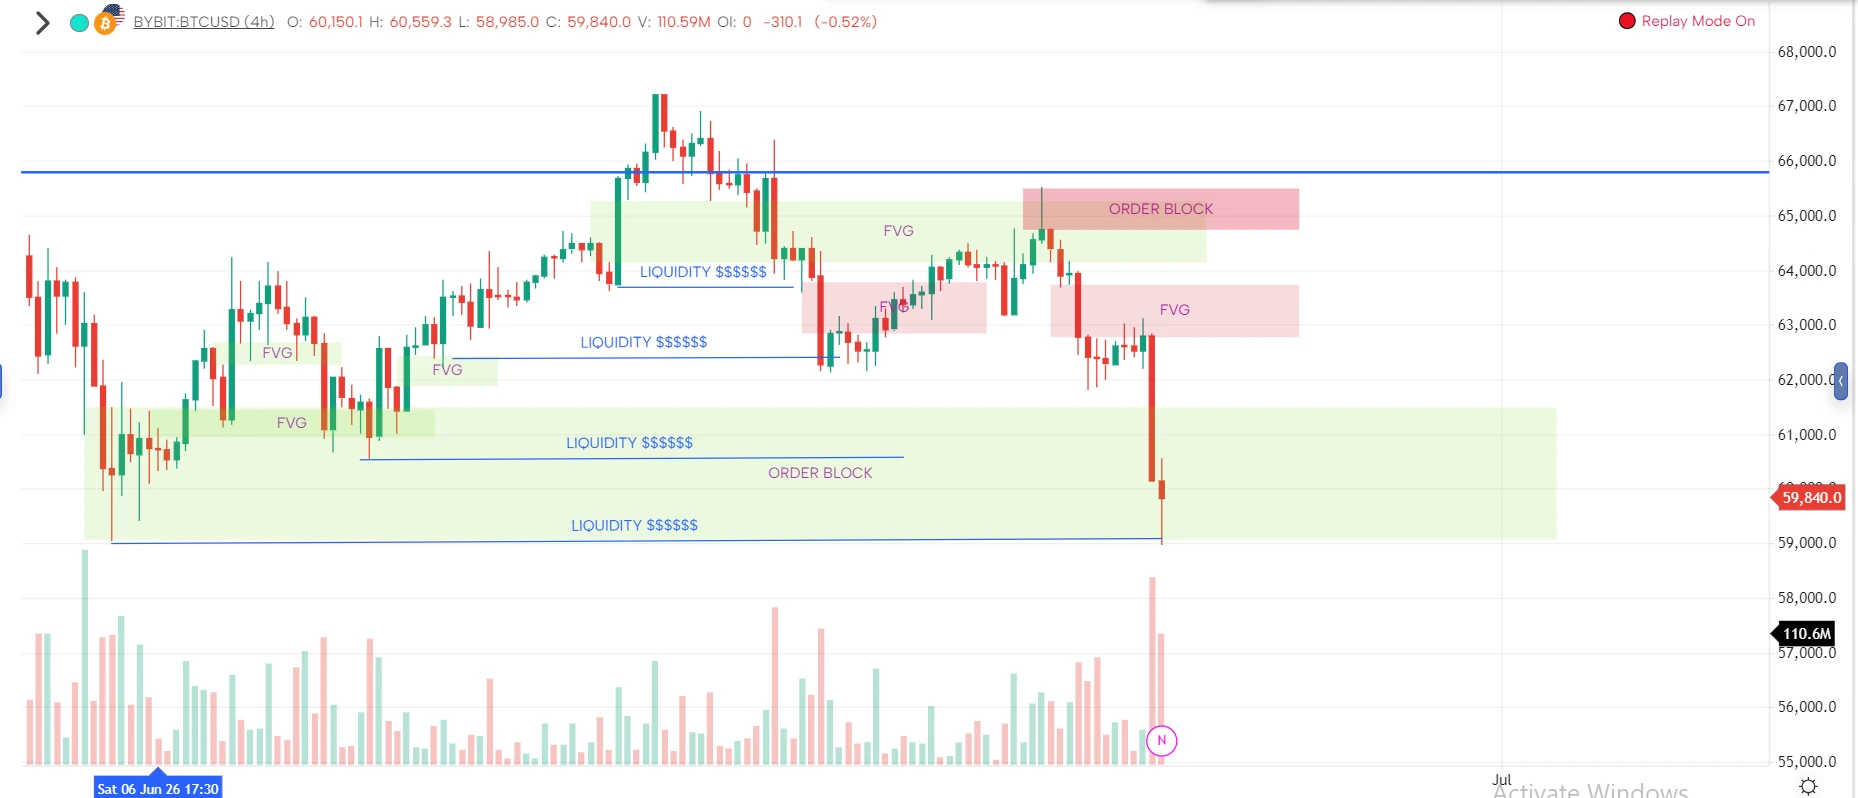
This example shows the bigger picture: an order block at a low fuels a rally into liquidity resting above, a fresh bearish order block forms at the top, and price sweeps every liquidity pool back down through the original OB.
Step 1 — Order block forms at the low. After a sharp decline, price finds a floor at the previous low; the last down-close candles are boxed as the OB.
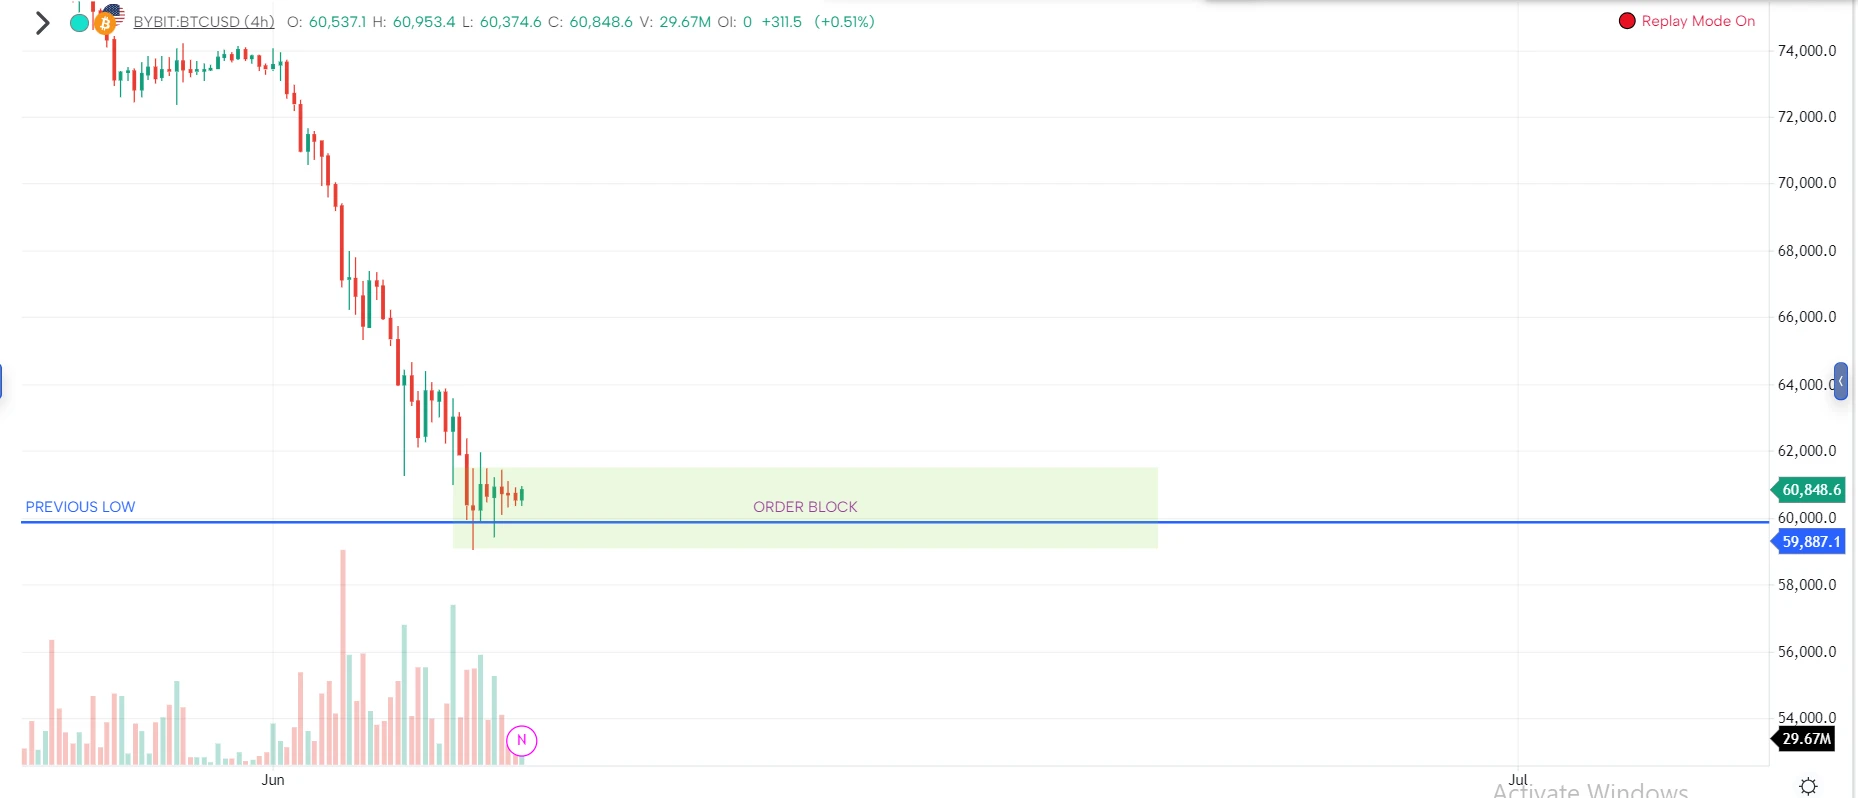
Step 2 — FVG confirms the order block. A strong green candle leaves a fair value gap behind on departure from the OB.
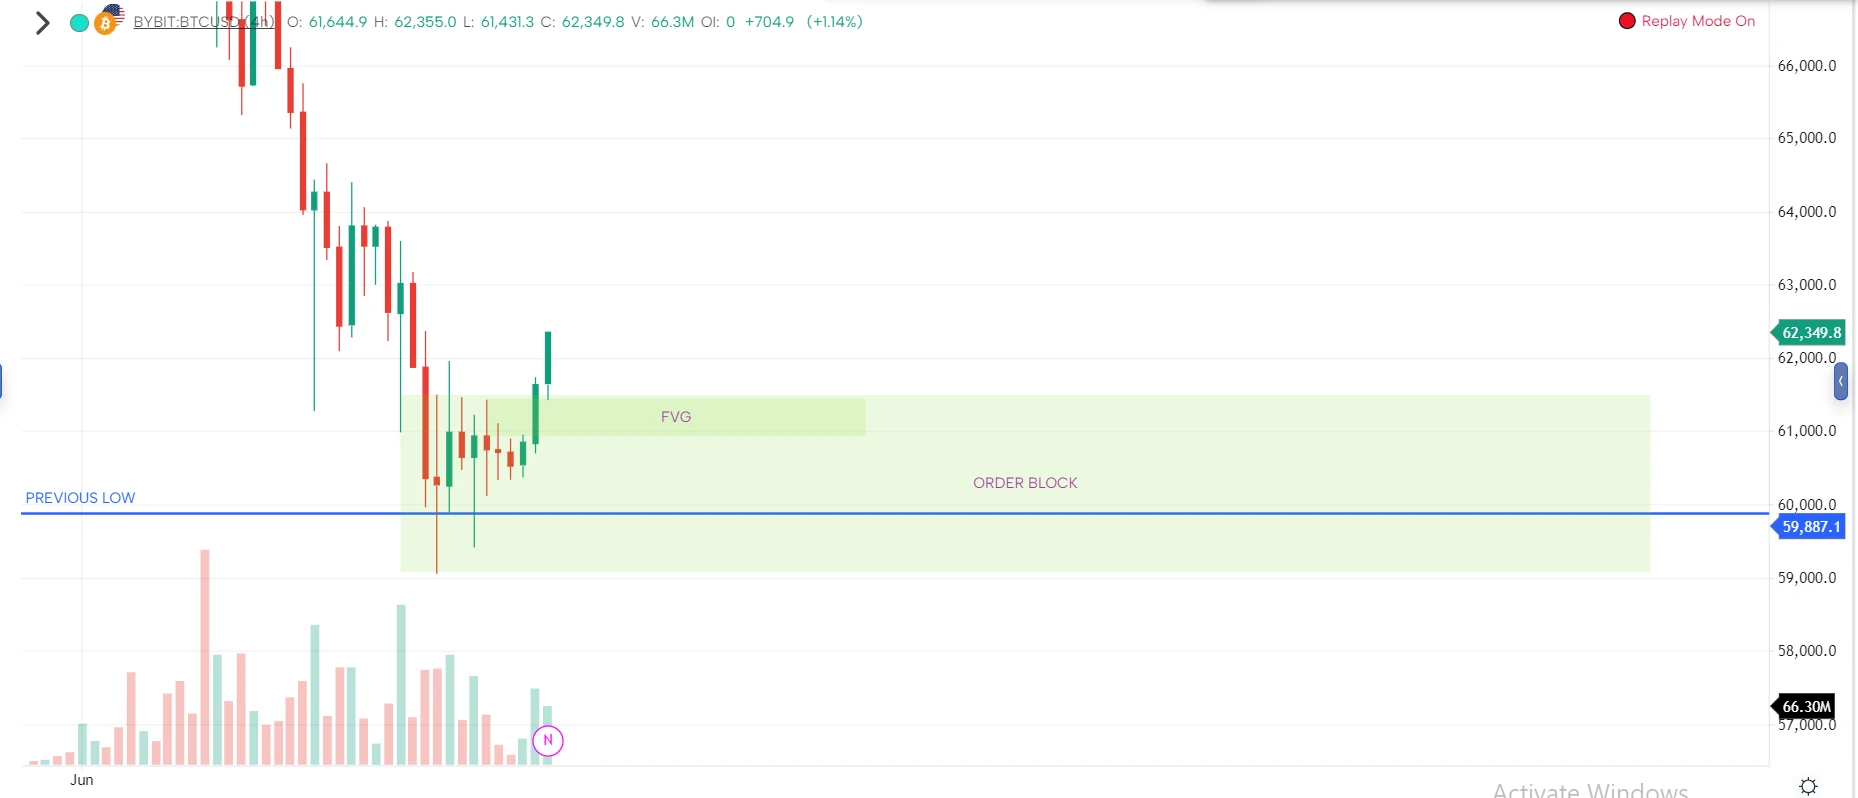
Step 3 — Fib extension zones mapped from the OB. A full grid — 23.6% through 361.8% — is drawn off the OB's low-to-high leg, mapping multiple potential reaction zones in advance.
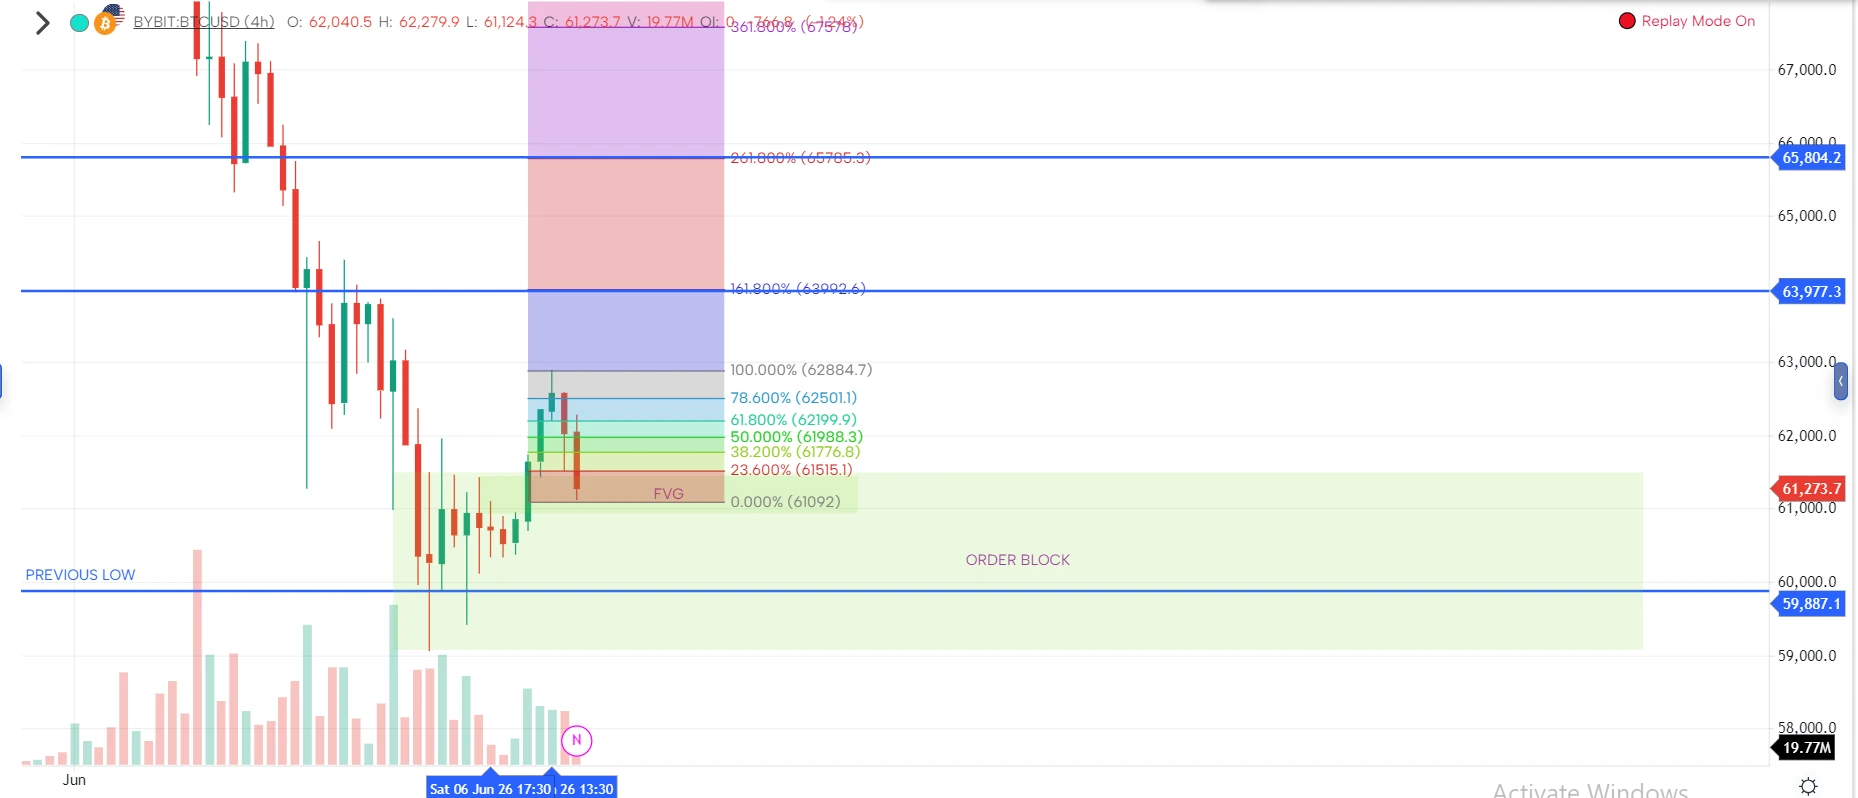
Step 4 — Rally, then pullback into the OB. Price stalls near 63,977 and a sharp red candle drives it back into the order block and its FVG — the retest.
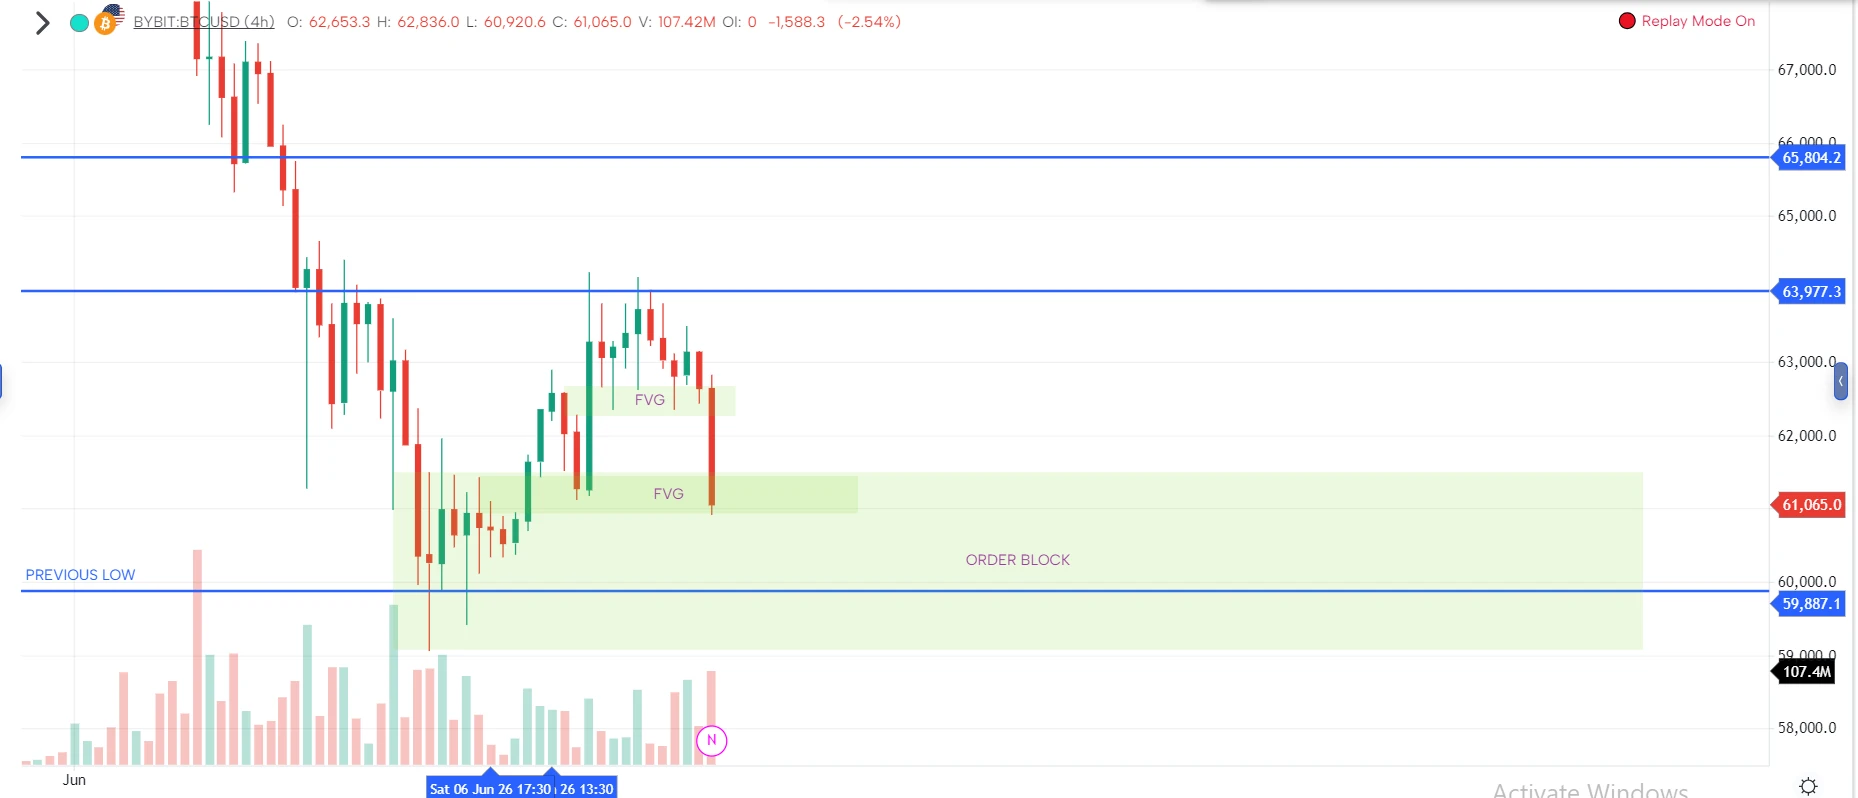
Step 5 — Consolidation with two FVGs inside the range. Rather than reversing hard, price chops sideways, leaving two stacked FVGs — repeated bursts of one-sided flow rather than one clean move.
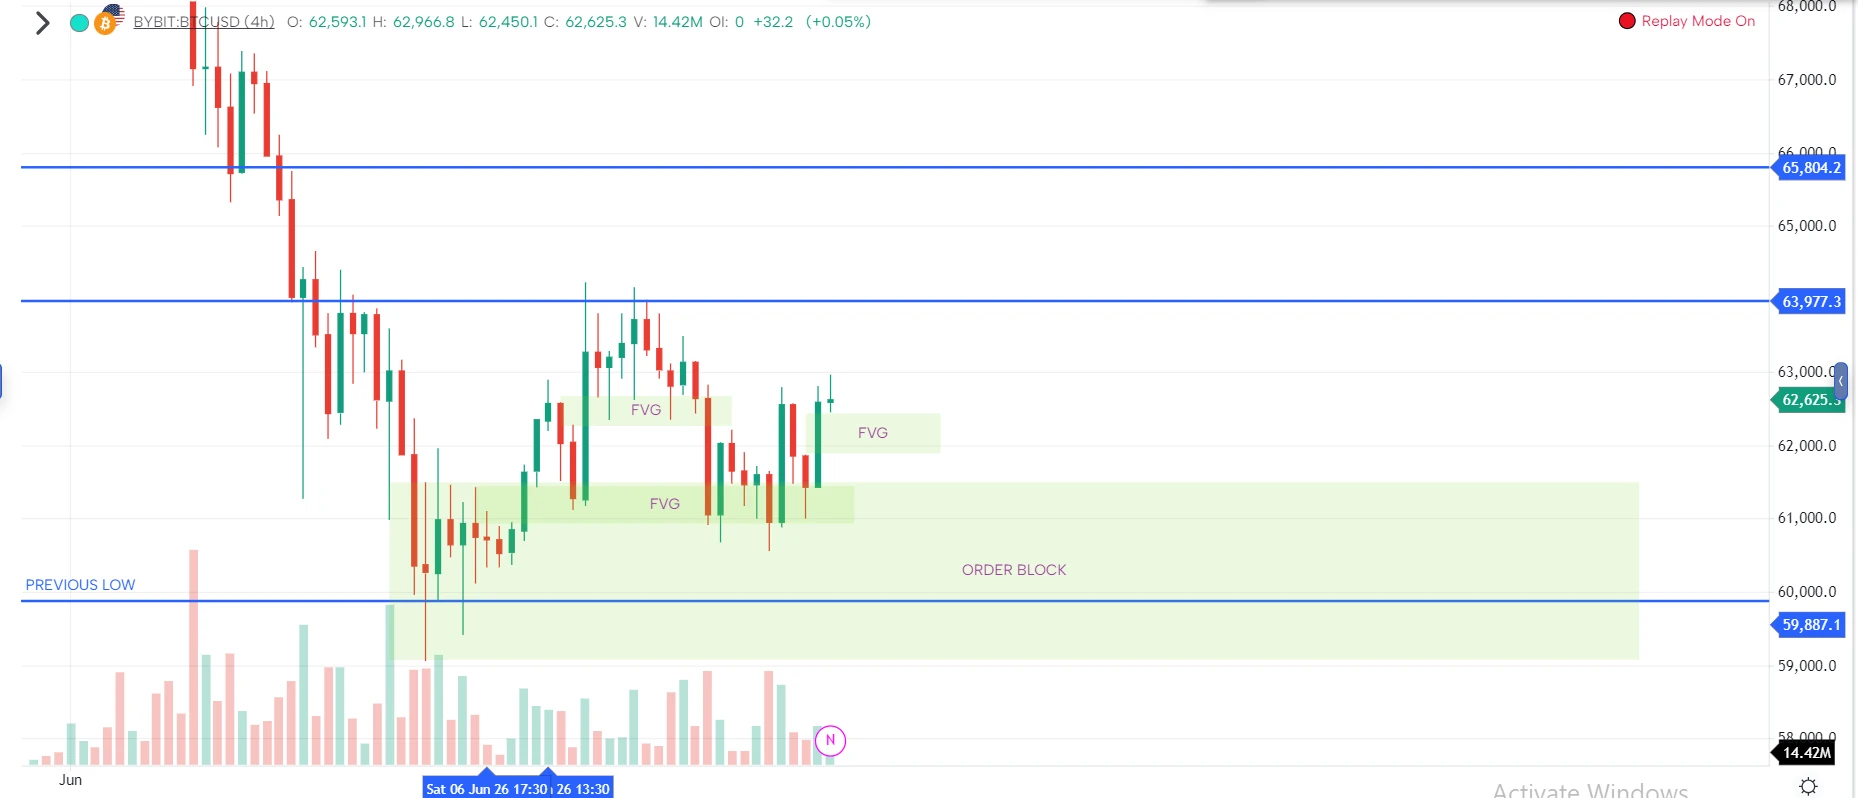
Step 6 — Breakout above prior resistance. A decisive candle clears the level that had capped price twice — confirming the OB and retest actually worked.
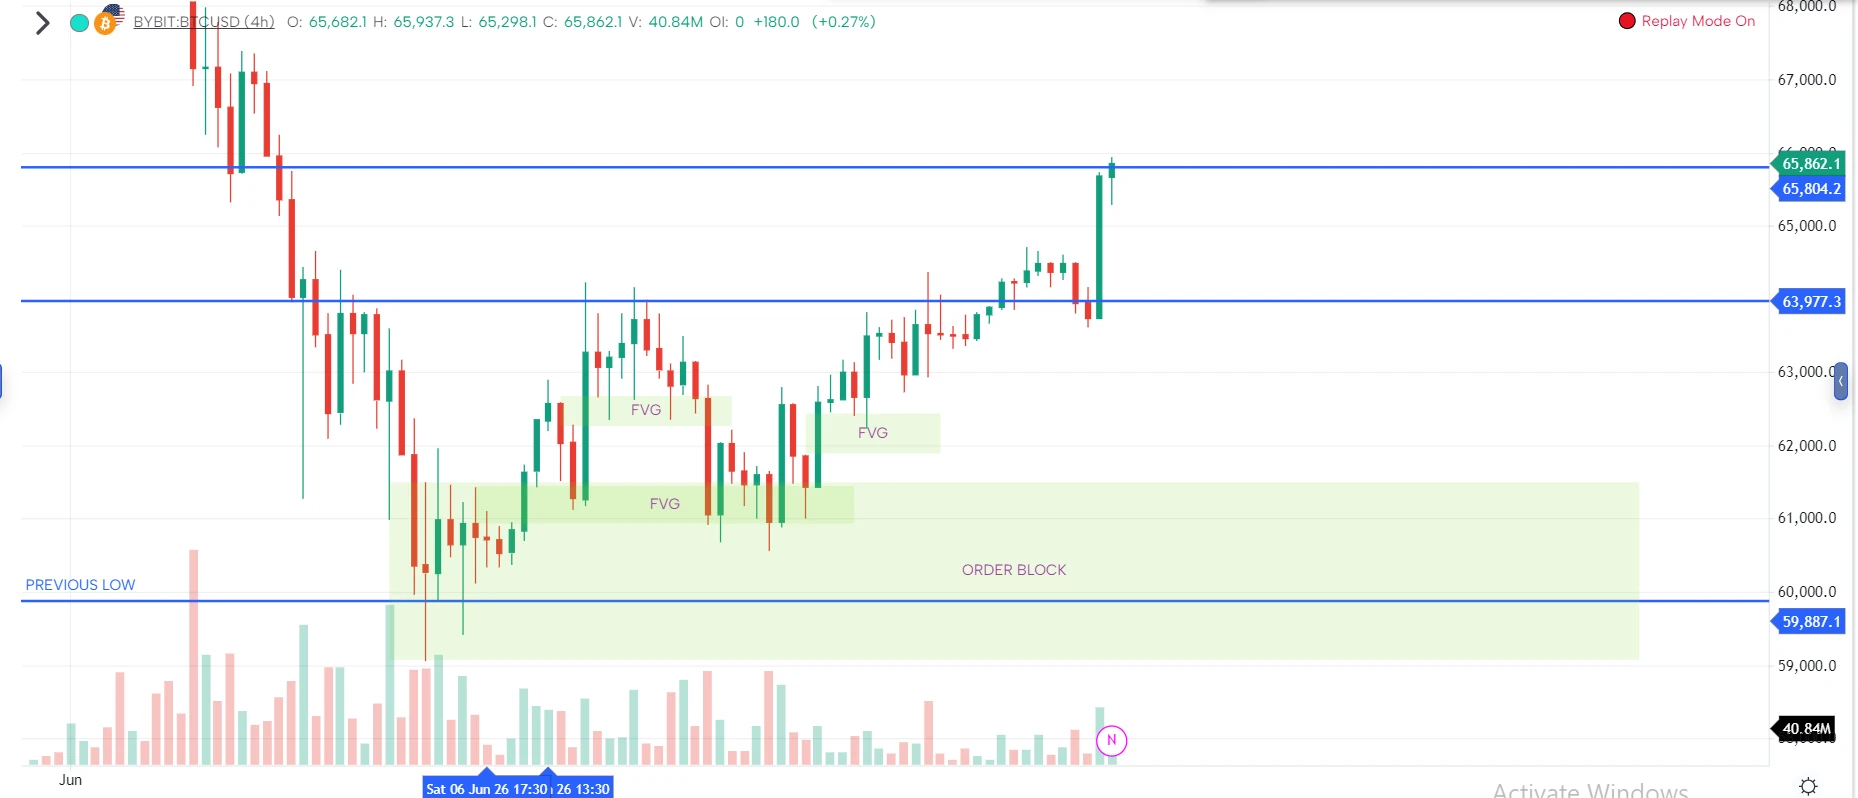
Step 7 — New high, new FVG, liquidity pool forms above. Price extends to a new high, pulls into a fresh FVG, and a liquidity pool builds just below the high — the magnet for the next leg.
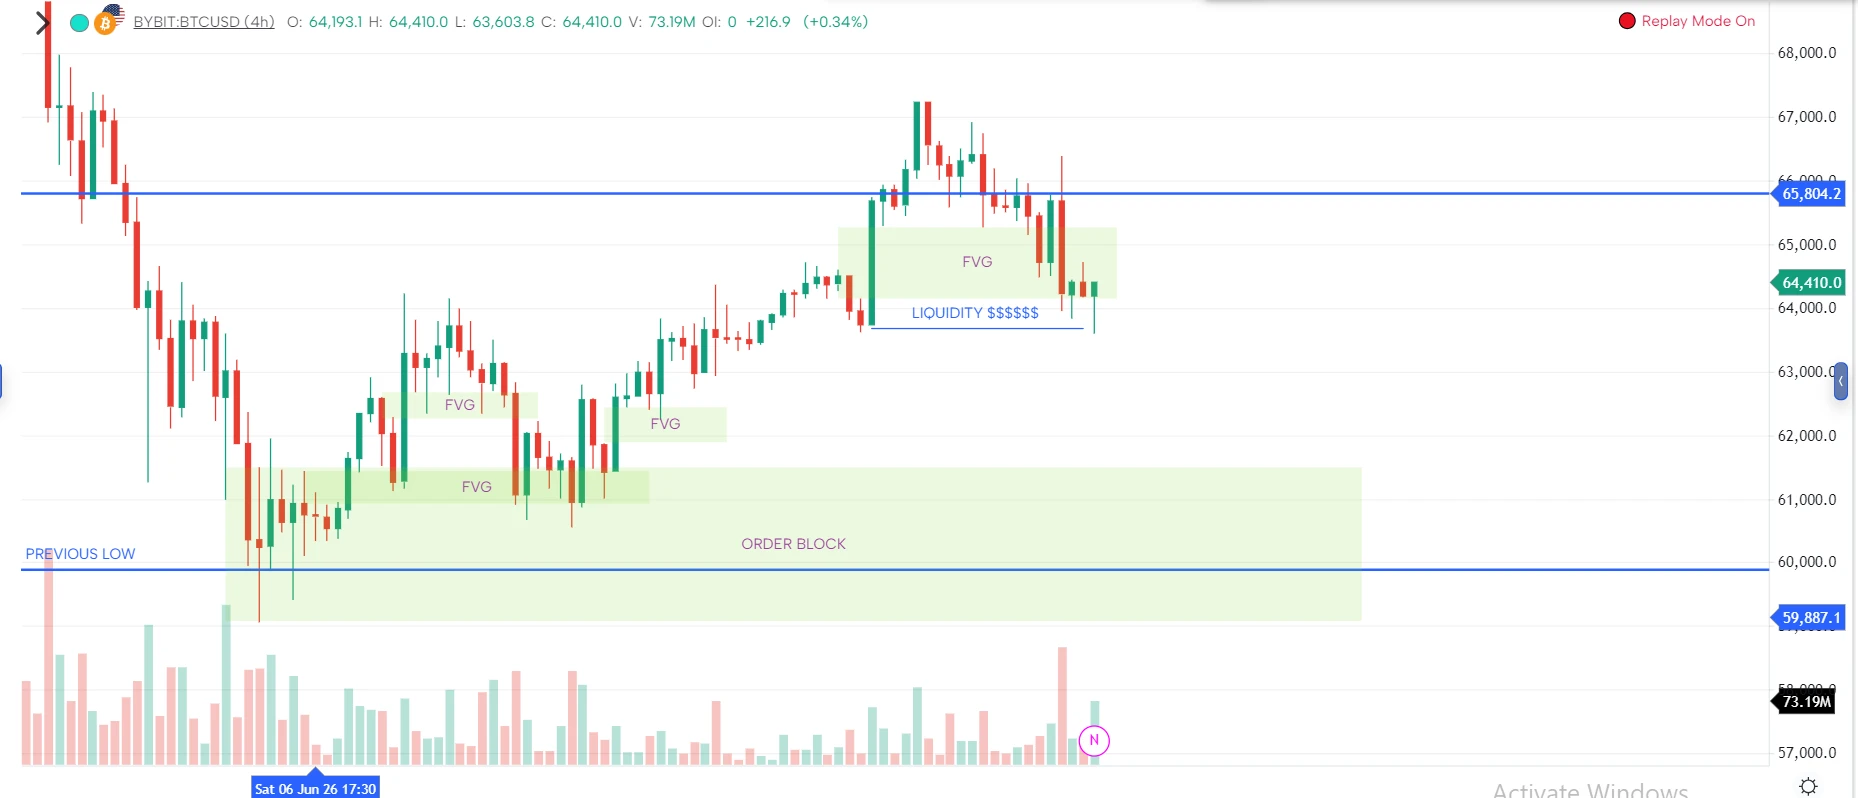
Step 8 — Bearish order block marked at the top, liquidity mapped below. A fresh bearish OB forms at the top with its own FVG, while a ladder of liquidity pools sits stacked beneath — including under the original OB.
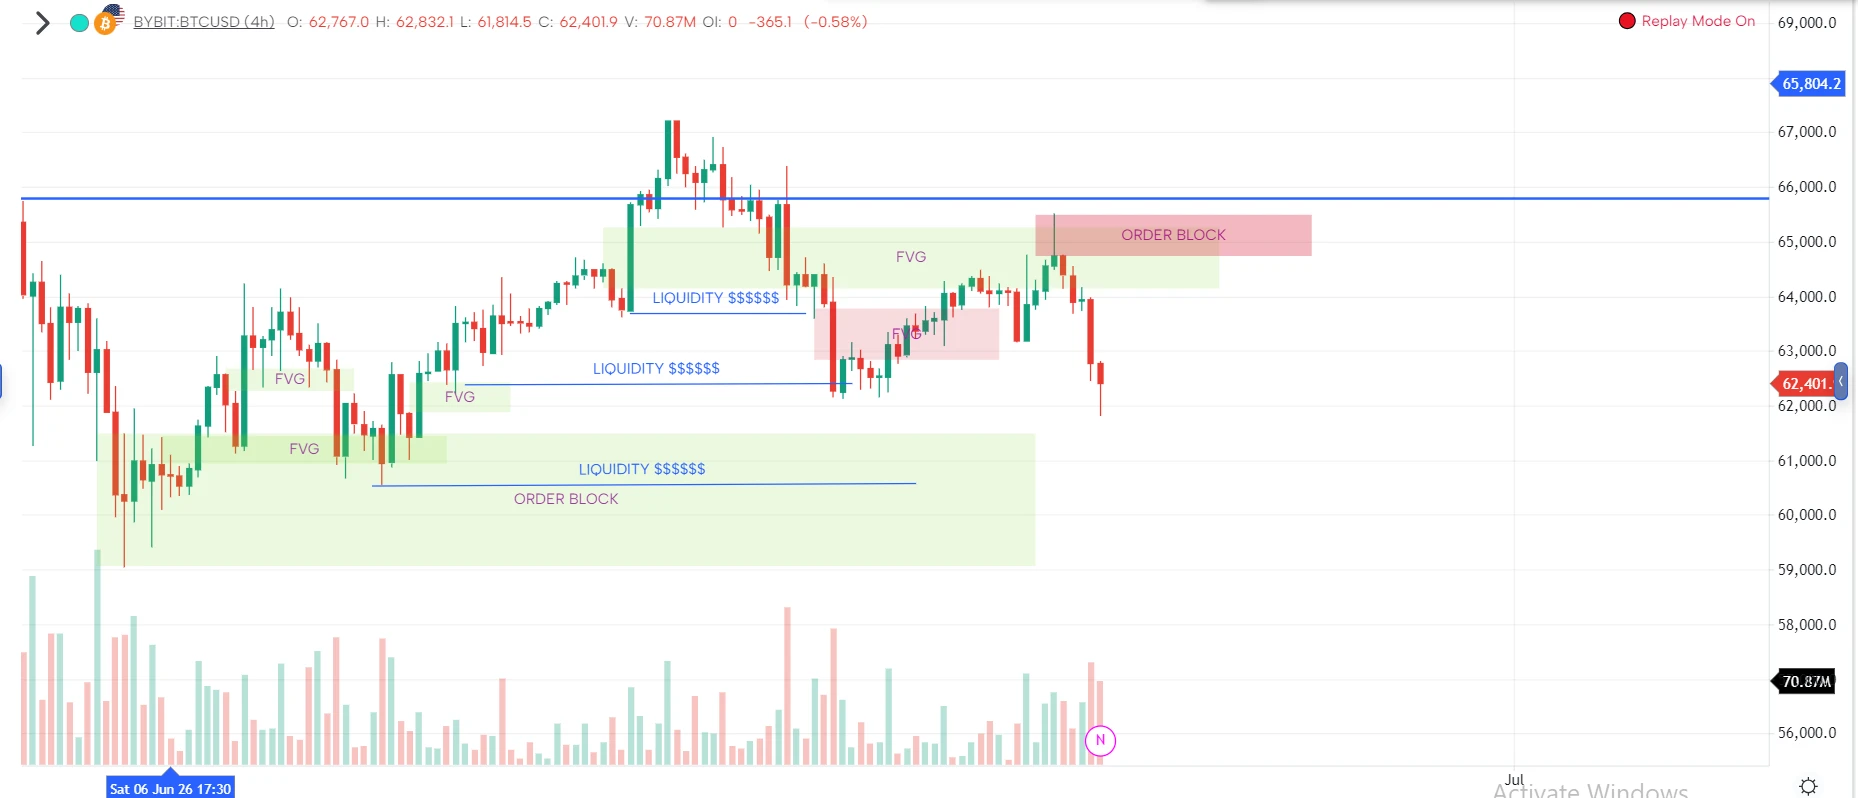
Step 9 — Liquidity sweep through every pool, price breaks below the original OB. The sell-off from the bearish OB tears through every liquidity pool mapped in Step 8, sweeping below even the original order block's low — the full round trip completes.
Example 3 — Order Block Entry, Stop-Loss, and Target
Traded: 1 Jul 2026
A single reference chart that labels every piece of structure involved in an order block trade — the "cheat sheet" the other examples are built on.
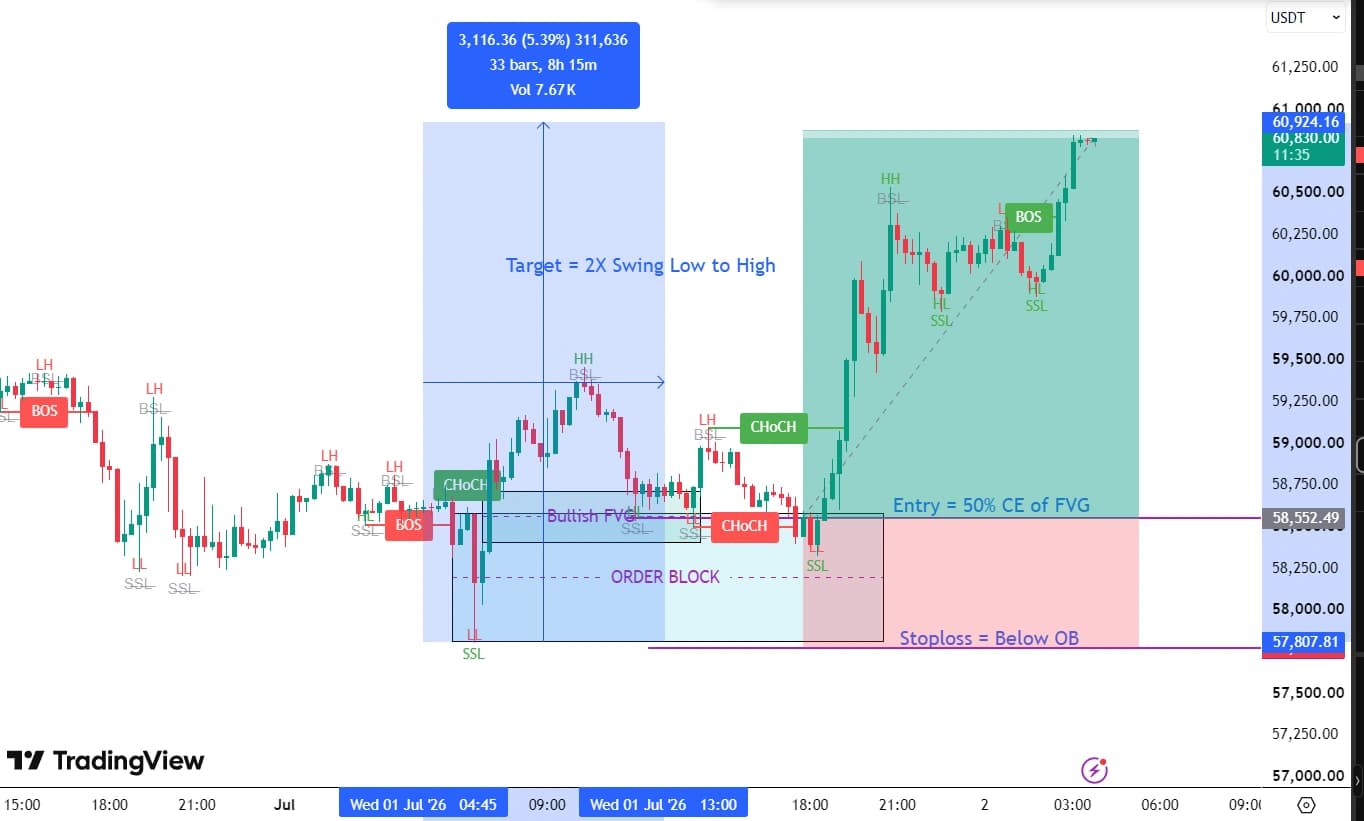
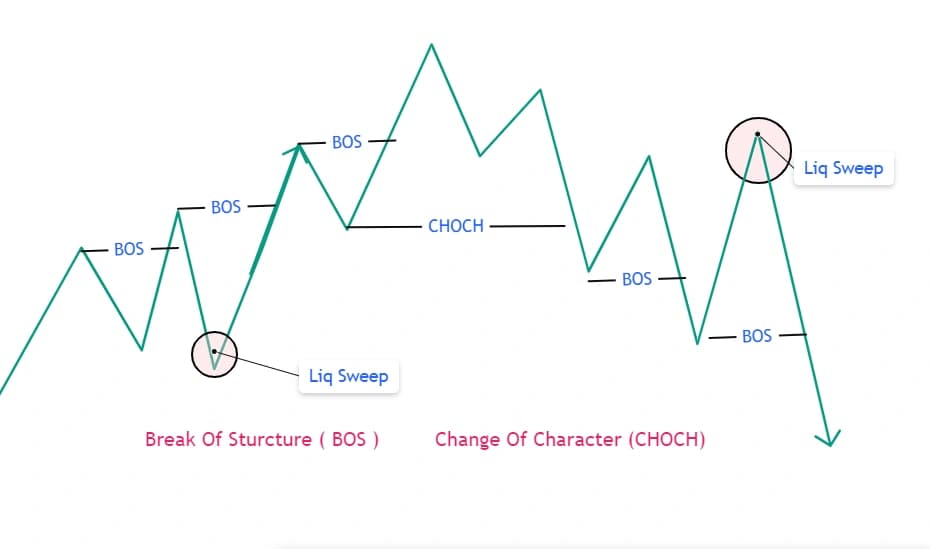
Reading it left to right: bearish structure (LH, BOS, repeated SSL sweeps) gives way to a CHoCH, which is the trigger to mark the order block and its Bullish FVG. Price makes a Higher High with fresh BSL resting above, pulls back — sweeping the SSL below the zone — and the entry is taken at the 50% CE (consequent encroachment) of the FVG, not the first wick that touches the zone. The stop-loss sits below the entire order block, not just below the FVG. As price recovers, a new HL and BOS confirm the reversal is structural, not just a bounce, and the target is a 2x measured move from the original swing low to the first swing high — a purely price-action alternative to fib-extension targets.
Example 4 — Bearish Order Block on Gold (XAUUSD, 30-min)
Traded: 11–17 Jul 2026
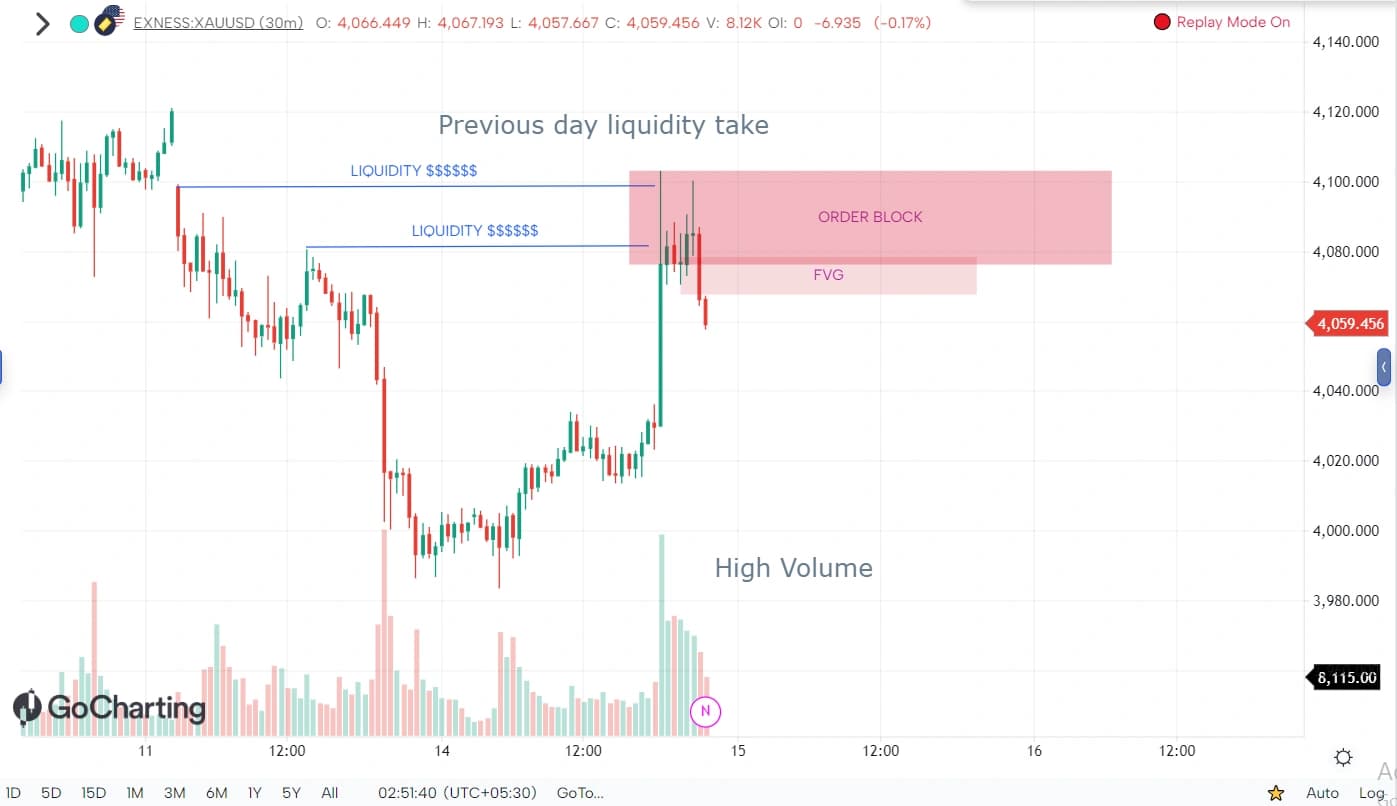
Every prior example was bullish on BTC. This one flips it: a bearish order block on Gold, with a double liquidity sweep and a disciplined early profit-booking exit.
Step 1 — Previous day's liquidity taken, rejection creates the FVG. Price rallies into two stacked liquidity levels above the prior day's highs; once both are swept, a violent rejection candle leaves an FVG and marks the order block.
Step 2 — Expected reversal zones mapped, price returns to the FVG. A fib extension grid (1.618, 2.618, 3.618, 4.236) maps the expected reversal zones downward, and price rallies back into the OB + FVG — the "Best Entry" zone.
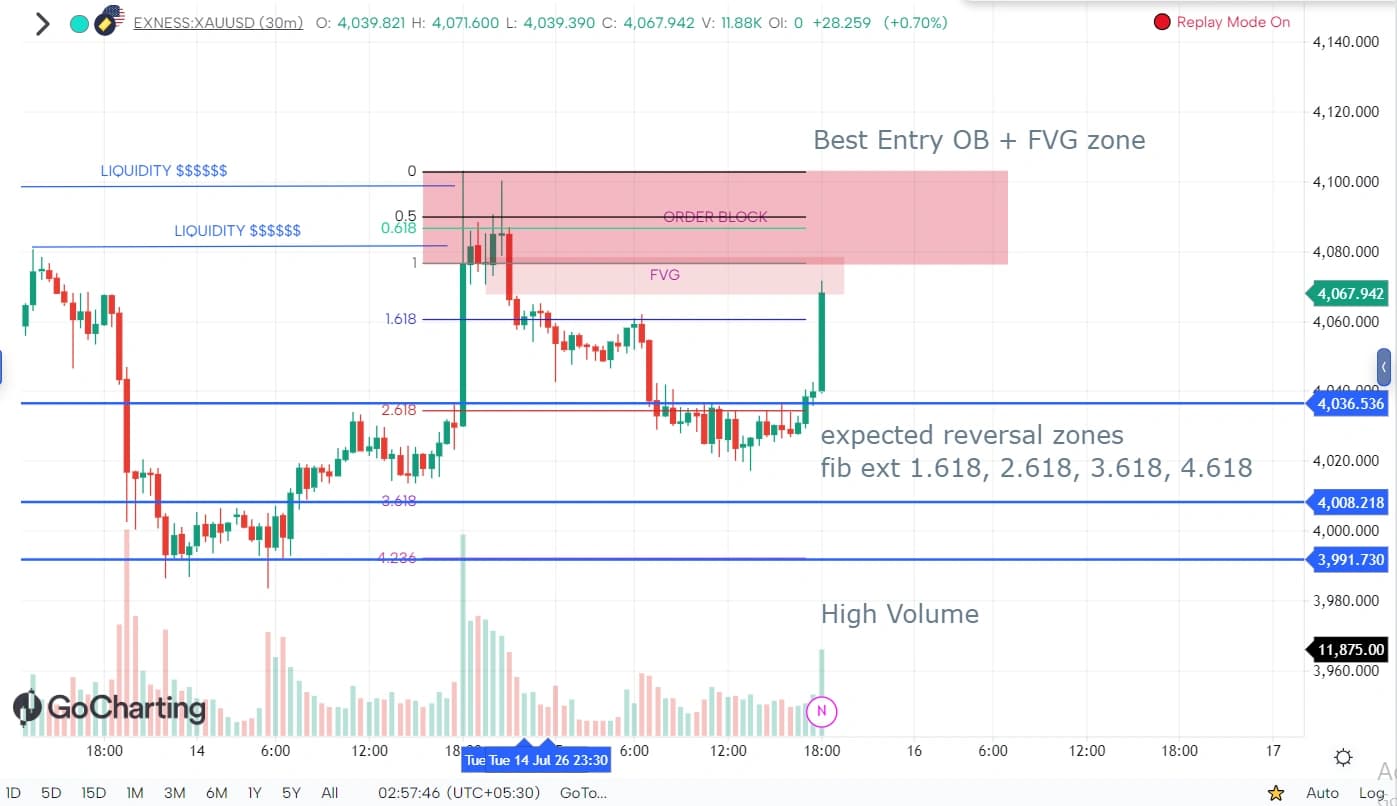
Step 3 — Entry on rejection, targets marked. A second rejection from the zone is the actual entry trigger for the short, with two fib-extension targets: 1.618 at 3,999.21 and 2.618 at 3,951.16.
Step 4 — Only Target 1 achieved, profit booked in full. Price hits Target 1 cleanly but a candle closes back above the 1.618 zone before reaching Target 2 — treated as an invalidation signal, and the full position is closed for profit right there rather than holding out.
Example 5 — A Live Executed Order Block Trade on JPY/USD (4H)
Traded: 9–13 Jul 2026
Unlike the others, this is a live position with the actual entry, stop, target, and closed result showing directly on the chart.
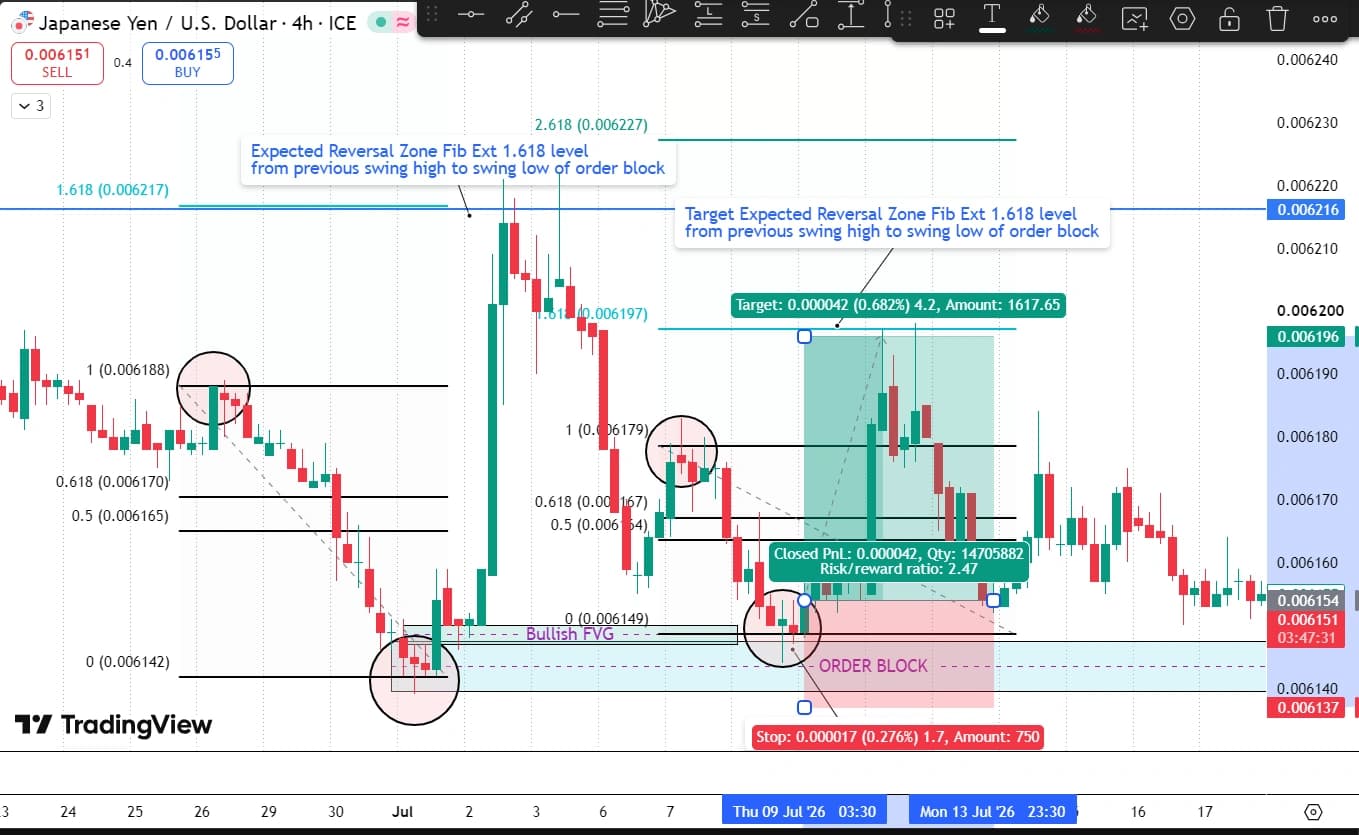
The order block was marked, and the expected move was calculated from the recent swing high to the swing low of the order block — a 1.618 fib extension from that swing was marked as the expected reversal zone. That level also worked out to be the same price as 2x the 4.618 fib extension of the order block candle itself — two independent measurements landing on the same target, a strong confluence signal. Entry was taken at the order block (~0.006149), with the stop just below it at 0.276% (roughly 1.7 pips). The target sat at the 1.618 expected reversal zone, a distance of 0.682% (about 4.2 pips). Price worked through a mid-move pullback and reached target, closing with a realized risk/reward ratio of 2.47.
Example 6 — Order Block with FVG Stop-Loss Gets Hit
Traded: 30–31 Jan 2026
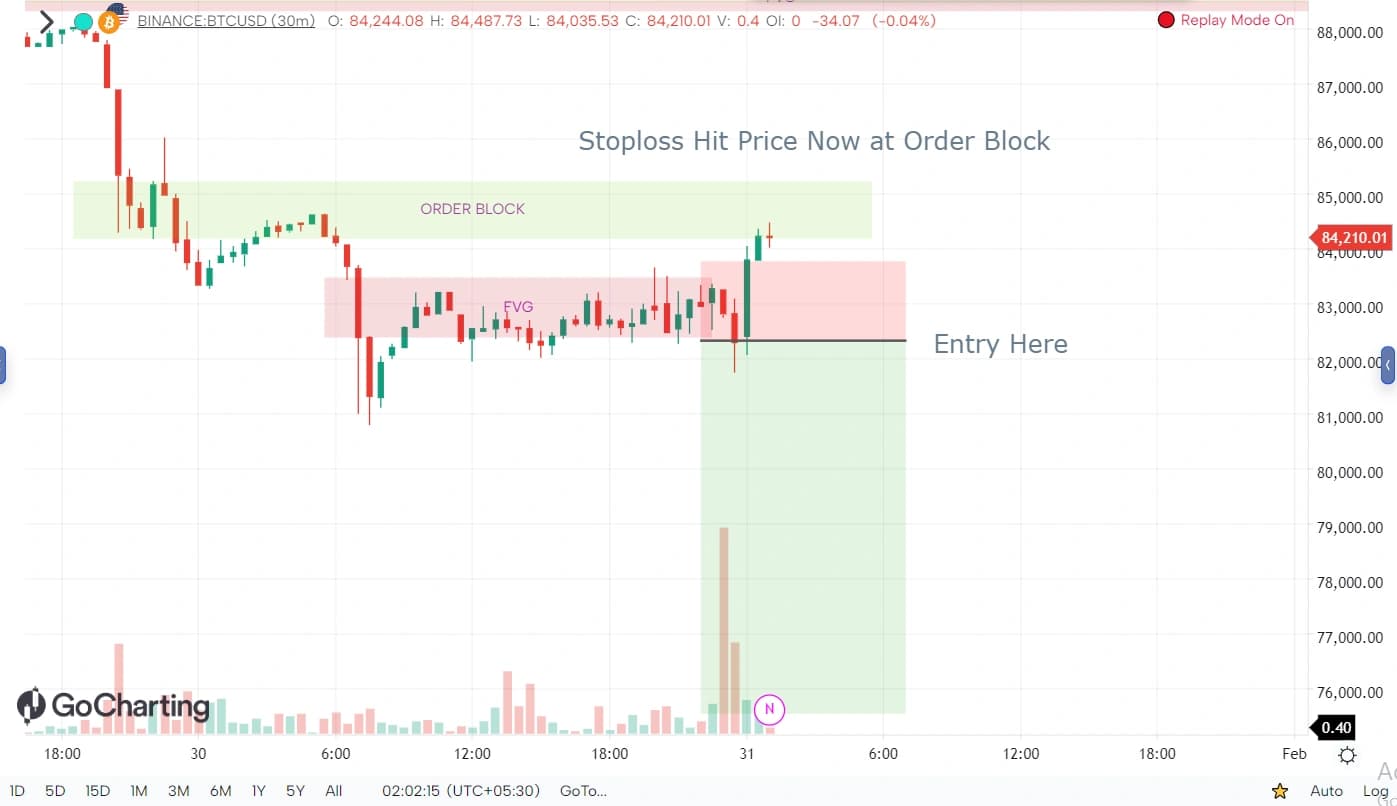
Every example above worked out. This one didn't — and it's worth studying for exactly that reason.
Step 1 — Bearish order block and FVG marked. A clean bearish setup: OB boxed at the high, FVG lower down as price stalls.
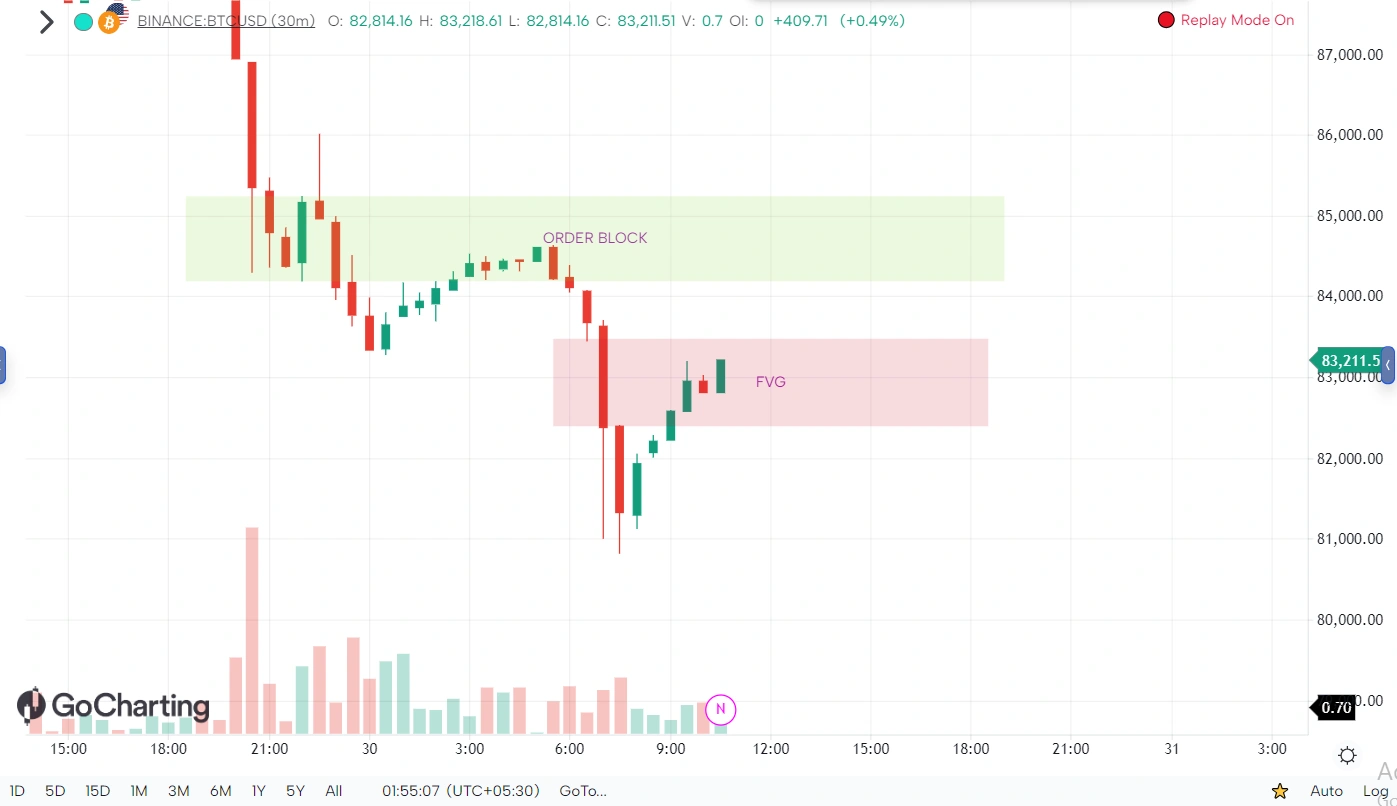
Step 2 — Entry on rejection from the FVG, targets mapped. Price returns to the FVG, gets rejected, and the entry is taken around the 0.618 retracement, with 1.618/2.618/4.618 fib-extension targets already mapped — a textbook setup by every rule.
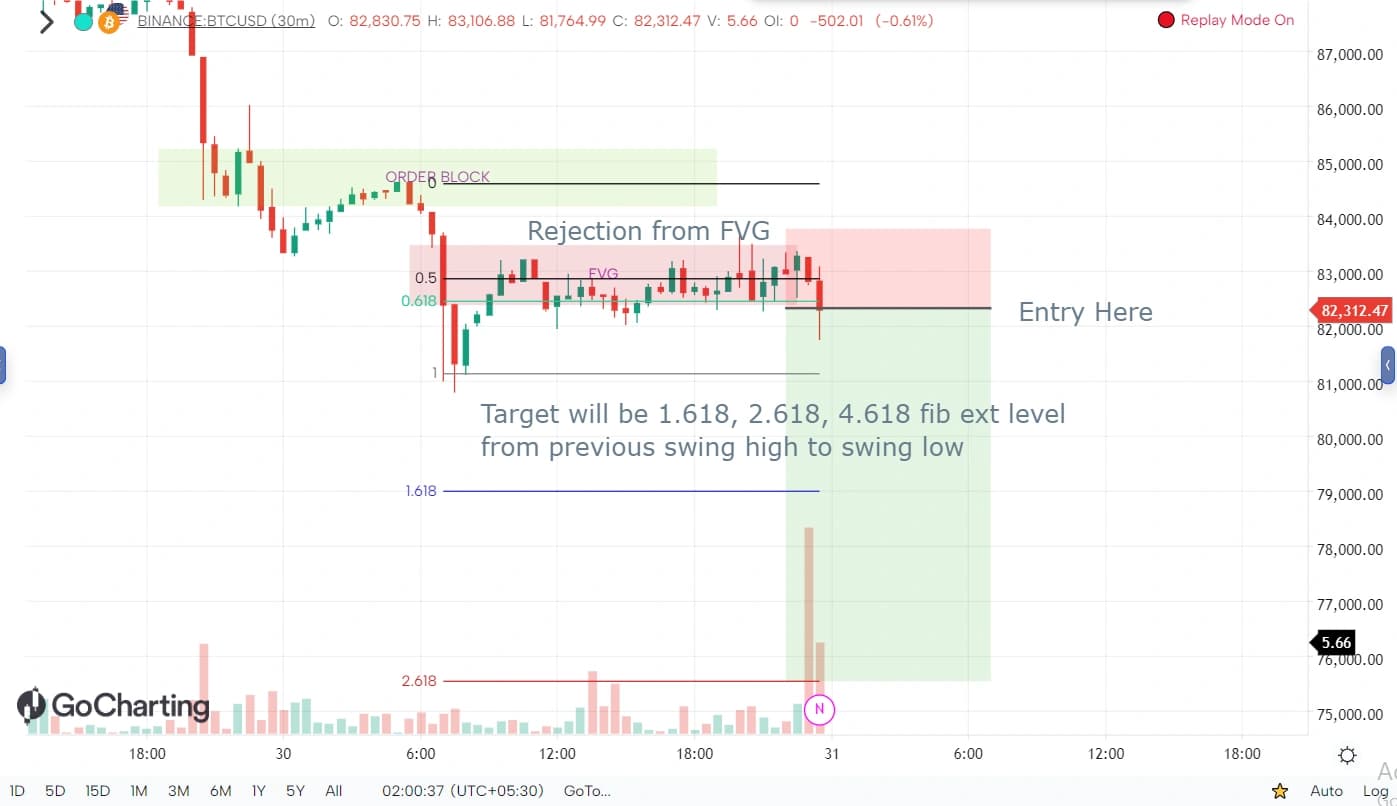
Step 3 — Stop-loss hit at the order block. Price moves in favor initially, then violently reverses — ripping back up through entry and all the way to the order block, where the stop-loss sits. The trade closes as a loss despite meeting every criterion in Steps 1 and 2.
Key Takeaways Across All Six Examples
- Structure comes before the zone. Every OB here was marked only after a CHoCH or BOS confirmed a structural shift — not on a random candle.
- An FVG adds real confirmation. Wherever an OB left a fair value gap on departure, it carried more weight than a bare OB.
- The retest is the trade, not the OB print itself. Marking the zone and entering are two separate steps in every single example.
- Volume on the retest is a genuine filter. Example 1 showed a weak-volume retest treated as a caution flag rather than a signal.
- Liquidity explains the wicks. Example 2's full round-trip and Example 4's double sweep both show price being pulled toward resting stops, not reversing at a "magic" level.
- Entry precision reduces risk. Example 3's 50% CE of the FVG and Example 1's lower-timeframe drilldown both keep the stop distance — and position size — consistent.
- Two valid ways to set a target. Fib extensions (Examples 1, 2, 4, 5) and a structural 2x measured move (Example 3) are both legitimate methods.
- Profit doesn't have to be all-or-nothing. Example 4 booked full profit at Target 1 once price showed a reversal signal, instead of mechanically holding for Target 2.
- The framework works across instruments. Crypto (Examples 1, 2, 6), Gold (Example 4), and Forex (Example 5) all followed the same OB/FVG/liquidity logic.
- Not every setup works — and that's expected. Example 6's stop-loss hit is the honest counterweight to the other five: a textbook-valid setup can still lose, which is exactly why grading, stop placement beyond the wick, and a 2:1 minimum reward-to-risk exist in the first place.
FAQ
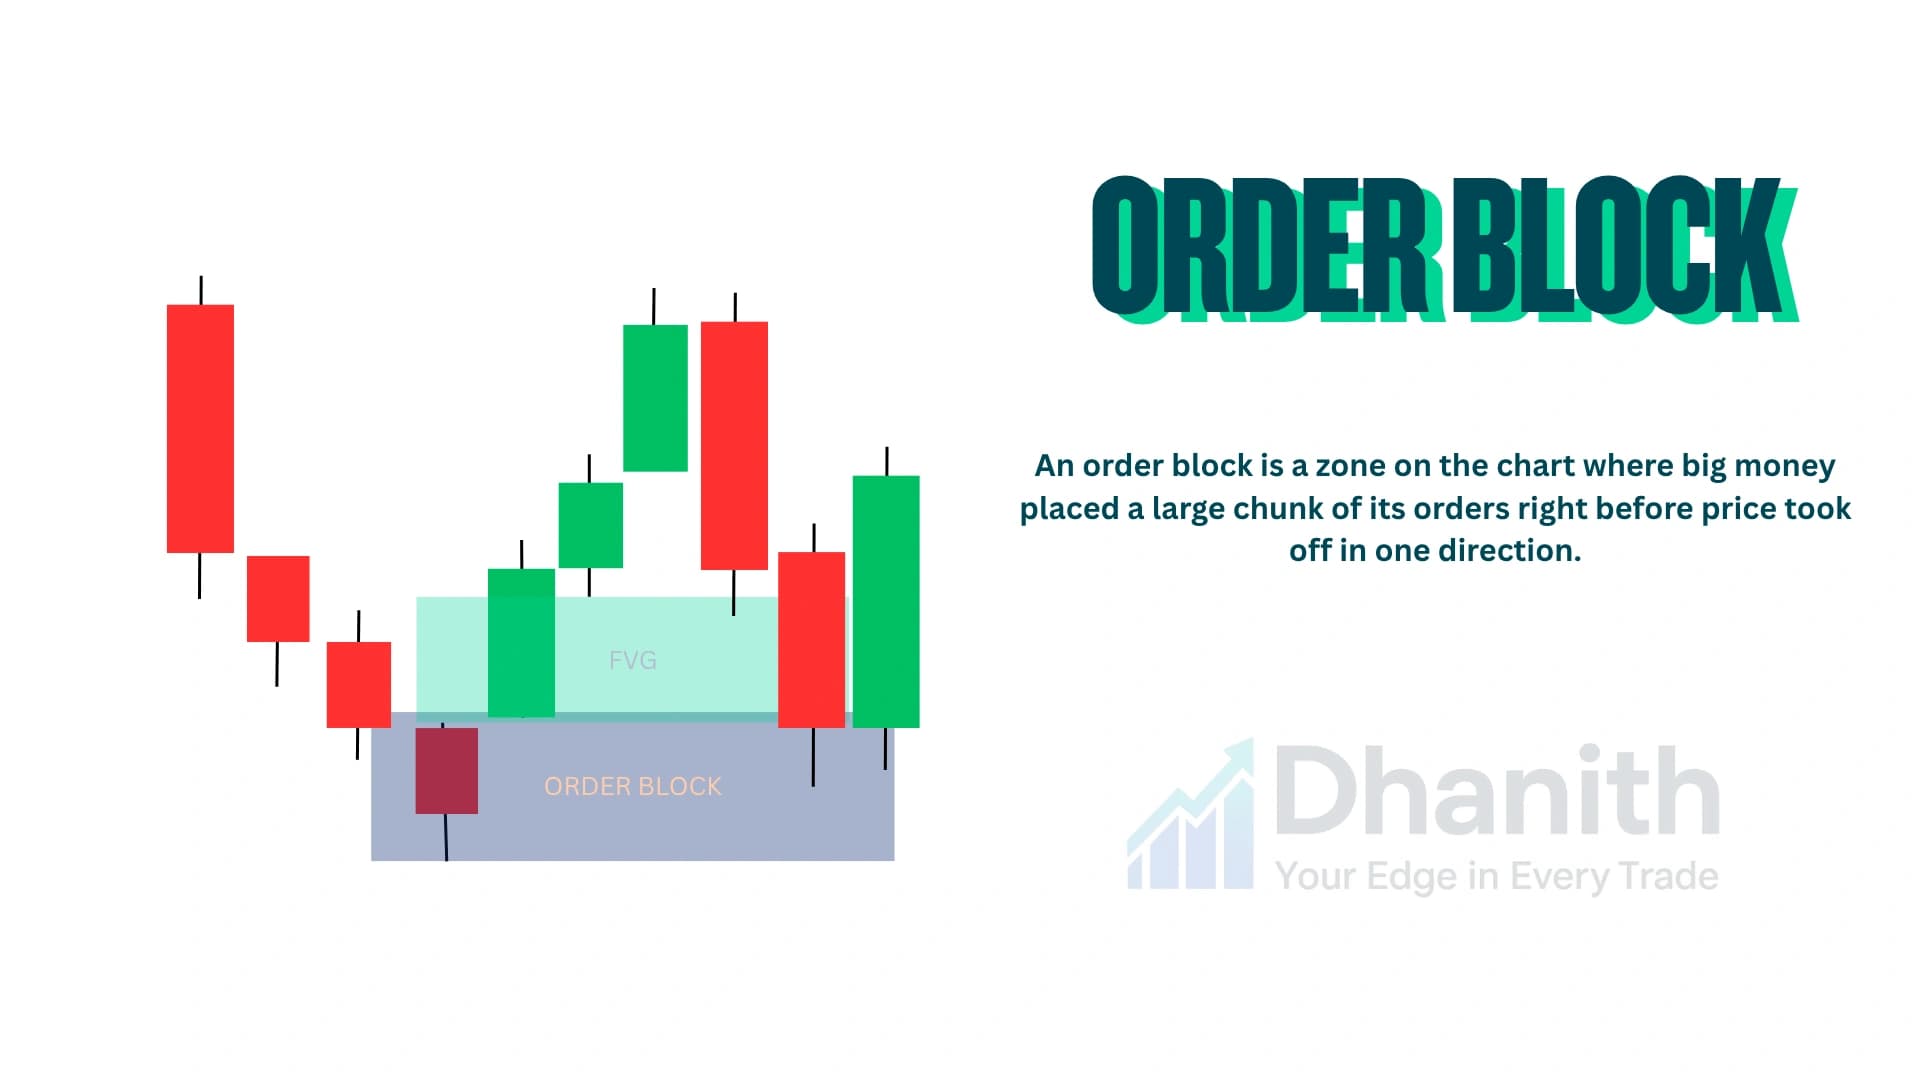
What is an order block in trading? An order block is a supply or demand zone — the last opposing candle before a strong impulsive move that breaks structure. A bullish order block is the last down-close candle before a rally; a bearish order block is the last up-close candle before a sell-off.
How do you find the entry point on an order block? The most precise entry is the 50% CE (consequent encroachment) of a fair value gap sitting inside the order block's impulse leg, as shown in Example 3. A more conservative entry waits for a lower-timeframe CHoCH or market structure shift once price is back inside the zone, as in Example 1.
Where should the stop-loss go on an order block trade? Beyond the wick of the order block, never inside the candle's body. If your entry came from a lower-timeframe order block, the stop goes below that zone specifically rather than the wider higher-timeframe one — see Example 1, Step 8.
How do you set a target after an order block entry? Two methods work: a fibonacci extension (commonly 1.618, 2.618, or 4.618) projected from the recent swing high to swing low, or a structural 2x measured move from the swing low to swing high, as shown in Example 3.
Do order block trades always work? No. Example 6 in this post shows a textbook-valid setup — clean OB, FVG confluence, a defined rejection entry — that still gets stopped out. Realistic win rates for this style of trading sit well below 100%, which is why stop-loss placement and position sizing matter more than any single setup.
Can order blocks be traded on Gold and Forex, or only crypto? Yes — Example 4 (Gold/XAUUSD) and Example 5 (JPY/USD) in this post use the same order block, FVG, and fibonacci-extension logic as the Bitcoin examples, with the same results.
Have a question about this article?
Comment on our latest Instagram post or send us a DM — we reply to every one.
@dhanith_officialWas this article helpful?
Click to rate
Founder, Dhanith Trading
7+ years trading Nifty, Bank Nifty, NSE stocks, and commodities — specializing in Smart Money Concepts (SMC) and ICT price action. Founder of Dhanith — a trading journal, intraday screener, and risk tools platform built for retail traders.
Dhanith Newsletter
Enjoyed this article? Get more like it.
New trading guides, candlestick patterns, SMC strategies, and tool updates — straight to your inbox. Free, for Indian traders.
No spam. Unsubscribe anytime.
Continue Reading