On this page
- What Is Risk Reward Ratio?
- Why Risk Reward Ratio Matters in Day Trading
- How to Calculate Risk Reward Ratio
- Step-by-Step Example (S&P 500 E-mini Futures)
- Example (US Stock — Swing Trade)
- Risk Reward Ratio vs Win Rate: The Math That Changes Everything
- The Core Concept
- The Break-Even Win Rate Table
- The 100-Trade Profitability Table (in R units)
- Key Takeaway
- The Account Growth Math: What 1:3 R:R Actually Does to Your Capital
- Best Risk Reward Ratio by Trading Style
- Scalping
- Day Trading
- Swing Trading
- Options Trading
- Forex Trading
- Benefits of a Defined Risk Reward Ratio
- Limitations of Risk Reward Ratio
- How to Set Stop Loss and Target for a Good R:R
- Common Risk Reward Ratio Mistakes
- Frequently Asked Questions
- Final Thoughts
Learn the best risk reward ratio for day trading, scalping, swing trading and options. Includes win rate tables, $ examples, breakeven math, and a free RR calculator.
Most traders obsess over one number: their win rate. They want to be right 70%, 80%, even 90% of the time. They feel shame after losing trades and validation after winning ones. And they completely ignore whether the size of those wins versus losses actually makes them money over time.
Win rate is a vanity metric. Risk to reward ratio is what actually determines whether you have an edge.
Here is the uncomfortable truth: a trader winning only 40% of their trades can be significantly more profitable than a trader winning 70% — if their risk reward ratio is better. This guide explains exactly why, with complete math, real $ examples, and the specific ratios that work best for every trading style from scalping to swing trading.
What Is Risk Reward Ratio?
The risk reward ratio (R:R) is the comparison between how much you risk losing on a trade versus how much you stand to gain. It is calculated using three levels you define before entering any trade:
- Entry price — where you enter the trade
- Stop loss — where you exit if wrong (your maximum risk)
- Target price — where you exit if right (your potential reward)
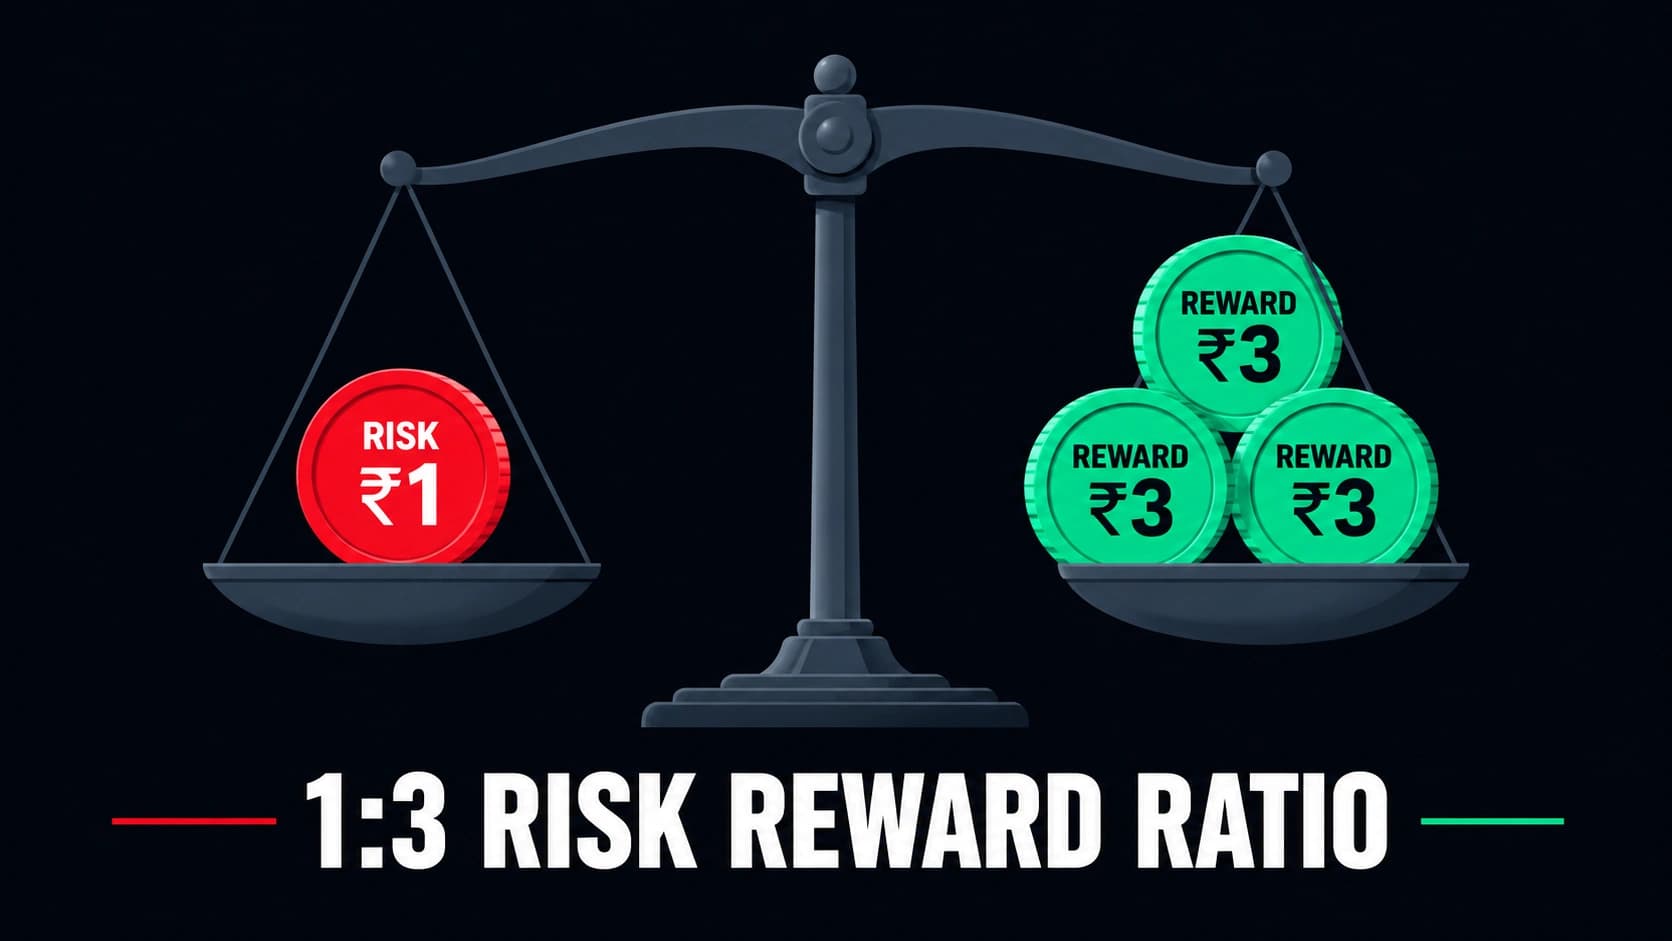
A 1:3 ratio means that for every $1 risked, there is a potential profit of $3. This ratio is considered favorable and is often targeted by traders.
The notation can be written two ways — both mean the same thing:
- Risk:Reward = 1:3 — You risk 1 to make 3
- Reward:Risk = 3:1 — Your reward is 3 times your risk
Throughout this guide we use the Risk:Reward format (1:3) since this is the most commonly used convention in trading communities worldwide.
Why Risk Reward Ratio Matters in Day Trading
A minimum of 2:1 is the standard recommendation for day trading. This means your profit target is at least twice the distance of your stop loss. At 2:1, you can be profitable with a 40 percent win rate.
Without a defined R:R, you are essentially gambling — you have no mathematical edge, and your results depend entirely on luck across a large sample of trades. With a defined R:R, you have a structured framework where even a losing strategy can be identified quickly and fixed, and a profitable strategy can be identified and scaled.
If you have any plans of trading long-term, then you absolutely have to think and operate in terms of risk and reward. This golden ratio applies to all forms of trading — day trading, swing trading and long-term investing.
The practical impact: a trader with a 1:3 R:R who wins only 4 out of 10 trades still makes money. A trader with a 1:1 R:R who wins only 4 out of 10 trades loses money. Same number of wins. Completely different outcome. The only variable is the ratio.
How to Calculate Risk Reward Ratio
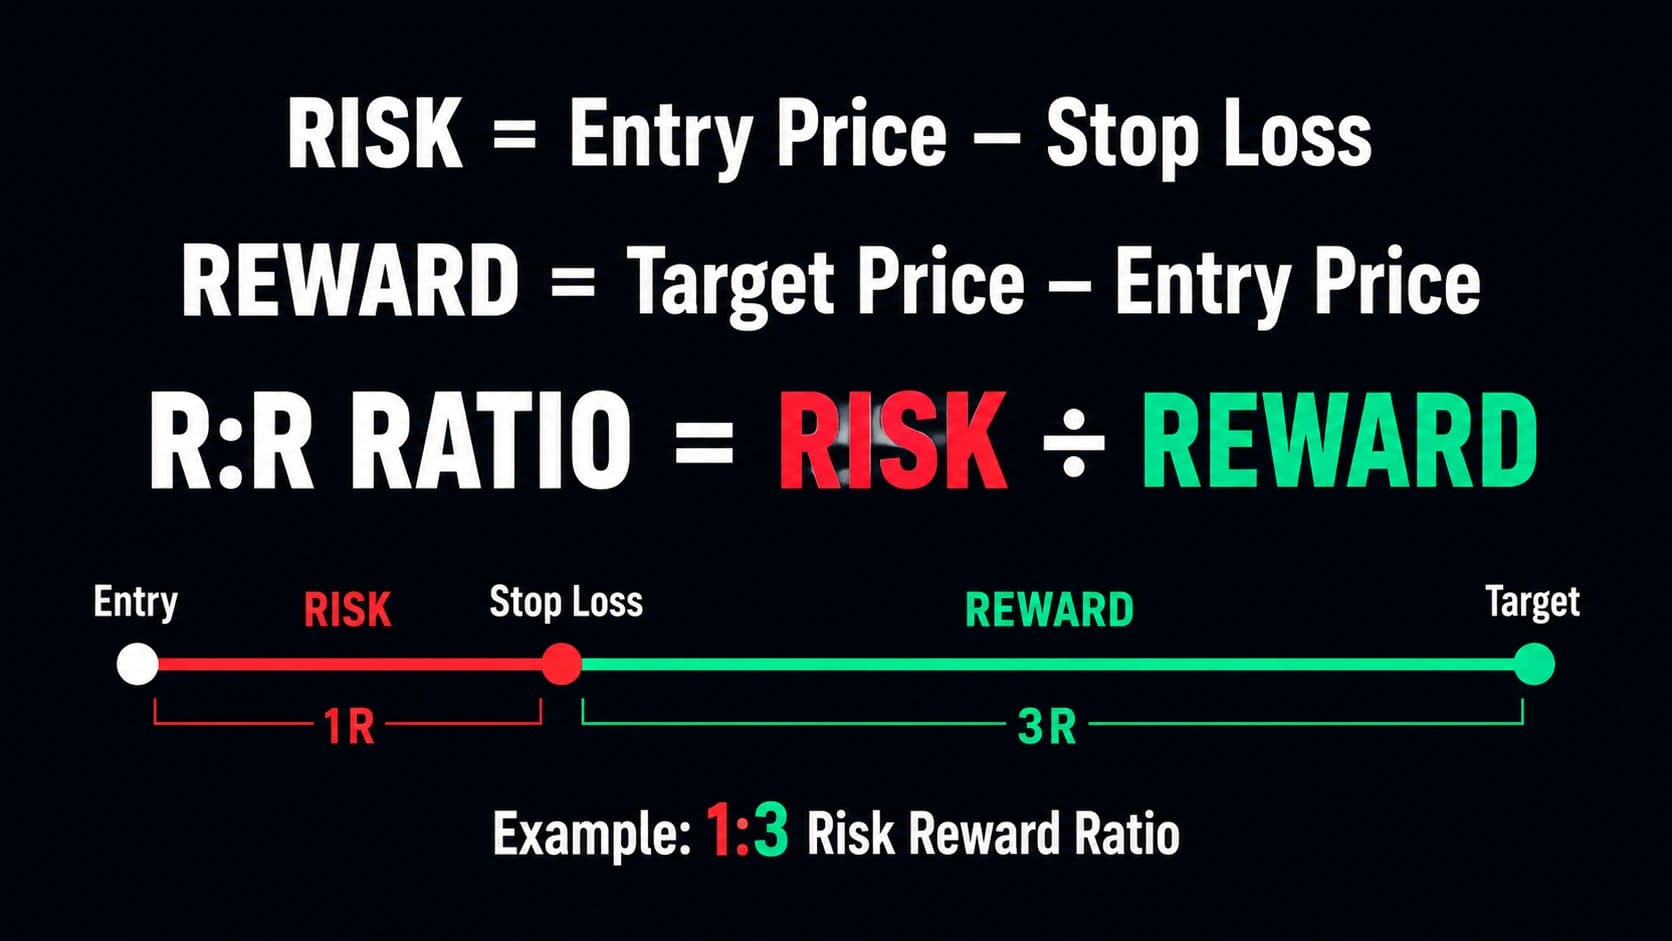
The formula is simple:
Risk   = Entry Price - Stop Loss Price
Reward = Target Price - Entry Price

Risk Reward Ratio = Risk ÷ Reward
Step-by-Step Example (S&P 500 E-mini Futures)
Entry:      6,000
Stop Loss:  5,990  → Risk = 6,000 - 5,990 = 10 points
Target:     6,030  → Reward = 6,030 - 6,000 = 30 points

R:R = 10 ÷ 30 = 1:3
For $ terms with the E-mini S&P 500 (ES) — $50 per point, 1 contract:
Risk per trade   = 10 × 50 = $500
Reward per trade = 30 × 50 = $1,500
Example (US Stock — Swing Trade)
Stock:      XYZ
Entry:      $600
Stop Loss:  $570  → Risk = $30
Target:     $690  → Reward = $90

R:R = 30 ÷ 90 = 1:3

For 100 shares:
Risk   = 100 × $30 = $3,000
Reward = 100 × $90 = $9,000
Use the Dhanith Risk Calculator to calculate your exact R:R, position size, and expected profit for any trade instantly — without doing the math manually.
Risk Reward Ratio vs Win Rate: The Math That Changes Everything
This is the most important section of this entire guide. Most traders never understand this relationship — and it costs them money every single month.
The Core Concept
If a trader has a 1:3 R:R and a 40% win rate, are they profitable?
Yes — significantly. Here is the exact math:
For every 10 trades:
- Wins: 4 × +3R = +12R
- Losses: 6 × -1R = -6R
- Net result = +6R
Example with $1,000 risk per trade:
- 4 winning trades = +$12,000
- 6 losing trades = -$6,000
- Net profit = +$6,000 after 10 trades
The break-even win rate for a 1:3 R:R strategy is only 25%. Any win rate above 25% is profitable in the long run, assuming consistent execution.
The Break-Even Win Rate Table
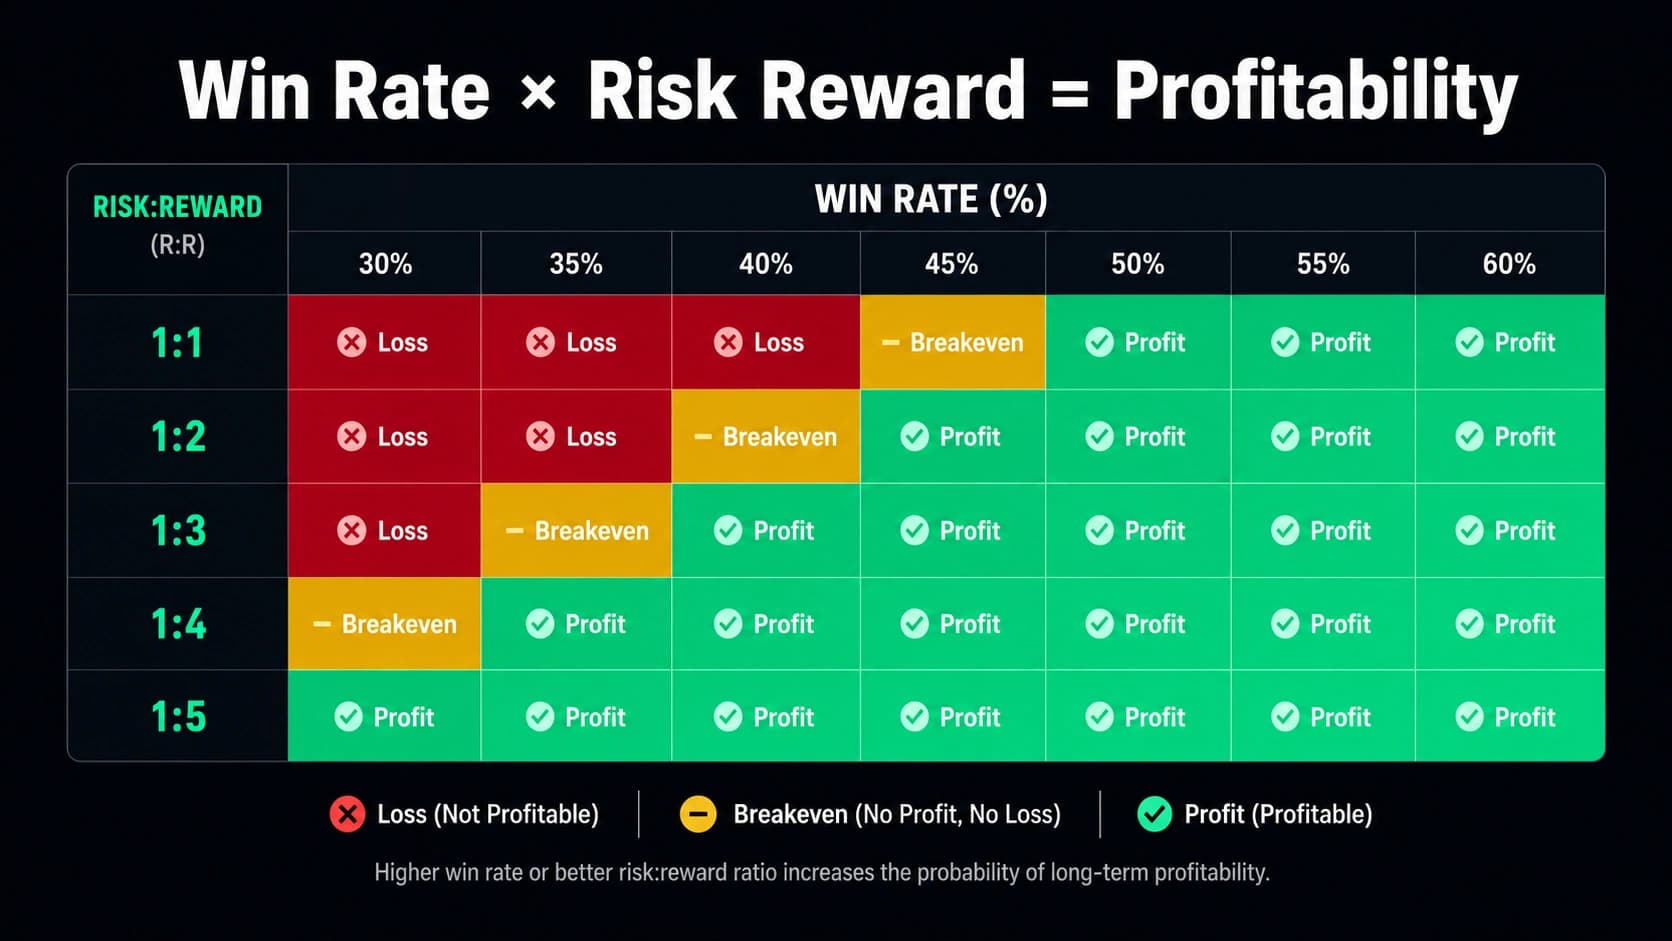
This table shows the minimum win rate you need to just break even at each R:R ratio — below this, you lose money over time:
| Risk:Reward | Break-even Win Rate | 30% Win | 40% Win | 50% Win | 60% Win |
|---|---|---|---|---|---|
| 1:1 | 50% | ❌ Loss | ❌ Loss | ⚠️ Break-even | ✅ Profit |
| 1:2 | 33.3% | ❌ Small Loss | ✅ Profit | ✅ Good Profit | ✅ High Profit |
| 1:3 | 25% | ✅ Profit | ✅ Strong Profit | ✅ Excellent Profit | ✅ Very High Profit |
| 1:4 | 20% | ✅ Good Profit | ✅ Excellent Profit | ✅ Huge Profit | ✅ Outstanding Profit |
| 1:5 | 16.7% | ✅ Excellent Profit | ✅ Huge Profit | ✅ Exceptional Profit | ✅ Massive Profit |
Key insight: At 1:1 R:R, you need to win more than 50% of trades just to break even — before fees. At 1:3 R:R, you only need to win 25% of trades to break even. Higher R:R gives you significantly more room to be wrong and still make money.
The 100-Trade Profitability Table (in R units)
For 100 trades, risking 1R per trade:
| Win Rate | 1:2 R:R | 1:3 R:R | 1:4 R:R |
|---|---|---|---|
| 30% | -10R | +20R | +50R |
| 40% | +20R | +60R | +100R |
| 50% | +50R | +100R | +150R |
| 60% | +80R | +140R | +200R |
The standout number: A 1:3 R:R with a 40% win rate produces +60R over 100 trades. This is not a theoretical edge — it is a substantial, sustainable mathematical advantage.
Key Takeaway
Higher Risk:Reward lets you stay profitable with a lower win rate. Higher win rate lets you be profitable even with a lower Risk:Reward. A 1:3 R:R with a 40% win rate is a very solid combination.
The math that proves win rate is a vanity metric — 40% wins at 3:1 outperforms 70% wins at 0.5:1 every single time.
This is why many professional traders focus on maintaining a favorable risk-reward ratio rather than trying to win every trade.
Use the Dhanith Risk Calculator to enter your own win rate and R:R and see exactly what your expected profit is over 100 trades.
The Account Growth Math: What 1:3 R:R Actually Does to Your Capital
If a trader risks 2% of their account per trade and achieves 1:3 R:R with a 40% win rate, here is what happens over 100 trades:
Risk per losing trade:    2% of account
Reward per winning trade: 6% (3 × 2%)

With 40% win rate over 100 trades:
40 wins   × 6% = +240%
60 losses × 2% = -120%

Net expectancy = +120% of starting capital
Example starting with $100,000:
40 winning trades × $6,000 = $240,000
60 losing trades  × $2,000 = $120,000
                              ──────────
Net profit                  = $120,000
Expected ending balance     ≈ $220,000
Keep in mind: real results vary because wins and losses occur in different sequences, compounding changes the exact outcome, and trading costs and slippage affect actual performance. But the mathematical foundation is clear — a consistent 1:3 R:R with a 40% win rate applied over enough trades produces substantial account growth.
Best Risk Reward Ratio by Trading Style
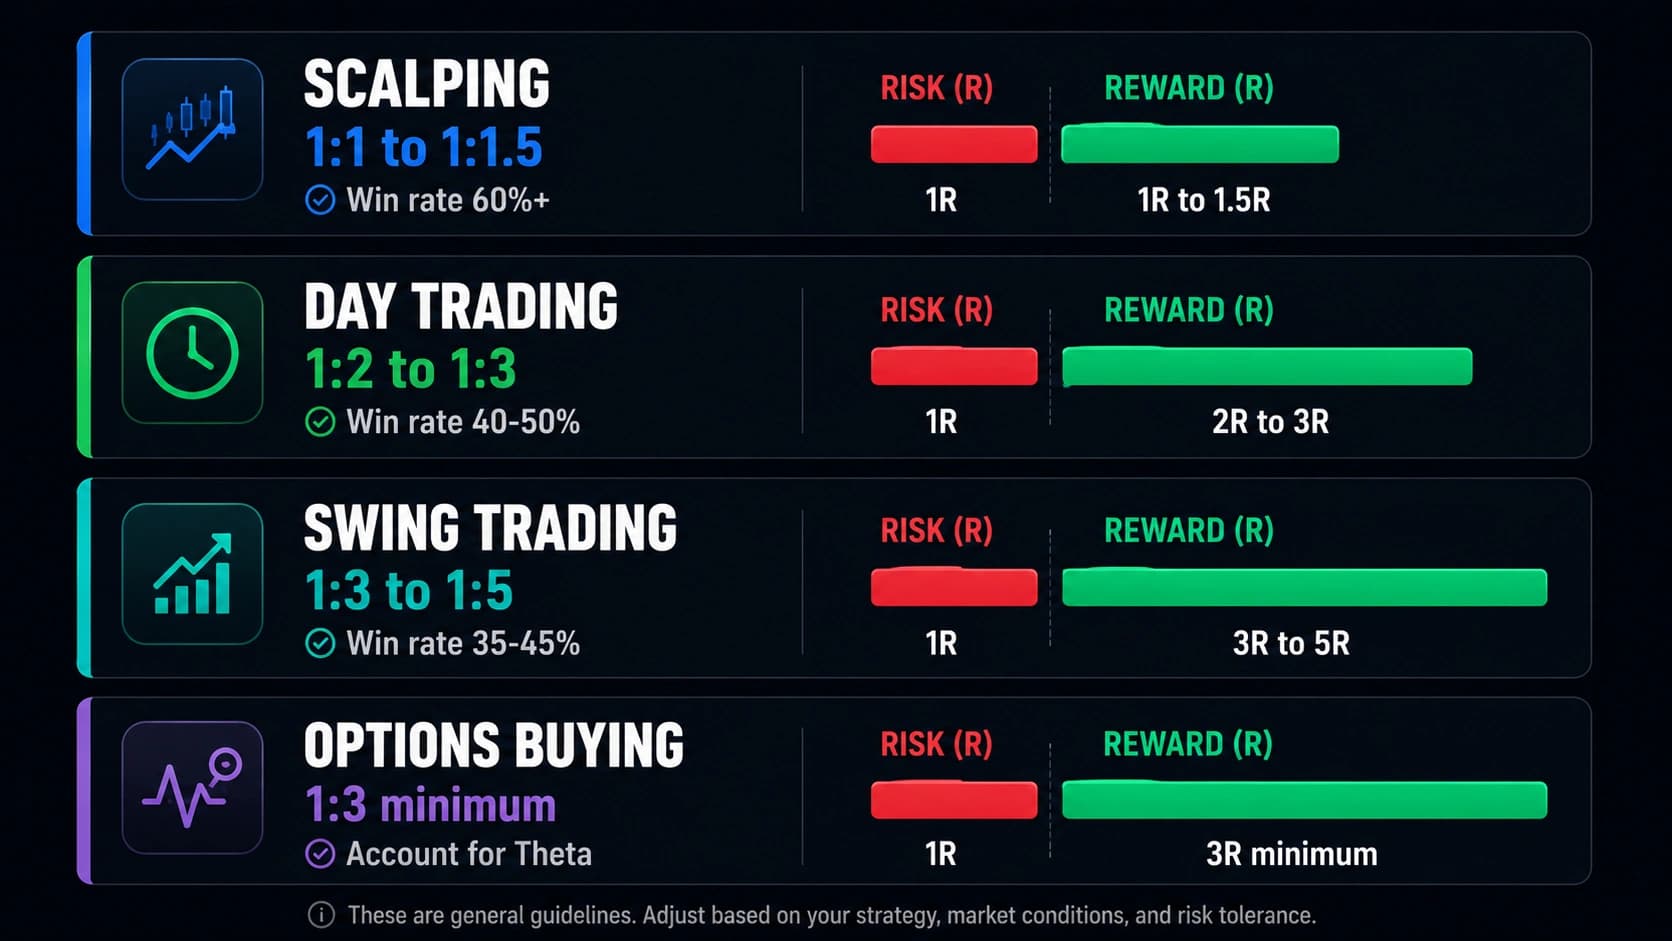
Different trading styles require different ratios: scalping 1:1 to 1.5:1 with high win rates, day trading 2:1 to 3:1, swing trading 3:1 to 5:1.
Scalping
Recommended R:R: 1:1 to 1:1.5
For scalping strategies with win rates above 60%, a 1:0.8 to 1:1.2 risk reward ratio produces consistent profits. Scalpers compensate with high win rates (60 to 75 percent). A scalper risking $200 to make $200 to $300 needs to win frequently, but the setups appear many times per day.
Scalping works with a lower R:R because the high frequency of trades means even a small edge per trade compounds meaningfully over many sessions. The tradeoff: you must maintain 60%+ win rates consistently, which requires excellent execution and strict discipline.
Best for: Experienced traders comfortable executing 10–20 trades per session with tight, pre-defined stops.
Day Trading
Recommended R:R: 1:2 to 1:3
Most day traders should target 2:1 to 3:1 ratios. You risk $500 to make $1,000 to $1,500. At these ratios, a 40 to 50 percent win rate is profitable. Day trading offers enough price movement to capture 2R or 3R on most instruments during a single session.
For US day traders specifically, the 9:30 AM–11:00 AM ET window typically provides the largest and cleanest momentum moves — making 1:2 to 1:3 R:R targets realistic rather than aspirational. After 1:00 PM ET, volatility tends to decrease on most US instruments, making larger R:R targets harder to achieve consistently.
Best for: Most retail traders. Balances the need for realistic targets with meaningful per-trade rewards.
Swing Trading
Recommended R:R: 1:3 to 1:5
Swing trading strategies can achieve 3:1 to 5:1 ratios because you hold for days or weeks, giving trades more room to develop.
With a multi-day holding period, price has more room to travel to the target — making 3:1 and higher ratios genuinely achievable. The tradeoff is holding through overnight gaps and higher volatility, which requires a wider stop loss in absolute terms.
Best for: Traders who cannot monitor screens during market hours, or those who prefer fewer but higher-quality setups.
Options Trading
Recommended R:R: 1:2 minimum (as buyer); varies for sellers
Options buying (buying calls or puts): At minimum 1:2, ideally 1:3 or higher. This accounts for the Theta decay working against you — even if direction is correct, a slow move may not produce sufficient profit to overcome time value loss.
Options selling (Iron Condor, Bull Put Spread): R:R is often below 1:1 on the face of it (collecting $35 premium with $165 max risk, for example). But the high probability of expiry (often 70%+) makes this mathematically valid — the Theta advantage compensates for the unfavorable nominal R:R.
Best for: Buyers should target 1:3+ to account for Theta. Sellers should focus on probability of profit rather than nominal R:R.
Forex Trading
Recommended R:R: 1:2 minimum, 1:3 ideal
At 2:1, you can be profitable with a 40 percent win rate. For more information on risk-reward ratio in forex trading, ThinkMarkets provides a comprehensive breakdown: Risk/Reward Ratio in Forex — ThinkMarkets
Forex pairs, particularly majors like EUR/USD and USD/JPY, offer sufficient intraday volatility to realistically target 1:2 and 1:3 setups. The high liquidity and near-24-hour availability make forex well-suited to consistent R:R-based systematic trading.
Style-by-Style Summary Table:
| Trading Style | Recommended R:R | Required Win Rate | Typical Holding Period |
|---|---|---|---|
| Scalping | 1:1 to 1:1.5 | 60–75%+ | Seconds to minutes |
| Day Trading | 1:2 to 1:3 | 40–50% | Minutes to hours |
| Swing Trading | 1:3 to 1:5 | 35–45% | Days to weeks |
| Options Buying | 1:3 minimum | 35–45% | Hours to weeks |
| Forex | 1:2 to 1:3 | 40–50% | Minutes to days |
Benefits of a Defined Risk Reward Ratio
1. Profitability without perfection. A 1:3 R:R means you can lose 3 trades for every 1 winner and still break even. This removes the psychological pressure of needing to be right constantly.
2. Eliminates emotional exits. When your target and stop are pre-defined, there is no real-time decision required mid-trade. This is the single most effective cure for the two most common emotional mistakes — exiting winners too early and holding losers too long.
3. Quantifies your edge over time. By tracking R:R alongside win rate in a trading journal, you can calculate your expected value per trade and know whether you are genuinely profitable or just running on a lucky streak.
4. Enables position sizing. The ratio tells you whether a trade is worth taking. The position size determines how much capital you put on that trade. Without a defined R:R, consistent position sizing is impossible.
5. Makes losing streaks survivable. If you risk 1 percent of your trading account on each trade, it does not hurt you to lose five trades in a row. A defined R:R combined with a 1–2% per-trade risk rule means even a 10-trade losing streak costs only 10–20% of the account — manageable and recoverable.
Limitations of Risk Reward Ratio
1. R:R alone does not determine profitability. A higher R:R is not automatically better. A 1:4 setup that only wins 15% of the time loses money. R:R must be paired with a realistic win rate to produce positive expectancy.
2. Targets must be realistic for the instrument. A 5:1 ratio sounds great, but if the stock never moves that far in a single session, you will watch winning trades turn into losers. Your ratio must be based on what the instrument actually does, not what you hope it will do.
3. R:R does not account for trading costs. Commissions, exchange fees, regulatory fees, and slippage reduce the actual realized R:R below the planned ratio. A trade with a planned 1:2 R:R might realize only 1:1.6 after costs.
4. Stop placement determines everything. A risk reward ratio is only as good as the levels you use to define it. If your stop is placed randomly and your target is picked because it looks about right, your ratio is meaningless. Stops must sit at structurally valid invalidation points, not arbitrary distances.
5. R:R cannot compensate for a broken strategy. A consistent 1:3 R:R applied to a strategy with no real edge still loses money. The ratio amplifies whatever edge (or lack of edge) the underlying strategy already has.
How to Set Stop Loss and Target for a Good R:R
Step 1 — Identify your stop loss first. Your stop belongs just beyond the level that makes your trade invalid. For a long trade above support, the stop goes below support. For a short trade below resistance, the stop goes above resistance. The distance between your entry and that invalidation level is your risk.
Step 2 — Find your target at the next logical level. For a long trade, that's the next resistance level, VWAP, a prior swing high, or a Fibonacci extension. For a short trade, it's the next support level, a prior swing low, or the day's low.
Step 3 — Calculate the ratio and check the minimum. Divide the reward distance by the risk distance. If the ratio does not meet your minimum (typically 2:1 for day trading, 3:1 for swing trading), skip the trade. This single rule eliminates a large percentage of losing trades.
Step 4 — Never move your stop to "improve" the ratio. Moving your stop loss to improve your ratio mid-trade does not change the math. It just makes you wrong later instead of wrong now. The stop is set before entry and stays unless your original technical rationale has changed.
Calculate your exact stop loss, target, and R:R before every trade using the Dhanith Risk Calculator. Enter your entry, stop, and target price — the calculator shows your R:R, position size for 1% risk, and expected profit instantly.
Common Risk Reward Ratio Mistakes
Mistake 1 — Using 1:1 R:R for day trading. At 1:1, you need more than 50% win rate just to break even before fees. Most retail traders have win rates below 50%, making 1:1 a guaranteed path to slow losses. Minimum 1:2 for day trading.
Mistake 2 — Cutting winners at 1R when the plan was 2R or 3R. You plan a 2:1 trade but exit at 1:1 because you are afraid of giving back profit. Over time, this habit destroys the advantage of a good ratio because your real reward-to-risk is lower than your planned reward-to-risk.
Mistake 3 — Setting unrealistic targets. A 1:5 R:R that requires a 5% intraday move from a stock with a 1.5% average daily range will almost never be achieved. The R:R must match what the instrument actually does.
Mistake 4 — Adjusting stops during a losing streak. The correct response to a losing streak is to reduce position size or stop trading for the day, not to widen targets in hopes of recovering faster.
Mistake 5 — Not tracking actual R:R vs planned R:R. Planning a 1:3 trade but realizing 1:1.2 due to early exits is invisible without a trading journal. Track your R-multiples to see if you are capturing what you plan.
Dhanith Trading Journal
Track every trade. Find your real edge.
Log your setups, grade your entries, and review your trading patterns — all in one place. The journal built for serious SMC traders.
Frequently Asked Questions
Q: What is the best risk reward ratio for day trading? A minimum of 2:1 is the standard recommendation for day trading. At 2:1, you can be profitable with a 40 percent win rate. For most retail day traders trading US stocks and index futures like the S&P 500 (ES) or Nasdaq (NQ), a 1:2 to 1:3 R:R is the practical sweet spot — high enough to be profitable with a realistic win rate, while still setting targets that price can actually reach within a single session.
Q: Can I be profitable with a 40% win rate? Yes — if your R:R is favorable. With a 1:3 R:R and 40% win rate over 10 trades, you make +6R net. Over 100 trades risking $1,000 each, that translates to approximately $60,000 net profit before costs. The math is unambiguous: higher R:R allows profitability at lower win rates.
Q: What is the break-even win rate for 1:2 R:R? 33.3%. Any win rate above 33.3% is profitable with a 1:2 R:R. At 1:3 R:R, the break-even win rate drops to 25%. At 1:4 R:R, it drops to 20%. Higher R:R gives you more margin to be wrong and still profit over time.
Q: Is 1:1 risk reward ever acceptable? For scalping only — and only when the win rate consistently exceeds 60%. For most intraday and swing trading strategies, 1:1 is too thin to produce reliable profits after accounting for trading costs, occasional slippage, and the reality that most retail traders cannot maintain 60%+ win rates consistently.
Q: How do I use risk reward ratio with position sizing? Define your R:R first (is the trade worth taking?), then calculate position size based on your per-trade risk amount. Example: if you risk 1% of $100,000 ($1,000) and your stop is $20 away from entry, your position size is $1,000 ÷ $20 = 50 shares. The R:R tells you whether to take the trade; the position size determines how much capital is at stake.
Q: What is a realistic R:R for options buying? For options buying (calls or puts), aim for a minimum of 1:3 to account for Theta decay. Because time value is constantly eroding your premium, you need the move to happen quickly and be large enough to overcome the daily decay. Trades with only a 1:1 or 1:2 R:R in options buying frequently break even or lose even when direction is correct but the move is slow.
Q: How many trades do I need to validate my R:R system? A trader needs a minimum of 50-100 trades to validate whether a specific risk reward ratio and win rate combination produces reliable results. Fewer than 50 trades introduces too much variance. Backtesting across 200+ trades on historical data provides a more reliable foundation, but live forward-testing across at least 50 trades confirms that the backtested results hold under real market conditions.
Final Thoughts
The risk reward ratio is not a magic number. A 1:3 ratio does not make a bad trade good, and a 1:1 ratio does not make a good trade bad. What makes money is pairing a realistic R:R with a verified win rate, proper position sizing, and the discipline to execute the same way on trade 97 as you did on trade 3.
The math in this guide proves one thing definitively: you do not need to win most of your trades to make money. You need your winners to be meaningfully larger than your losers. A 1:3 R:R with a 40% win rate produces +60R over 100 trades — a result that most traders chasing 70%+ win rates will never match.
Define your stop. Define your target. Check the ratio. If it does not meet your minimum, skip the trade. Execute consistently over a large sample. That is the entire formula.
Disclaimer: This blog post is for educational purposes only and does not constitute financial or investment advice. Trading in stocks, derivatives, and forex involves substantial risk of capital loss. The mathematical examples presented assume consistent execution and do not account for real-world variables including commissions, slippage, taxes, and emotional discipline. Past performance of any ratio or strategy does not guarantee future results. Always consult a licensed financial advisor before making investment decisions.
Further reading: Intraday Trading Rules You Must Follow | How Much Capital Is Required for Intraday Trading? | Options Greeks Explained: Delta, Theta, Gamma and Vega Guide | Expiry Day Options Trading Strategy | Options Trade Adjustment Techniques | Best Online Trading Journal | Account Flipping Trading Strategy | 5 Best Intraday Trading Strategies for NSE India
Have a question about this article?
Comment on our latest Instagram post or send us a DM — we reply to every one.
@dhanith_officialWas this article helpful?
Click to rate
Founder, Dhanith Trading
7+ years trading Nifty, Bank Nifty, NSE stocks, and commodities — specializing in Smart Money Concepts (SMC) and ICT price action. Founder of Dhanith — a trading journal, intraday screener, and risk tools platform built for retail traders.
Dhanith Newsletter
Enjoyed this article? Get more like it.
New trading guides, candlestick patterns, SMC strategies, and tool updates — straight to your inbox. Free, for Indian traders.
No spam. Unsubscribe anytime.
Continue Reading