On this page
- Introduction
- What Is the Head and Shoulders Pattern?
- Why the Head and Shoulders Pattern Forms — The Psychology
- Three Types of Necklines — and What Each Signals
- Volume — The Sequence Every Trader Must Know
- How to Identify the Head and Shoulder Pattern: The 5-Step Process
- How to Trade the Head and Shoulders Pattern
- Entry Strategy 1 — Aggressive Entry (Faster, More Risk)
- Entry Strategy 2 — Conservative Retest Entry (Slower, Better R:R)
- Stop Loss Placement
- Measured Move Target
- How to Trade Inverse Head and Shoulders — The Bullish Mirror
- Head and Shoulders Pattern Examples — NSE India, Crypto, and USA
- Example 1 — NSE India: Nifty 50 Daily Chart
- Example 2 — Crypto: Bitcoin (BTC/USDT) Daily Chart
- Common Mistakes — And Exact Fixes
- Final Thoughts
- FAQ
- Related Articles
Master the head and shoulders pattern — structure, neckline, volume, entry, stop loss, and target rules with real examples from NSE India, Bitcoin, and US stocks.
Introduction
Out of all the chart patterns studied across decades of technical analysis, one has consistently produced the clearest, most visually intuitive signal of a trend reversal: the head and shoulders pattern.
It is not the newest pattern. It was first formally documented in the early 20th century. But what makes it remarkable in 2026 is that its reliability has not faded — in fact, it has arguably increased. Because so many different groups pay attention to it — AI pattern recognition tools, High-Frequency Trading algorithms, institutional desks, and individual traders — the pattern remains a reliable sign of a market change precisely because so many different participants act on it simultaneously.
Thomas Bulkowski, a renowned expert on chart patterns, conducted extensive research covering over 2,800 trades and found an 81% success rate for this pattern in predicting a move down after the neckline breaks. His research also shows that a successful breakdown leads to an average price decline of 16%, and 68% of these patterns pull back to test the neckline after the initial break — giving traders a second chance to enter.
This guide covers everything: the complete anatomy of the pattern and why it forms, the three neckline types and what each signals, the exact volume sequence to confirm, two entry strategies, stop loss placement, measured move calculation, the inverse head and shoulders for bullish setups, and three worked examples from NSE India, Bitcoin, and the US market.
What Is the Head and Shoulders Pattern?
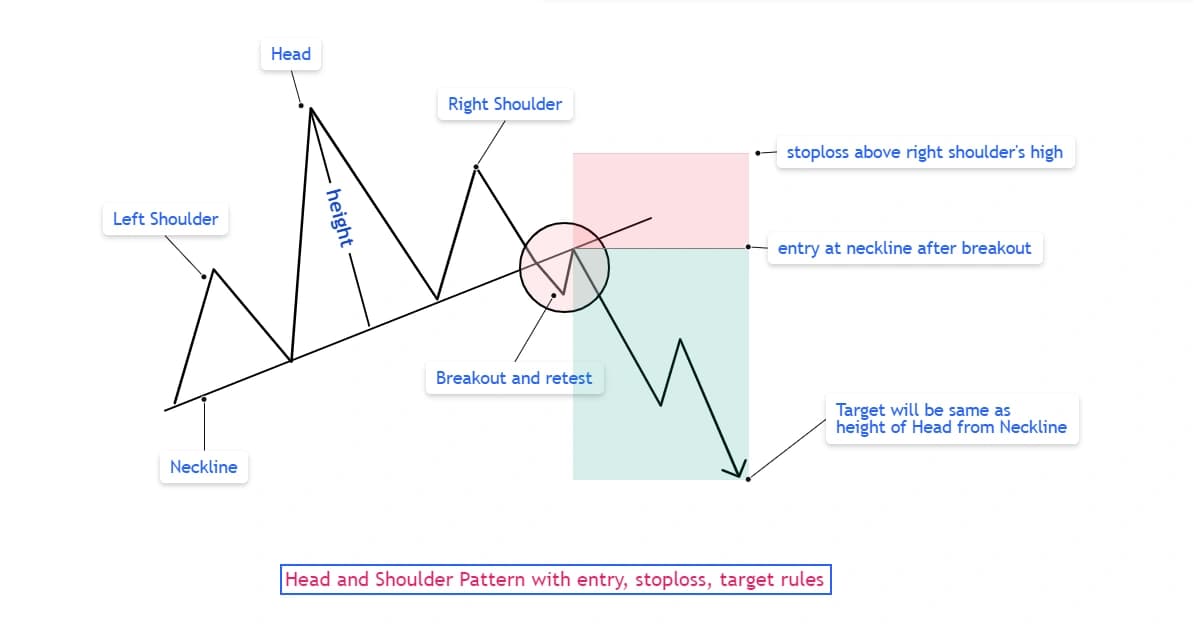
The head and shoulders pattern is a bearish reversal chart formation that appears at the end of an uptrend. It consists of three peaks — a left shoulder, a taller central peak called the head, and a right shoulder at approximately the same height as the left — connected at their bases by a line called the neckline.
The pattern signals that buyers are losing control and sellers are stepping in, often marking the beginning of a significant price decline. When you connect the pullback lows between the peaks, you draw the neckline, which acts as the key support level to watch.
The four components:
1. Left Shoulder: Price rallies to a peak as part of the existing uptrend, then pulls back. At this point, the pattern is not yet identifiable — this looks like a normal bullish impulse-and-correction cycle.
2. The Head: Price rallies again, this time making a new high above the left shoulder's peak — the highest point of the entire pattern — before pulling back to approximately the same support level.
3. Right Shoulder: Price attempts a third rally but only reaches the level of the left shoulder, failing to make a new high. This failed rally is the first concrete, visible evidence that buying pressure is fading and that sellers are increasingly in control.
4. The Neckline: A line connecting the two troughs — the pullback low between the left shoulder and the head, and the pullback low between the head and the right shoulder. This line is the trigger for the trade.
Why the Head and Shoulders Pattern Forms — The Psychology
The whole thing kicks off within an existing uptrend. The left shoulder appears when buyers push the price to a new high, followed by a normal, healthy pullback. Then the head forms — this is the final, over-the-top burst of optimism where buyers shove the price to a peak even higher than the left shoulder. This climax is a classic trap for late-entering traders who assume the trend has plenty of gas left. The drop from this peak is usually much deeper, and it is the first real red flag for the bullish case.
The right shoulder is where the market's true condition becomes undeniable. Buyers try one more time — but they cannot reach the head's high. Each successive peak is weaker than the last. Selling conviction is progressively outpacing buying conviction, even though price has not yet broken any major support level. The neckline is that support level — and when it finally breaks, the shift from buyer control to seller control becomes official.
Three Types of Necklines — and What Each Signals
Most articles show only the horizontal neckline version. Real markets produce three distinct neckline configurations, each with its own implication.
Horizontal Neckline: Both troughs (between left shoulder and head, and between head and right shoulder) form at approximately the same price level. The most classic, textbook version — easiest to identify, cleanest to trade.
Downward-Sloping Neckline: The second trough is lower than the first. A bearish signal becomes stronger when the neckline slopes downward. This indicates that sellers are progressively gaining control, creating lower lows. This version is more aggressively bearish — the market is already making lower lows even before the neckline breaks.
Upward-Sloping Neckline: The second trough is higher than the first. Less common but still valid, this type of neckline signals a reversal too. It can show market indecision, so traders should approach it more carefully. The upward slope means buyers are still managing to push the reaction lows higher, which makes the eventual neckline break slightly more ambiguous — require additional volume or momentum confirmation before entering.
Volume — The Sequence Every Trader Must Know
Volume tells you whether the pattern's psychological narrative is real or manufactured. The correct sequence across the pattern's formation is:
Left shoulder: Elevated volume — consistent with the existing uptrend's buying conviction.
Head: Volume is typically lower than during the left shoulder formation — even though price reaches a new high. This divergence between price and volume is the first quantitative warning sign that buying pressure is weakening.
Right shoulder: Volume is lower still — confirming that each successive rally is attracting fewer buyers.
Neckline breakdown: The most crucial volume signal occurs during the neckline breakout. A significant spike in trading volume as the price breaks the neckline confirms the pattern and indicates strong momentum behind the reversal. If volume does not increase, the breakout might be weak or false, requiring additional confirmation from other indicators like RSI or MACD.
A pattern where the head forms on higher volume than the left shoulder is a weaker, lower-probability setup — it suggests genuine buying interest still exists at the high rather than the expected divergence. Require extra confirmation from momentum indicators before trading this version.
How to Identify the Head and Shoulder Pattern: The 5-Step Process
Step 1 — Confirm the prior uptrend. The pattern only functions as a reversal if there is a meaningful uptrend to reverse. One common rule is that the uptrend heading into the pattern should be at least twice as long as the distance between the shoulders.
Step 2 — Identify the three peaks. The head must be clearly the tallest. The left and right shoulders should be at roughly comparable heights — significant asymmetry between the shoulders weakens the pattern's reliability.
Step 3 — Draw the neckline. Connect the two troughs with a straight line. The neckline does not have to be perfectly horizontal — upward or downward sloping versions are valid, each with the implications described above.
Step 4 — Check the volume sequence. Confirm that volume is declining across the three peaks and that the eventual neckline break is accompanied by a clear expansion in volume.
Step 5 — Wait for the neckline break. The pattern is not confirmed until price closes below the neckline on expanding volume. Entering a trade before the neckline has definitively broken is one of the most common mistakes traders make with this pattern.
How to Trade the Head and Shoulders Pattern
Entry Strategy 1 — Aggressive Entry (Faster, More Risk)
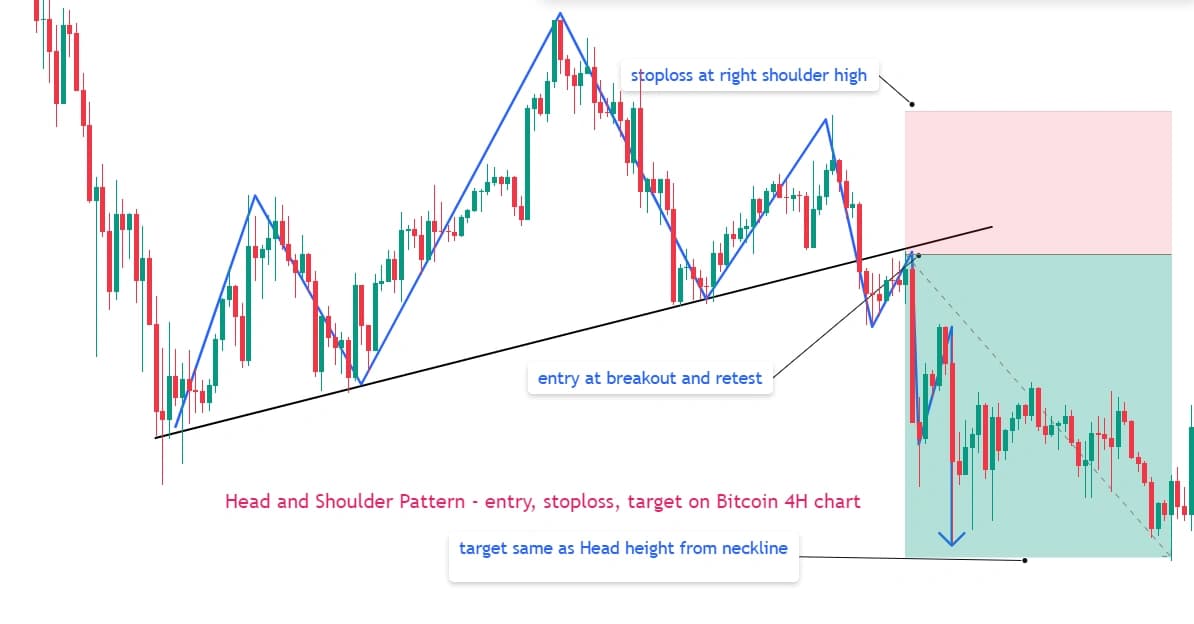
Enter a short position immediately when price closes below the neckline on a candle with above-average volume. This approach captures the maximum possible move from the breakdown but carries higher exposure to false breakouts — where price briefly closes below the neckline before recovering above it.
Entry Strategy 2 — Conservative Retest Entry (Slower, Better R:R)
68% of head and shoulders patterns pull back to test the neckline after the initial break. This makes the retest entry a highly practical, frequently available strategy. Wait for the initial breakdown, then wait for price to rally back toward the broken neckline (now acting as resistance). Enter short when price touches this retest level and shows a rejection — a bearish candlestick, a failed push above the neckline, followed by renewed downward momentum.
The retest entry offers a tighter stop loss and meaningfully better risk-reward than the aggressive entry, at the cost of missing the approximately 32% of patterns that break down sharply without offering a clean retest.
Stop Loss Placement
Conservative (above right shoulder): Place the stop just above the right shoulder's peak. This gives the trade room to survive the typical post-breakdown volatility, including the 68% retest scenario, without being prematurely stopped out.
Aggressive (above neckline after retest): If using the retest entry, place the stop just above the neckline level at the point of rejection. This is tighter but only suitable when the retest rejection is clean and unambiguous.
Measured Move Target
Pattern Height = Head's Peak − Neckline level (directly below the head)

Target = Neckline Breakout Price − Pattern Height
For example, if the peak of the head is at 1.1500 and the neckline is at 1.1200, then the distance is 300 pips. Subtract this distance from the price where the neckline breaks to get the target.
51% of patterns go on to fully reach their measured price targets. This is an important and honest statistic — it means roughly half of valid patterns do not reach the full target. Consider taking partial profits (50% of the position) at 50–60% of the measured move, then trailing the remainder toward the full target.
How to Trade Inverse Head and Shoulders — The Bullish Mirror
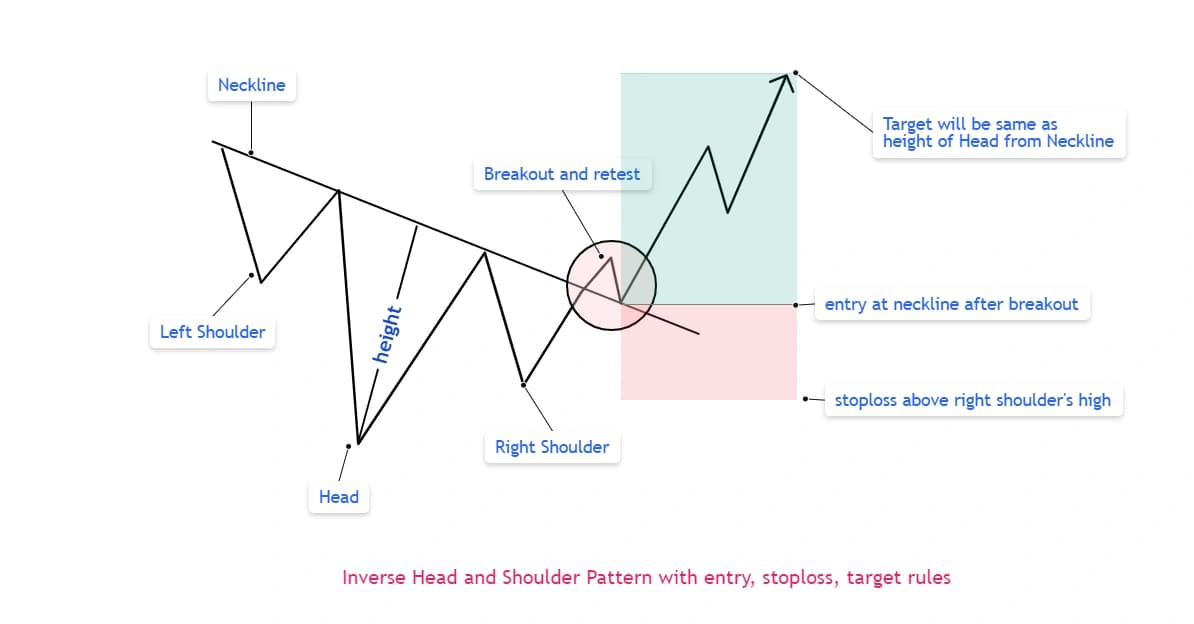
The inverse head and shoulders (also called head and shoulders bottom) is the exact bearish mirror of the standard pattern. It forms after a downtrend and signals a reversal to the upside.
Structure: Three troughs — a left shoulder trough, a lower middle trough (the head, the deepest point), and a right shoulder trough at approximately the same depth as the left shoulder. The neckline connects the two peaks (reaction highs) between the troughs. A close above the neckline on expanding volume confirms the bullish reversal.
Target calculation for the inverse:
Pattern Height = Neckline level − Head's Trough

Target = Neckline Breakout Price + Pattern Height
Stop loss: Below the right shoulder's trough (the mirror of placing a stop above the right shoulder in the standard bearish version).
Everything else — the volume sequence, the two entry approaches, the 68% retest statistic — applies identically in reverse for the bullish inverse version.
Head and Shoulders Pattern Examples — NSE India, Crypto, and USA
Example 1 — NSE India: Nifty 50 Daily Chart
A large-cap NSE stock has been in an uptrend from ₹1,100 to ₹1,580 over four months.
Left shoulder: Price rallies to ₹1,580, pulls back to ₹1,490. Head: Price rallies to ₹1,640 (new high), pulls back to ₹1,495 on lower volume than the left shoulder rally. Right shoulder: Price rallies to ₹1,570 — below the head's ₹1,640 high — and pulls back. Volume on this third rally is the lowest of the three peaks.
The neckline connects ₹1,490 and ₹1,495 — approximately flat, a clean horizontal neckline at ₹1,492.
Price closes below ₹1,492 on a session with volume 2.1x the 50-day average. Three sessions later, price retests ₹1,492 from below (the 68% retest scenario), showing a bearish engulfing candle at that level.
Retest Entry (short):   ₹1,491
Stop Loss:              ₹1,575 (above right shoulder)
Risk per share:         ₹84

Pattern Height:         ₹1,640 − ₹1,492 = ₹148
Target:                 ₹1,492 − ₹148 = ₹1,344

Reward per share:       ₹1,491 − ₹1,344 = ₹147
Risk-Reward:            ₹147 ÷ ₹84 = 1.75:1 (conservative target)
Conservative target:    ₹1,400 (50% of measured move)
R:R at conservative:    ₹91 ÷ ₹84 = 1.08:1 — exit half here,
                        trail rest to full target
VWAP note: On the retest session, the stock also failed to reclaim VWAP on the rally back to ₹1,492. The combination of neckline-as-resistance and VWAP-as-resistance on the same session produced a high-conviction short entry — both structural and institutional bias aligned bearish simultaneously.
Example 2 — Crypto: Bitcoin (BTC/USDT) Daily Chart
Bitcoin has been trending from $48,000 to $71,500 over six weeks — a clear, sustained prior uptrend.
Left shoulder: BTC reaches $71,500, pulls back to $64,200. Head: BTC pushes to $78,000 (new high) on the daily chart, then pulls back to $64,800. Volume on the head's rally is noticeably lower than on the left shoulder rally — the key divergence signal. Right shoulder: BTC rallies to $70,800 — meaningfully below the head's $78,000 — and pulls back. Volume on this third rally is the lowest of the three.
Neckline: connecting $64,200 and $64,800 — slightly upward sloping, around $64,500 average. Treat with additional caution given the upward slope; require strong volume on the break.
Price closes at $63,800 on a session with volume 2.4x the 20-day average.
Aggressive Entry (short): $63,800
Stop Loss:                $71,200 (above right shoulder)
Risk:                     $7,400

Pattern Height:           $78,000 − $64,500 = $13,500
Target:                   $64,500 − $13,500 = $51,000

Reward:                   $63,800 − $51,000 = $12,800
Risk-Reward:              $12,800 ÷ $7,400 = 1.73:1

Conservative target:      $58,550 (50% of measured move)
R:R at conservative:      $5,250 ÷ $7,400 = 0.71:1
— Better to use retest entry to improve ratio
Crypto-specific note: In crypto markets, the right shoulder frequently forms on significantly lower volume than the head — sometimes dramatically so — due to retail FOMO exhaustion. When the right shoulder volume is less than 40% of the head's volume, the bearish conviction behind the pattern is particularly strong. This BTC example showed right shoulder volume at approximately 35% of head volume — a high-confidence signal.
Common Mistakes — And Exact Fixes
Mistake 1 — Entering before the neckline breaks. Entering a trade before the neckline has definitively broken is one of the most common mistakes traders make. The right shoulder can extend, the pattern can fail before completing, or a new high above the head can invalidate the entire setup. Fix: Only enter after a full candle closes below the neckline with above-average volume.
Mistake 2 — Stop loss too close to entry. Placing a stop-loss order too close to the entry point is a consistently common mistake. Normal post-breakdown volatility — including the 68% neckline retest — can trigger an overly tight stop before the real move begins. Fix: Use the right shoulder's peak as the stop reference, not an arbitrary percentage or a few points above the neckline.
Mistake 3 — Treating every three-peak formation as valid. Assuming any formation with three peaks is a valid head and shoulders pattern is a frequent error. The head must be clearly the highest point. The shoulders must be roughly symmetrical. The neckline must be clearly drawable. Fix: Apply all five identification steps before trading any potential setup.
Mistake 4 — Ignoring volume on the neckline break. A neckline close on thin volume frequently represents a false breakout. Fix: Require the breakdown candle's volume to be visibly above the recent average — ideally 1.5–2x the 20-period average — before committing to the short position.
Mistake 5 — Targeting the full measured move on every trade. Only 51% of valid patterns reach their full measured target. Fix: Scale out — take half the position off at 50–60% of the measured move, trail the rest. This ensures profitability even on patterns that partially work but do not reach the full projection.
Final Thoughts
The head and shoulders pattern earns its 81% documented success rate not because of the shape itself, but because of what the shape represents: a market that has made three consecutive attempts to push higher, with each attempt drawing less conviction and less volume than the last, until the support level that held twice finally breaks under the weight of accumulated selling pressure.
Three rules to carry forward:
1. The neckline break is the only valid entry trigger. Every impulse to enter early — at the right shoulder, before the break — adds risk without adding edge. The pattern is not confirmed until the neckline closes.
2. The 68% retest statistic is your ally. Most traders fear missing the breakdown and enter the aggressive entry only to be stopped out by the retest rally. Knowing that 68% of patterns retest the neckline turns that retest from a threat into an opportunity — specifically, a tighter-stop, better-R:R entry for patient traders.
3. Only 51% reach the full target — scale out. Taking partial profits at 50–60% of the measured move is not giving up upside — it is consistently profitable risk management on a pattern that, despite its high success rate, fails to reach its full target approximately half the time.
Disclaimer: This blog is for educational purposes only and is not investment advice. Trading involves substantial risk of capital loss. Past performance of any pattern does not guarantee future results. Always use appropriate stop-loss orders and position sizing before entering any trade.
FAQ
Q: What is the head and shoulders pattern? The head and shoulders pattern is a bearish reversal chart formation that appears at the end of an uptrend, consisting of three peaks — a left shoulder, a taller central head, and a right shoulder at approximately the left shoulder's height — connected at their troughs by a neckline. When price closes below the neckline on expanding volume, the pattern signals the uptrend has reversed and a meaningful decline is likely. Research by Thomas Bulkowski across 2,800+ trades found an 81% success rate for this pattern.
Q: How do you draw the neckline for a head and shoulders pattern? Connect the two troughs between the peaks — the pullback low between the left shoulder and the head, and the pullback low between the head and the right shoulder — with a single straight line. This neckline can be horizontal, upward-sloping, or downward-sloping. A downward-sloping neckline signals stronger bearish conviction; an upward-sloping neckline is valid but requires additional confirmation before trading.
Q: What is the best entry strategy for a head and shoulders trade? There are two valid approaches. The aggressive entry enters short immediately when price closes below the neckline on high volume. The conservative retest entry waits for price to rally back and touch the broken neckline from below — where it now acts as resistance — and enters short on a rejection candle at that level. The retest entry offers a tighter stop and better risk-reward. Since 68% of patterns retest the neckline after the initial break, this entry is frequently available.
Q: How do you calculate the price target for a head and shoulders pattern? Measure the pattern height — the vertical distance from the head's peak down to the neckline directly below it. Subtract this distance from the price at which the neckline breaks. For example, if the head is at ₹1,640 and the neckline is at ₹1,492, the pattern height is ₹148. If the neckline breaks at ₹1,492, the target is ₹1,344. Note that only 51% of valid patterns reach the full measured target — consider scaling out at 50–60% of the move.
Q: What is the inverse head and shoulders pattern? The inverse head and shoulders is the exact bullish mirror of the standard pattern. It forms after a downtrend, consisting of three troughs — a left shoulder trough, a deeper central head trough, and a right shoulder trough at approximately the left shoulder's depth. The neckline connects the two reaction highs between the troughs. A close above the neckline on expanding volume signals a bullish reversal. The measured move target is calculated by adding the pattern height to the neckline breakout price.
Q: Does the head and shoulders pattern work on crypto and NSE stocks? Yes — the head and shoulders pattern appears across all liquid, actively traded markets including NSE stocks, Bitcoin, and US equities, with the same identification rules applying in each. For crypto specifically, right shoulder volume being significantly lower than head volume (below 40% of head volume) is a particularly reliable additional signal. For NSE daily chart setups, combining the neckline break with a simultaneous VWAP breakdown produces a stronger, higher-confidence entry than the price structure signal alone.
Related Articles
- Cup and Handle Pattern: How to Identify and Trade It — Bullish continuation counterpart to this bearish reversal
- Flag and Pole Pattern: How to Identify and Trade It — Another continuation pattern, useful contrast with this reversal setup
- Pennant Pattern: How to Identify Bull & Bear Pennant — Another continuation pattern, useful contrast with this reversal setup
Have a question about this article?
Comment on our latest Instagram post or send us a DM — we reply to every one.
@dhanith_officialWas this article helpful?
Click to rate
Founder, Dhanith Trading
7+ years trading Nifty, Bank Nifty, NSE stocks, and commodities — specializing in Smart Money Concepts (SMC) and ICT price action. Founder of Dhanith — a trading journal, intraday screener, and risk tools platform built for retail traders.
Dhanith Newsletter
Enjoyed this article? Get more like it.
New trading guides, candlestick patterns, SMC strategies, and tool updates — straight to your inbox. Free, for Indian traders.
No spam. Unsubscribe anytime.
Continue Reading