On this page
- Introduction
- Part 1: What Is RSI? — The Complete Foundation
- The Origin — J. Welles Wilder
- The Formula — What RSI Actually Calculates
- The Three Key Zones
- The 50 Midline — The Most Important Level
- Part 2: RSI Settings — Which Period to Use
- RSI Settings by Trading Style
- Adjusting for Market Volatility
- Part 3: The Four RSI Signals — Complete Breakdown
- Signal 1 — Overbought/Oversold Zones (Context-Dependent)
- Signal 2 — Centerline Crossover (Momentum Shift)
- Signal 3 — Regular Divergence (Reversal Warning)
- Signal 4 — Hidden Divergence (Continuation Signal)
- Part 4: How to Set Up RSI on Your Charts
- TradingView (Recommended)
- Adding the 50 Midline Manually
- Zerodha Kite Setup
- Part 5: Five Complete RSI Trading Strategies
- Strategy 1 — RSI Oversold Bounce (Support Zone Entry)
- Strategy 2 — RSI + Candlestick Pattern Combination (Confluence Entry)
- Strategy 3 — RSI Divergence Strategy (Early Reversal Detection)
- Strategy 4 — RSI Centerline Cross Strategy (Trend Following)
- Strategy 5 — RSI + VWAP Strategy (NSE Intraday)
- Part 6: RSI Settings for Different NSE Instruments
- Nifty 50 and Nifty Futures
- Bank Nifty
- Individual NSE Stocks
- Part 7: RSI Mistakes and Exact Fixes
- Mistake 1 — Selling Every RSI Above 70
- Mistake 2 — Buying Every RSI Below 30
- Mistake 3 — Acting on Divergence Without Confirmation
- Mistake 4 — Using RSI Alone (No Other Confluence)
- Mistake 5 — Using the Wrong Period for the Timeframe
- Mistake 6 — Ignoring the 50 Midline
- Part 8: RSI — Trending vs. Ranging Markets
- FAQ
- Conclusion
- Ready to Trade These Signals on Real Stocks?

RSI Trading Strategy: The Complete Guide for Stock Traders (2026)
Master RSI trading strategies in 2026. Learn RSI settings, overbought/oversold rules, bullish & bearish divergence, the 50 centerline strategy, and RSI + VWAP + candlestick combinations — with real NSE examples.
Introduction
If you have been trading for any amount of time, you have almost certainly added RSI to your chart. The Relative Strength Index is arguably the most widely used technical indicator in the world — appearing on the charts of day traders, swing traders, and institutional analysts alike.
But here is the problem most traders encounter: they add RSI, see the reading hit 70, and immediately think "overbought, time to sell." Or they watch it drop to 30 and buy without hesitation. Then they get stopped out when the "overbought" stock continues rallying for three more weeks — or the "oversold" stock drops another 15%.
RSI above 70 signals strong bullish momentum, not a reversal. In strong uptrends, the best moves happen while RSI is above 70. A trader shorting every overbought print would have stepped in front of one of the strongest moves of the year and stopped out on every entry.
This is the most expensive RSI mistake beginners make — and it stems from a fundamental misunderstanding of what RSI actually measures.
RSI measures momentum, not overbought or oversold conditions in absolute terms. High RSI signals that buyers have been consistently stronger than sellers over the measured period. Low RSI signals that sellers have been consistently stronger. Whether that extreme reading represents an opportunity or a warning depends entirely on the market context — trend direction, key levels, and what the indicator is doing relative to price.
This guide fixes that misunderstanding completely. You will learn what RSI actually measures, how to read it correctly in trending and ranging markets, the four types of divergence, five complete trading strategies using RSI, the best settings for day trading and swing trading on NSE stocks, and every common mistake with exact fixes.
TL;DR — Key Takeaways
- RSI (Relative Strength Index) measures momentum on a 0–100 scale — it does NOT directly mean "overbought" or "oversold" in all conditions
- RSI above 70 in a strong uptrend means powerful bullish momentum — do NOT automatically short it
- RSI below 30 in a strong downtrend means powerful bearish momentum — do NOT automatically buy it
- The 50 midline is the most important level — above 50 = bullish bias, below 50 = bearish bias
- The four RSI signals: overbought/oversold zones, centerline crossover, regular divergence (reversal warning), hidden divergence (continuation signal)
- Best settings: 14-period for daily/swing trading; 9-period for intraday; 21-period for position trading
- Five strategies: Oversold Bounce, RSI + Candlestick Pattern, RSI Divergence, RSI Centerline Cross, RSI + VWAP (NSE intraday)
- Never enter on RSI alone — always require price action confirmation (candlestick pattern, structure break, or VWAP interaction)
Part 1: What Is RSI? — The Complete Foundation
The Origin — J. Welles Wilder
The Relative Strength Index was developed by J. Welles Wilder and introduced in his 1978 book New Concepts in Technical Trading Systems. Despite being 45+ years old, RSI remains the most widely used momentum oscillator in modern trading — a testament to how precisely it captures one of the most fundamental aspects of market behaviour: the relative strength of buyers versus sellers over a defined period.
The Formula — What RSI Actually Calculates
RSI is calculated from average gains versus average losses over a defined period (default: 14):
Step 1: Calculate Average Gain and Average Loss
Average Gain = Sum of gains over N periods ÷ N
Average Loss = Sum of losses over N periods ÷ N

Step 2: Calculate Relative Strength (RS)
RS = Average Gain ÷ Average Loss

Step 3: Calculate RSI
RSI = 100 - (100 ÷ (1 + RS))
The result is a number between 0 and 100:
- RSI of 100: Every period in the window was an up period — maximum buyer dominance
- RSI of 0: Every period was a down period — maximum seller dominance
- RSI of 50: Buyers and sellers have been exactly equal — perfect equilibrium
The Three Key Zones
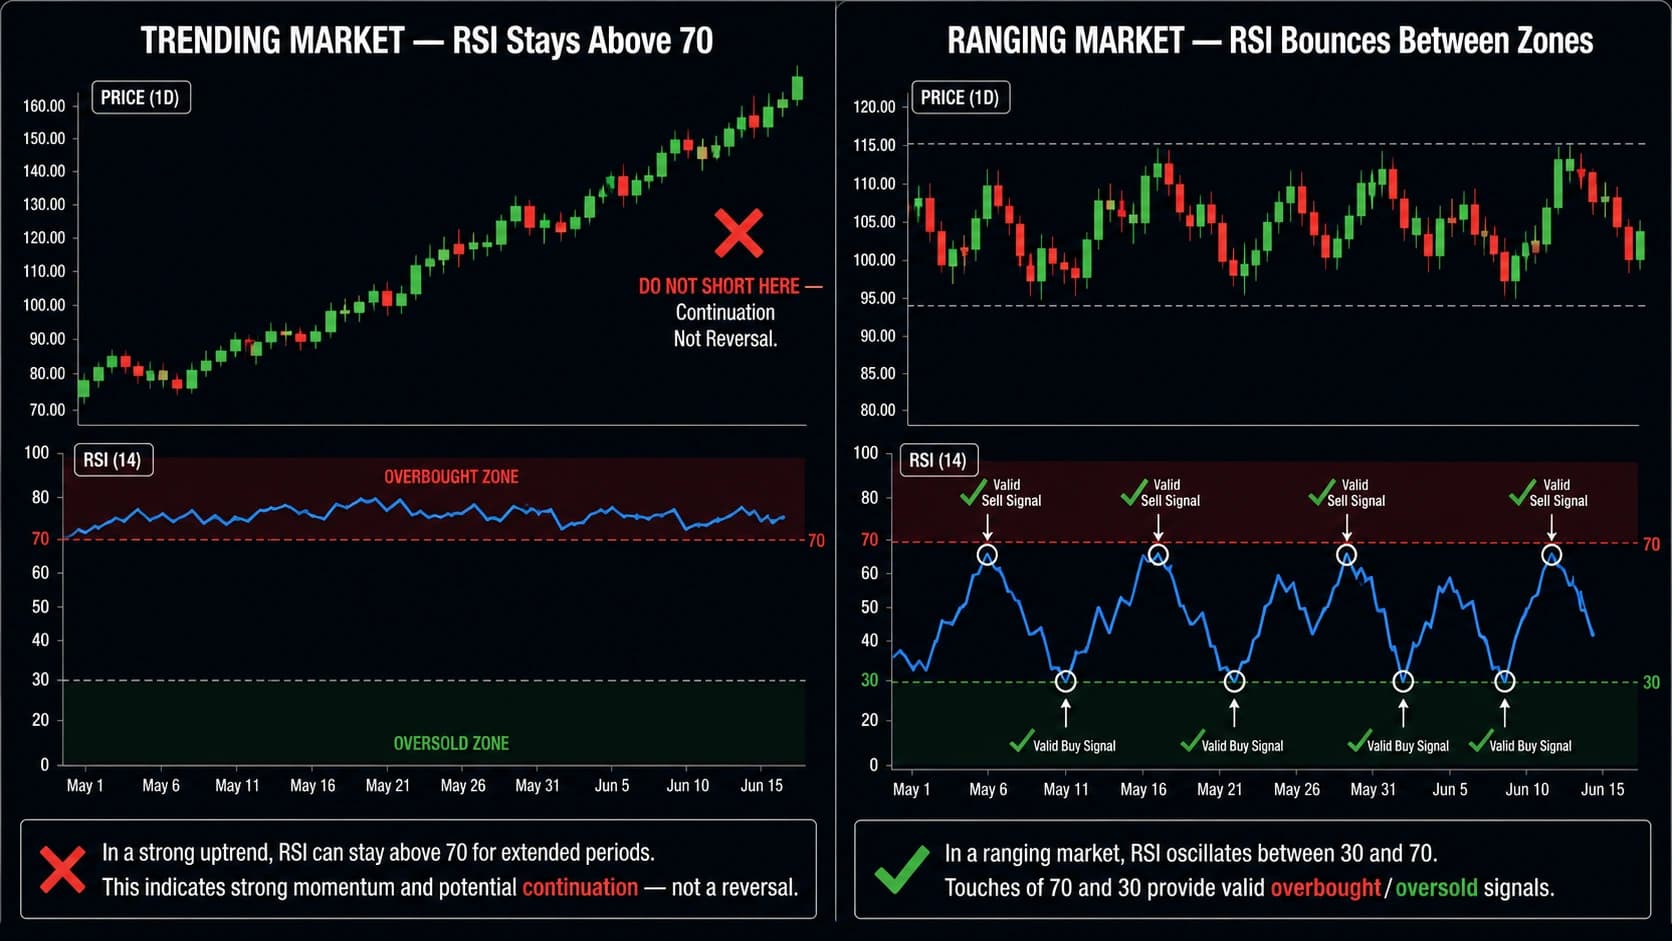
Zone 1 — Overbought (Above 70): Buyers have been significantly stronger than sellers over the measured period. The word "overbought" is misleading — it does not mean the price is too high or must reverse. It means buying momentum is strong. In a trending market, RSI can remain above 70 for extended periods. In a ranging market, RSI above 70 near resistance often precedes a reversal.
Zone 2 — Oversold (Below 30): Sellers have been significantly stronger than buyers. "Oversold" similarly does not guarantee a reversal — in strong downtrends, RSI can stay below 30 for weeks. In ranging markets, RSI below 30 near support often precedes a bounce.
Zone 3 — Neutral (30–70): The most common zone. Neither buyers nor sellers are at an extreme. Within this zone, the 50 midline is the critical dividing line.
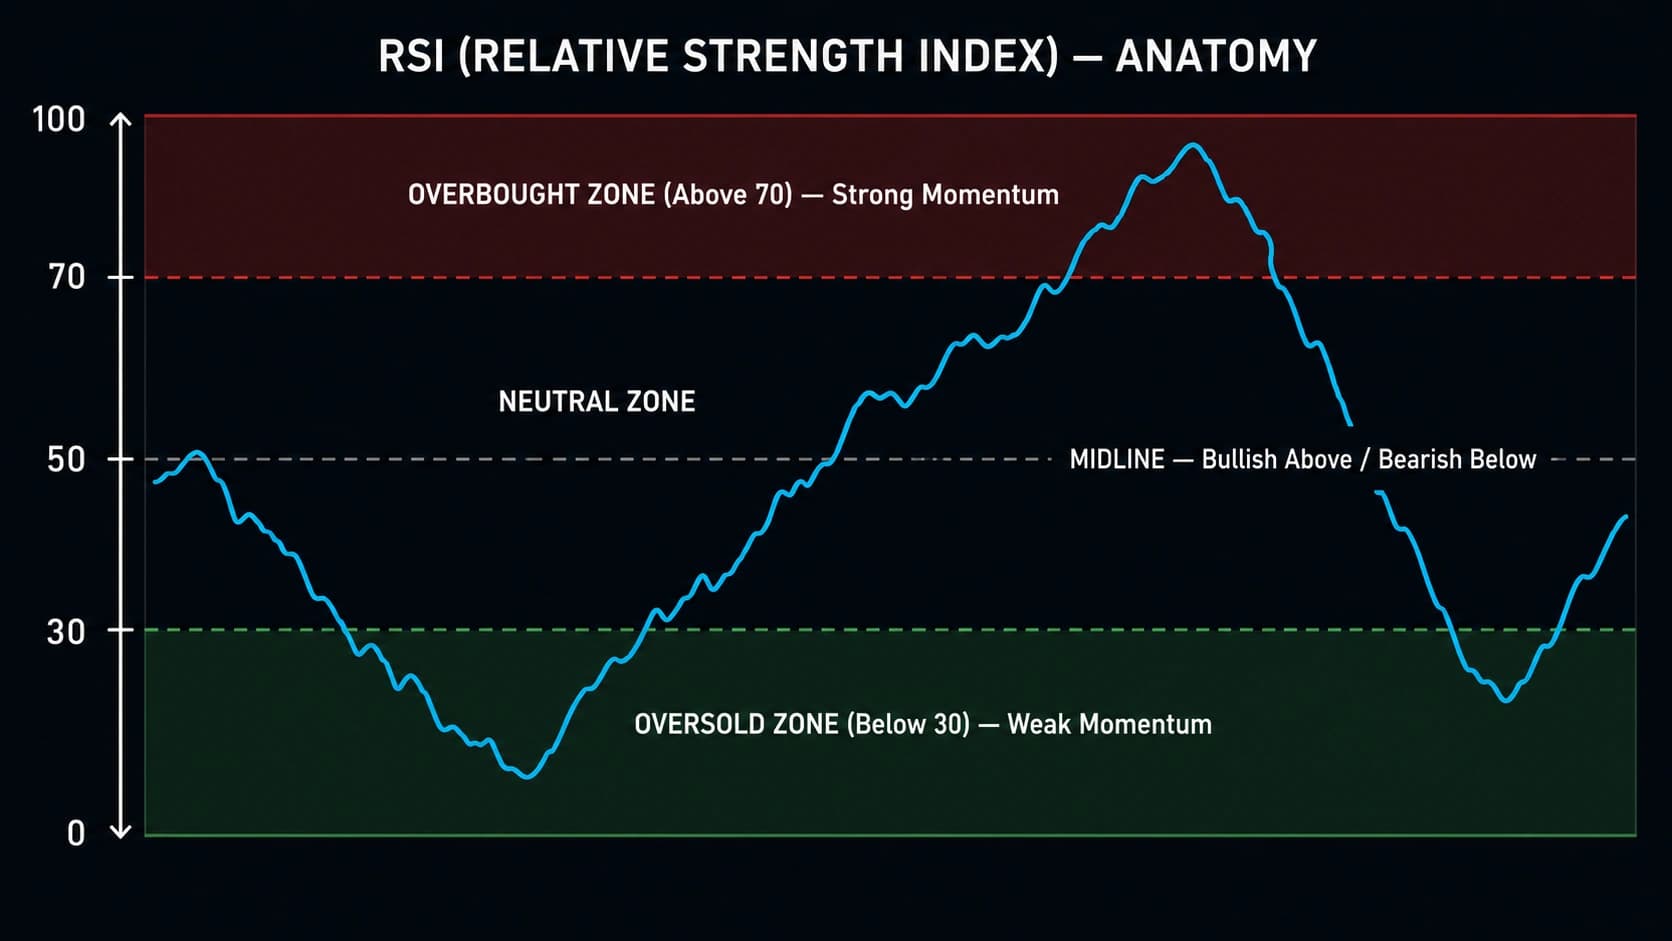
The 50 Midline — The Most Important Level
The 50 midline is the most important level on the indicator. RSI above 50 signals bullish control, below 50 signals bearish control.
Many traders overlook the 50 midline in favour of the extreme zones (70 and 30). This is a mistake. The 50 level provides the directional bias filter that makes the extreme readings meaningful:
- RSI above 50 and rising: Bullish momentum — look for long setups
- RSI below 50 and falling: Bearish momentum — look for short setups
- RSI crossing above 50: Shift in momentum from bearish to bullish — potential long entry signal
- RSI crossing below 50: Shift in momentum from bullish to bearish — potential short entry signal
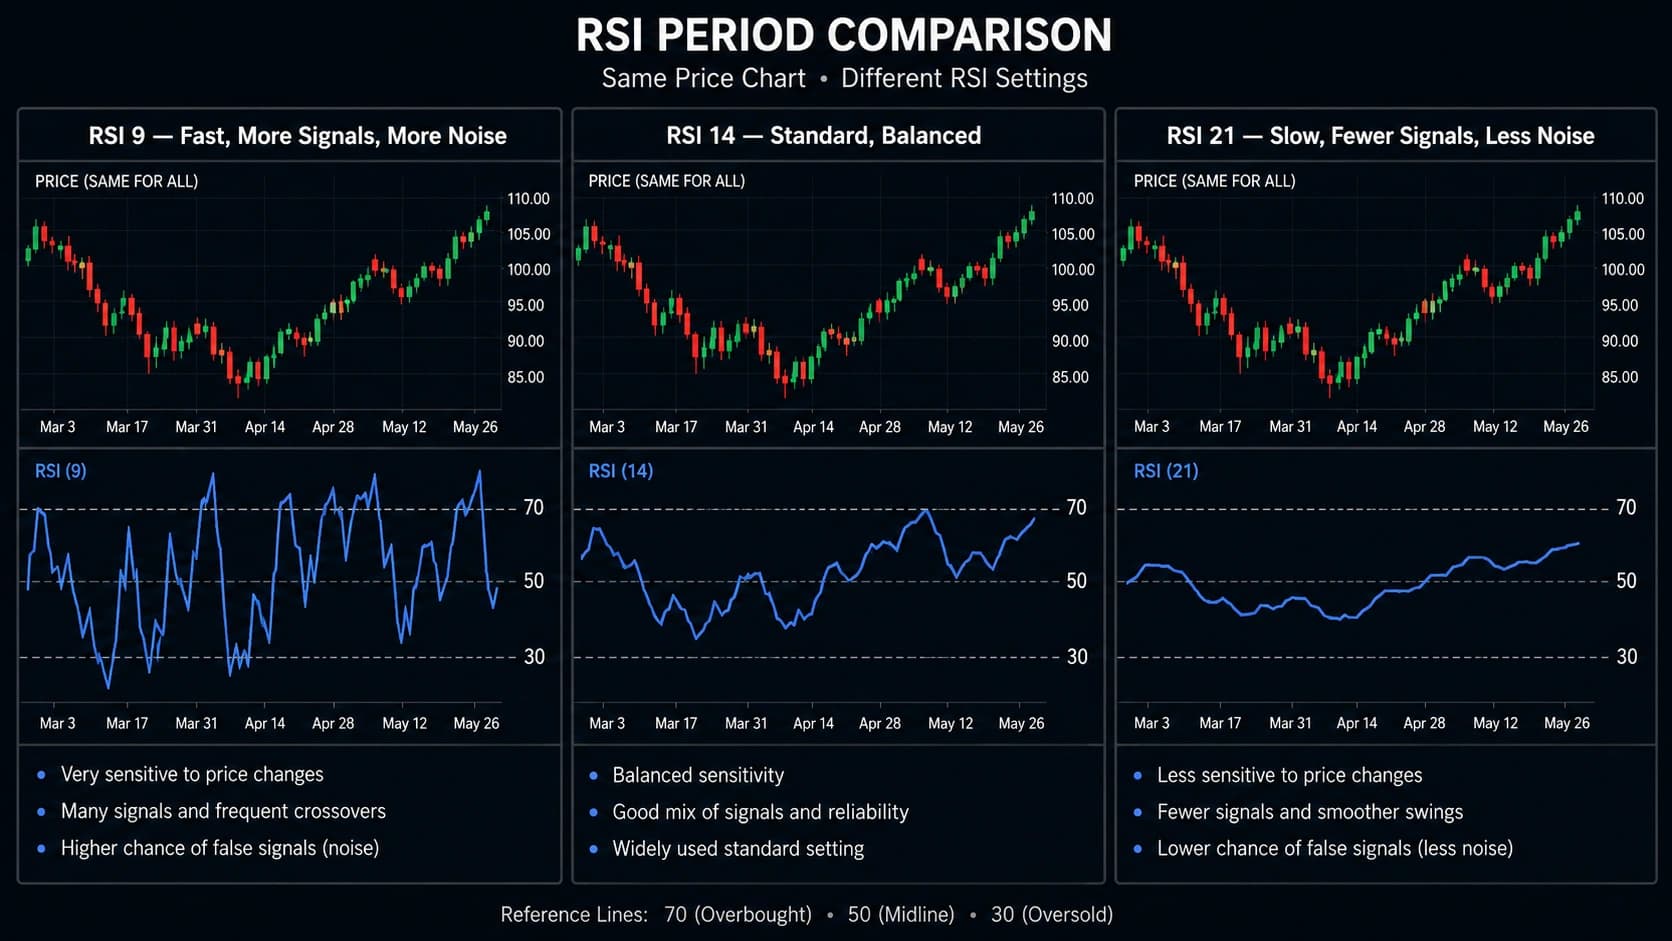
Part 2: RSI Settings — Which Period to Use
The default RSI setting of 14 periods is the most widely used and the most broadly applicable. But the right setting depends on your trading style:
RSI Settings by Trading Style
| Trading Style | Recommended Period | Sensitivity | Best For |
|---|---|---|---|
| Scalping (1–5 min) | RSI 2–7 | Very High | Quick momentum shifts |
| Day Trading (5–15 min) | RSI 9–14 | High | Intraday setups |
| Swing Trading (Daily) | RSI 14 | Standard | Classic setups |
| Position Trading (Weekly) | RSI 21–25 | Low | Trend confirmation |
For 5-minute charts on NSE: Use RSI 9 or RSI 14. RSI 9 is more responsive to intraday moves; RSI 14 is the institutional standard.
For daily charts on NSE (Nifty 50, Bank Nifty): Use RSI 14. Nifty and Bank Nifty on daily charts with RSI 14 have historically provided good entry signals for swing traders.
The 80/20 variant: Some strategies use extreme thresholds of 80 and 20 (instead of 70 and 30). The logic: waiting for RSI to reach 80 or 20 before acting produces fewer signals but more reliable ones — the extreme reading represents a more significant momentum push. For high-volatility instruments like Bank Nifty, using 80/20 thresholds reduces false signals significantly.
Adjusting for Market Volatility
For high volatility futures or fast-moving stocks: set bands to 80 and 20 to cut false signals. For strong trending markets, tighten to 60 and 40 to catch pullbacks that continue the trend.
The takeaway: there is no universally "correct" RSI setting. The setting should be matched to the instrument's volatility and your trading timeframe.
Part 3: The Four RSI Signals — Complete Breakdown
Signal 1 — Overbought/Oversold Zones (Context-Dependent)
In a ranging market: RSI reaching above 70 near resistance is a valid warning signal. RSI dropping below 30 near support is a valid bounce signal. In ranges, the extreme zones have genuine predictive value because price is mean-reverting — it will return to the middle of the range.
In a trending market: RSI above 70 in an uptrend is a continuation signal, not a reversal. The correct interpretation is: "Strong buyer momentum is present — look for pullback entries when RSI eases back to 50–60, not for short positions." RSI below 30 in a downtrend is continuation, not reversal.
The regime test: Before using RSI overbought/oversold signals, identify the market regime. Is the stock trending (above 200 SMA, making higher highs) or ranging? This single filter determines whether the extreme reading is a reversal warning or a momentum confirmation.
Signal 2 — Centerline Crossover (Momentum Shift)
RSI crossing above 50 from below = bullish momentum shift. RSI crossing below 50 from above = bearish momentum shift.
Many trading strategies regard RSI crossing above the 50 line from below as a buy signal, while breaking below the 50 line from above is considered a sell signal.
The centerline crossover is particularly useful as a trend filter — only taking long setups when RSI is above 50 (bullish momentum confirmed) and only taking short setups when RSI is below 50 (bearish momentum confirmed). This eliminates a significant percentage of counter-momentum trades.
For NSE intraday traders: RSI above 50 on the 5-minute chart confirms the bullish session bias. RSI below 50 on the 5-minute chart confirms the bearish session bias. Align all your entries with the 50-level direction.
Signal 3 — Regular Divergence (Reversal Warning)
Regular divergence is the disagreement between price direction and RSI direction. It signals that the current trend is losing momentum — the moves in the trend direction are becoming progressively weaker.
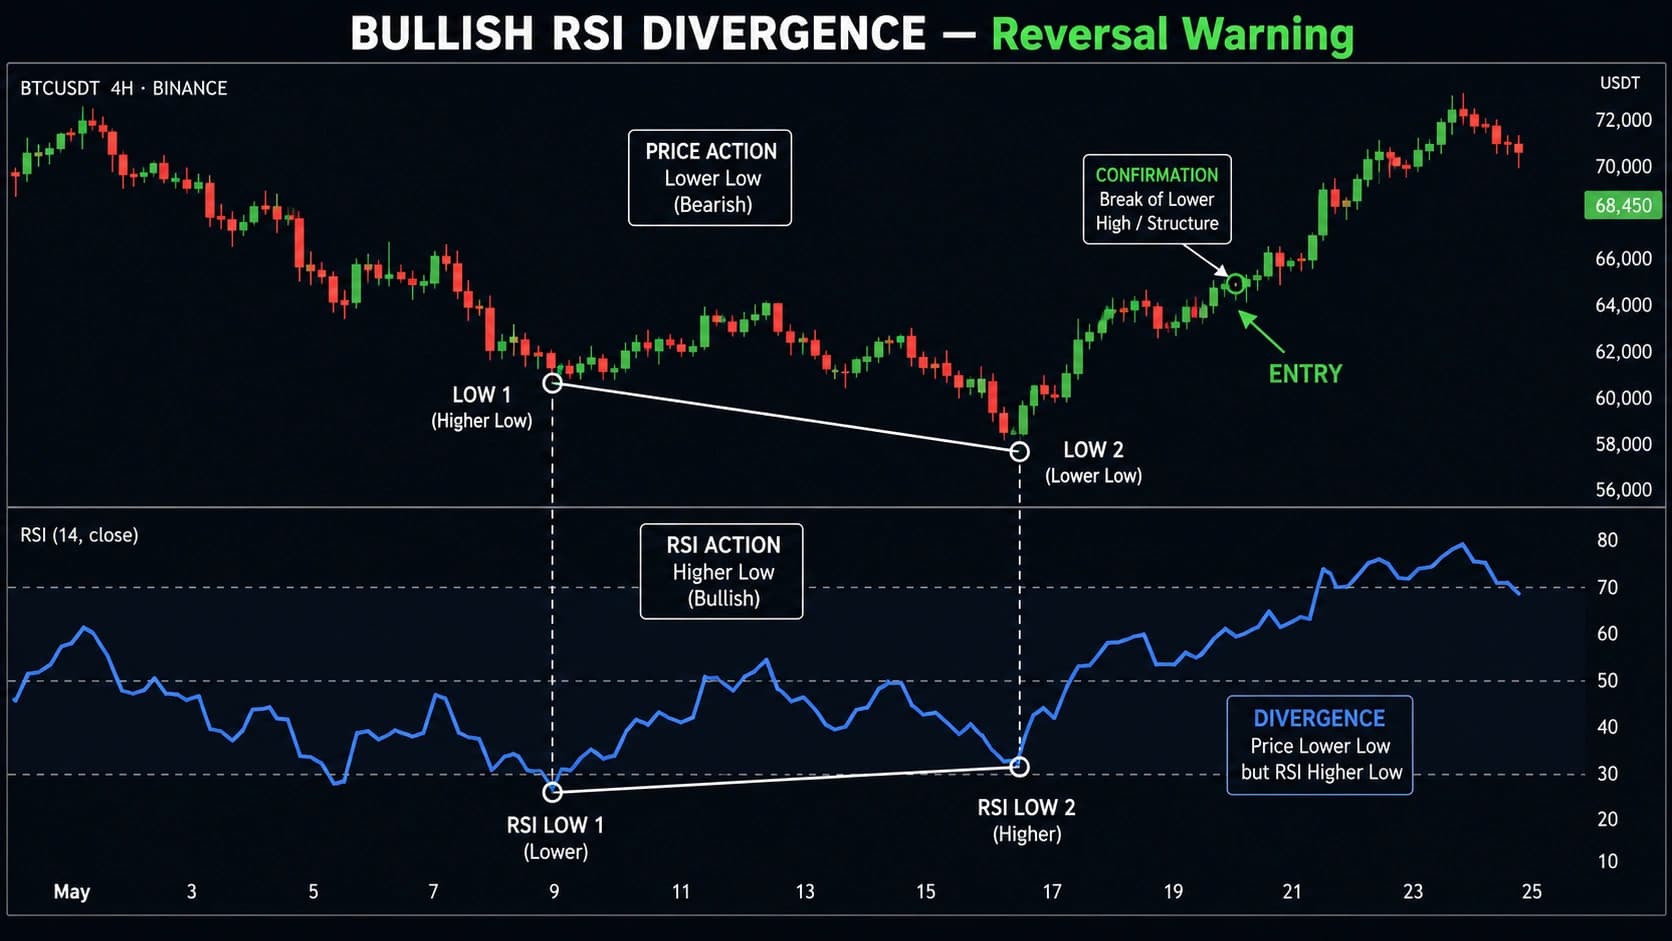
Bullish Regular Divergence:
- Price makes a lower low (new price extreme to the downside)
- RSI makes a higher low (RSI does not confirm the new price low)
- Meaning: Sellers made a new low in price but couldn't generate the same selling momentum as before. Selling is exhausting.
- Signal: Potential bullish reversal approaching
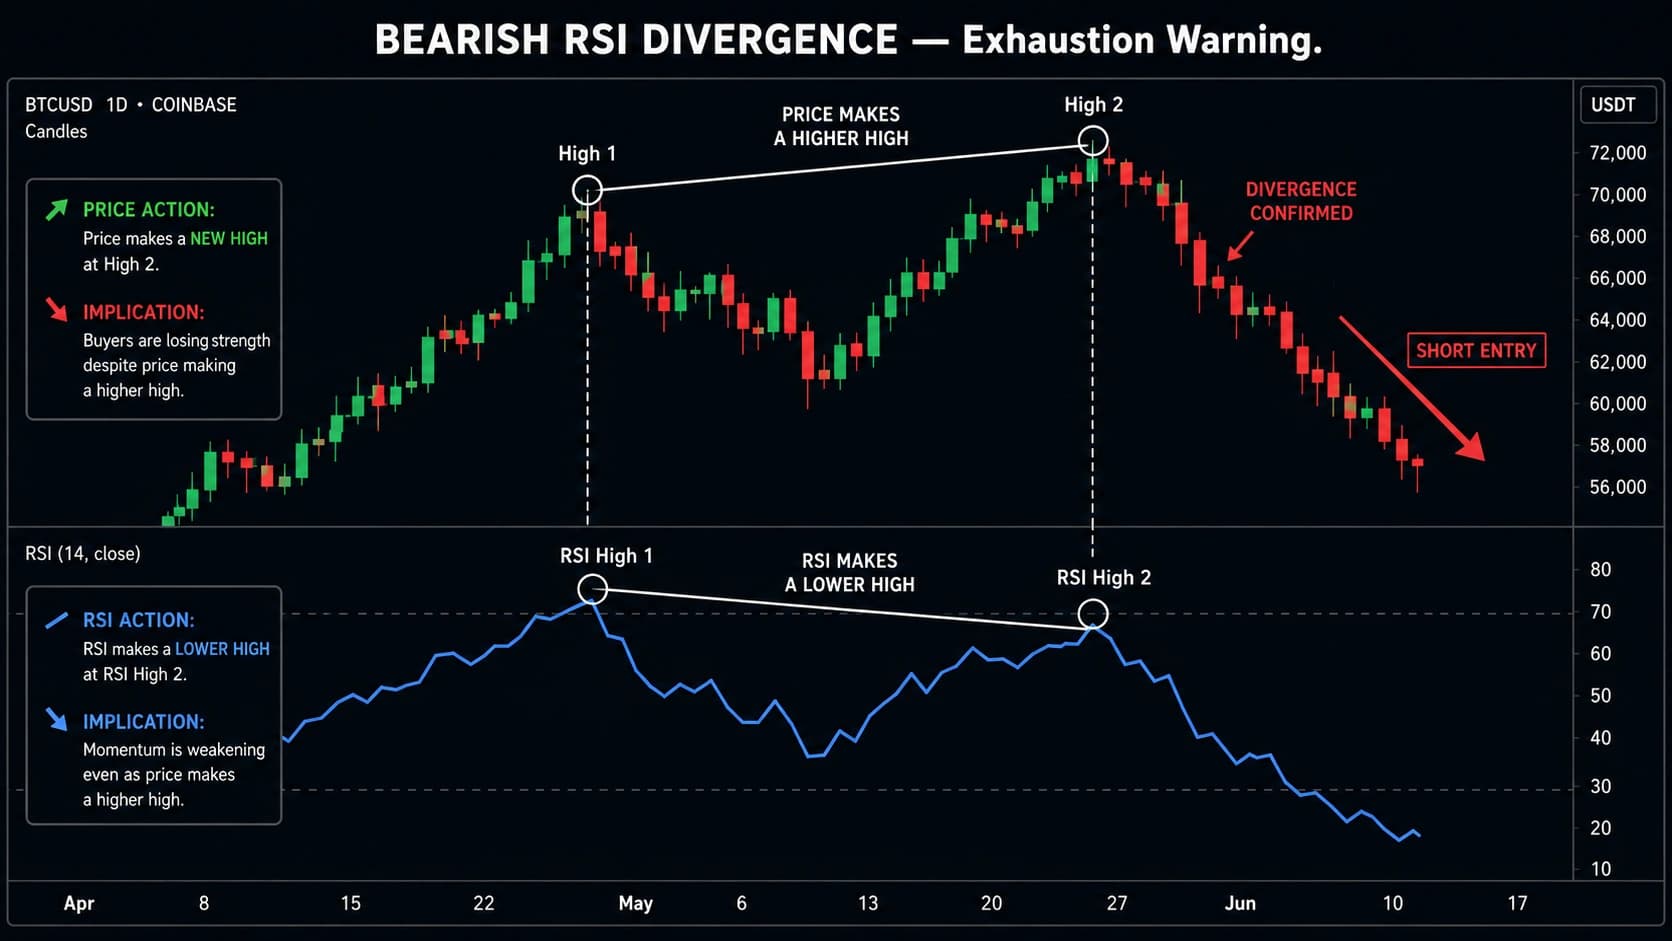
Bearish Regular Divergence:
- Price makes a higher high (new price extreme to the upside)
- RSI makes a lower high (RSI does not confirm the new price high)
- Meaning: Buyers reached a new high in price but with less momentum than before. Buying is exhausting.
- Signal: Potential bearish reversal approaching
The critical warning: Never enter on divergence alone. Pair it with market structure and a confirmation candle. Divergence is a warning, not a trade entry trigger. The divergence can persist for multiple swings in strong trends before the reversal materialises.
Signal 4 — Hidden Divergence (Continuation Signal)
Hidden divergence is the opposite of regular divergence — it signals trend continuation rather than reversal.
Hidden Bullish Divergence:
- Price makes a higher low (uptrend structure: price pulled back but held higher than last time)
- RSI makes a lower low (RSI pulled back further than the previous pullback)
- Meaning: The trend is intact (higher low) but RSI overshoot during the pullback. Momentum is resetting to rejoin the uptrend.
- Signal: Bullish continuation — the uptrend is resuming
Hidden Bearish Divergence:
- Price makes a lower high (downtrend structure)
- RSI makes a higher high
- Meaning: The downtrend is intact but RSI overshot during the counter-trend bounce. Bearish continuation approaching.
- Signal: Bearish continuation
Why hidden divergence is valuable: Regular divergence warns of reversals (which may or may not materialise). Hidden divergence confirms continuation trades — a higher-frequency, higher-probability signal for trend-following traders.
Part 4: How to Set Up RSI on Your Charts
TradingView (Recommended)
- Open any NSE stock chart
- Set your timeframe (5-minute for intraday, daily for swing trading)
- Click Indicators at the top
- Search "RSI" and select the built-in Relative Strength Index
- Click the Settings (gear icon) and set:
- Length: 14 (or 9 for intraday)
- Upper Band: 70 (or 80 for high-volatility stocks)
- Lower Band: 30 (or 20)
- Midline: 50 (add a horizontal line at 50 if not automatic)
- Apply and save as a template
Adding the 50 Midline Manually
The 50 midline is often not visible by default. Add it explicitly:
- In RSI settings → Levels → Add level at 50
- Colour it differently (grey or blue) to distinguish from the 70/30 levels
The visual separation of 70 (upper), 50 (midline), and 30 (lower) creates the three-zone framework your eyes need for rapid RSI interpretation.
Zerodha Kite Setup
- Open chart → Add indicator → Search RSI
- Default 14-period RSI applies automatically
- Manually draw horizontal reference lines at 70, 50, and 30 using the line drawing tool
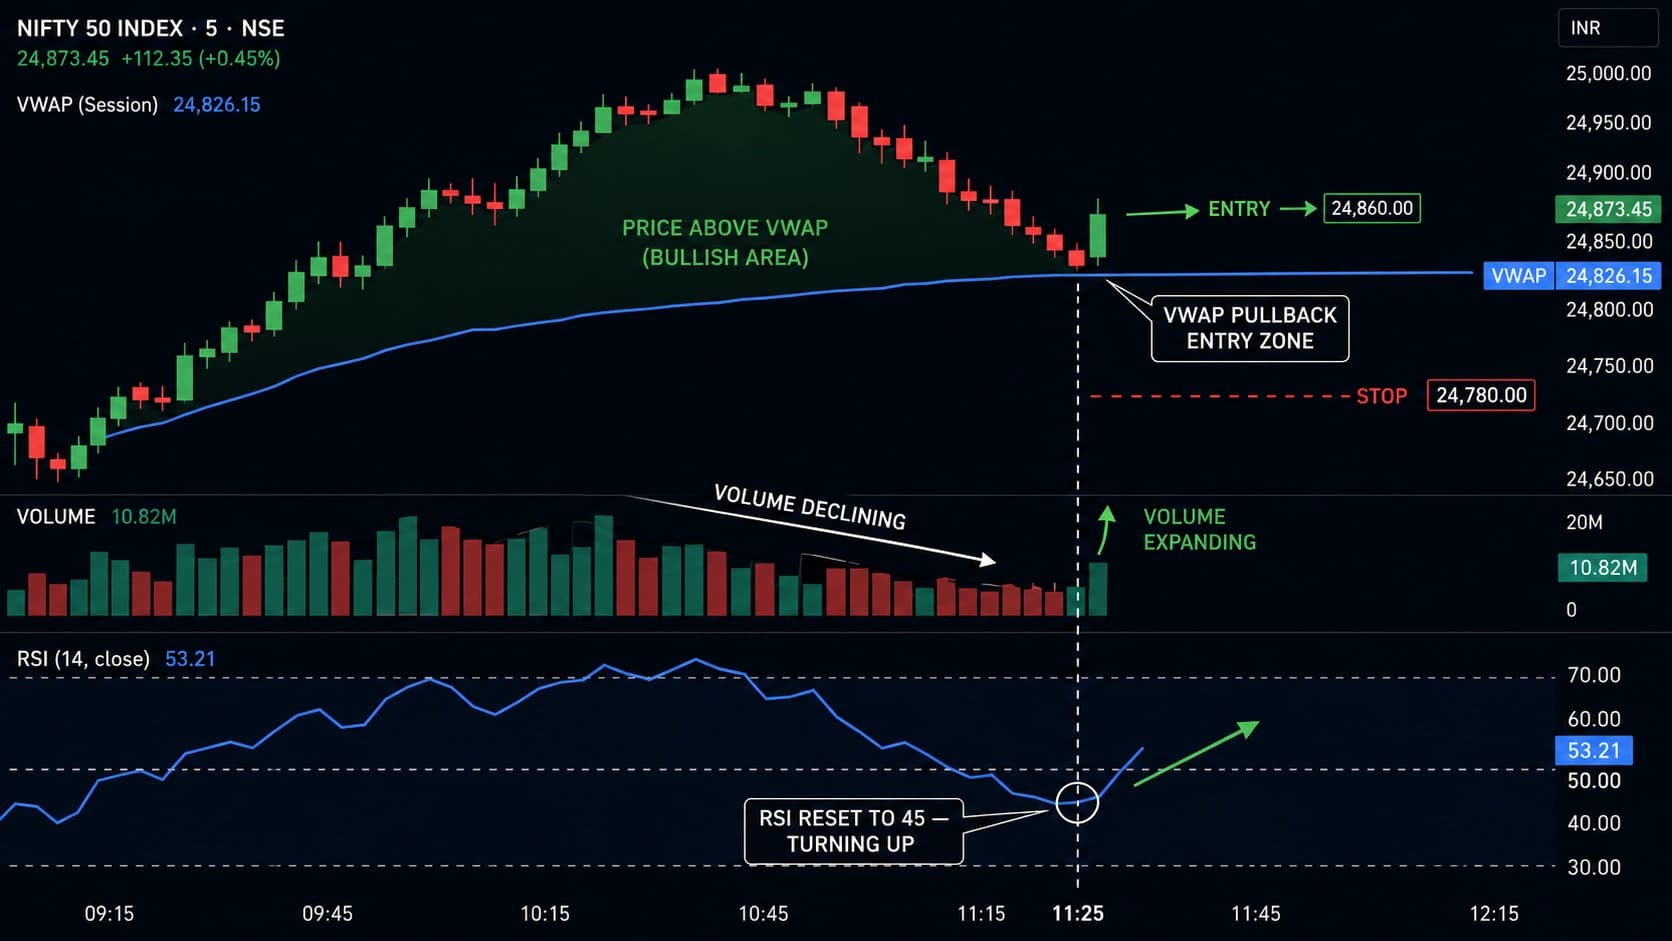
Pro Tip: Use multi-panel RSI — add RSI to both the daily chart (to read the overall trend momentum) and the 5-minute chart (to time your entry within that trend). A bullish daily RSI above 50 combined with a 5-minute RSI pulling back to 40–45 and turning upward is one of the cleanest RSI-based entry signals for NSE intraday traders. This two-timeframe RSI alignment significantly improves entry quality.
Part 5: Five Complete RSI Trading Strategies
Strategy 1 — RSI Oversold Bounce (Support Zone Entry)
The most widely taught RSI strategy — and the most widely misapplied. When used correctly (with market regime filtering and location requirements), it is one of the most reliable mean-reversion setups available.
Setup conditions:
- Identify a ranging market or a stock in an established uptrend making a pullback
- Price declines toward a key support level (prior swing low, moving average, round number)
- RSI drops below 30 (or below 40 for trending markets using the tighter threshold)
- RSI begins turning upward from the oversold zone — the line curves up from below 30
- A bullish candlestick pattern forms at the support level (Hammer, Bullish Engulfing, Morning Star)
The market regime requirement: Only use the RSI Oversold Bounce strategy in:
- Ranging markets where price oscillates between support and resistance
- Uptrend pullbacks where price has corrected to a known support within an uptrend
Do NOT use this strategy in strong downtrends where RSI remaining below 30 is expected.
Entry: After RSI exits the oversold zone (crosses back above 30) AND a bullish candlestick confirmation appears at the support level
Stop Loss: Below the support level (below the recent swing low)
Target: The next resistance level above or the top of the established range
Practical RSI Oversold rule: RSI enters the oversold area → RSI line exits the oversold territory (crosses above 30) → generating a buy signal. Then combine with MA crossover for exit confirmation.
Real NSE example (Nifty 50 constituent): A large-cap stock in the Nifty 50 has been in an uptrend for 3 months. RSI on the daily chart drops to 28 during a pullback to the 50 SMA. A Morning Star forms at the 50 SMA. RSI turns from 28 and crosses back above 30.
- Entry: At the close of the Morning Star's Day 3
- Stop: Below the Morning Star's Day 2 low
- RSI confirmation: RSI above 40 by the next session confirms momentum is recovering
- Target: Previous swing high
Strategy 2 — RSI + Candlestick Pattern Combination (Confluence Entry)
The most powerful RSI strategy for most retail traders combines RSI extremes with candlestick pattern confirmation. Neither the RSI reading nor the candlestick alone is sufficient — together, they create a two-factor confirmation that dramatically improves signal quality.
The fundamental logic: RSI tells you the momentum context (is the selling exhausted?). The candlestick pattern tells you the precise moment buyers are stepping in. Two independent signals at the same location = high probability.
Bullish setup combination:
The most powerful version: Price pushes into resistance on a weak move, RSI prints above 70, and price closes back below resistance with a strong red candle. Often that closing candle is itself a bearish reversal pattern like a bearish engulfing or a shooting star.
Apply the same logic in reverse for bullish setups — price approaches support, RSI drops below 40 (or 30 for more extreme setups), and a bullish candlestick forms.
Specific bullish combinations:
- RSI < 30 + Hammer at support — highest probability bullish bounce
- RSI < 40 + Morning Star at key level — three-session confirmed reversal with momentum exhaustion
- RSI < 45 + Bullish Engulfing at moving average — trend continuation pullback entry
Specific bearish combinations:
- RSI > 70 + Shooting Star at resistance — exhausted buyers + visual rejection
- RSI > 70 + Bearish Engulfing at resistance — decisive seller takeover at momentum extreme
- RSI > 65 + Evening Star at moving average resistance — three-session reversal at MA resistance
Entry: At the close of the confirming candlestick (after both RSI condition and pattern are confirmed)
Stop: Below the candlestick pattern's low for bullish setups (above its high for bearish)
Target: The next key level in the trade direction — minimum 2:1 risk-reward
Strategy 3 — RSI Divergence Strategy (Early Reversal Detection)
The RSI Divergence strategy is the most sophisticated RSI application — and the most rewarding when applied correctly. It catches reversals earlier than other RSI strategies because it identifies the weakening of trend momentum before the price itself reverses.
Step-by-step divergence identification:
Step 1: Apply RSI (14-period) to the price chart
Step 2: Find the latest swing highs and lows in price — mark them clearly
Step 3: Match those price points with corresponding RSI peaks and troughs
Step 4: Check if price and RSI are moving in opposite directions from those points
Step 5: Wait for confirmation before entering — a break of minor price structure, RSI centerline crossover, or a strong candlestick at the divergence point
Trading Bullish Regular Divergence:
- Price makes Lower Low 1, then Lower Low 2 (new lower low)
- RSI makes Low 1, then Higher Low 2 (RSI does not confirm the new price low)
- Draw a downward-sloping line connecting the two price lows
- Draw an upward-sloping line connecting the two RSI lows
- These lines diverge = Bullish Regular Divergence
- Wait for a bullish candlestick (Hammer, Engulfing) or a break above the minor swing high between the two price lows
- Entry: At the confirmation signal
- Stop: Below the second price low
- Target: The swing high between the two lows (first target); the previous significant high (second target)
Trading Bearish Regular Divergence:
- Price makes Higher High 1, then Higher High 2 (new higher high)
- RSI makes High 1, then Lower High 2
- The opposite convergence forms — bearish signal
- Wait for a bearish candlestick (Shooting Star, Bearish Engulfing) at the divergence point
- Entry: At the confirmation candle close
- Stop: Above the second price high
- Target: The swing low between the two highs
Trading Hidden Bullish Divergence (Continuation):
- Confirmed uptrend (higher highs and higher lows in price)
- Price pulls back to make a Higher Low — maintaining the uptrend
- RSI makes a Lower Low on this pullback — overshooting to the downside
- Hidden bullish divergence confirmed — the trend is intact, RSI just reset further
- Entry: As RSI turns upward from the lower low and price confirms the higher low with a bullish candle
- Stop: Below the Higher Low in price
- Target: Next swing high in the uptrend
Warning: Divergence is a warning signal, not a standalone trade trigger. Divergence can persist for multiple swings before the reversal materialises — entering immediately when divergence appears without confirmation produces many false entries. Always wait for a confirmation signal: a candlestick reversal pattern, a break of a minor price structure, or RSI crossing the 50 midline.
Strategy 4 — RSI Centerline Cross Strategy (Trend Following)
The centerline strategy uses RSI's 50 level as a momentum direction filter and trade trigger — simpler than the divergence strategy but highly effective as a trend confirmation tool.
The two centerline signals:
Bullish Centerline Cross: RSI crosses above 50 from below
- Meaning: Buyers have just become stronger than sellers on average over the period
- Momentum has shifted from net bearish to net bullish
- In the context of a price breakout above resistance, this confirms the breakout is backed by genuine momentum
Bearish Centerline Cross: RSI crosses below 50 from above
- Meaning: Sellers have just become stronger than buyers
- Momentum has shifted from net bullish to net bearish
- In the context of a price breakdown below support, this confirms the breakdown is backed by genuine momentum
Strategy 4A — Centerline Cross as Trend Filter: Use RSI 50 as a filter for all other trade entries:
- Only take bullish candlestick pattern entries when RSI is above 50 (momentum is bullish)
- Only take bearish candlestick pattern entries when RSI is below 50 (momentum is bearish)
This single filter eliminates a significant percentage of counter-momentum trades that look visually valid on a chart but lack the momentum backing to sustain the move.
Strategy 4B — Centerline Cross as Entry Trigger: In combination with a price structure breakout:
- Price breaks above a key resistance → RSI simultaneously crosses above 50 → Entry signal
- Price breaks below a key support → RSI simultaneously crosses below 50 → Short entry signal
Entry: On the candle that closes above resistance AND has RSI above 50 simultaneously
Stop: Below the breakout level
Target: The next significant resistance (bullish) or support (bearish) above/below
The most reliable RSI centerline application for NSE traders: Apply RSI 50 as your intraday trend filter. When RSI is above 50 on the 5-minute chart, you only look for long setups from the Dhanith Intraday Screener. When RSI is below 50, you only look for short setups. This prevents the most common intraday error: entering long when the session momentum is actually bearish.
Strategy 5 — RSI + VWAP Strategy (NSE Intraday)
For Indian intraday traders, combining RSI with VWAP creates the most complete momentum-location indicator combination available for NSE intraday trading.
Why RSI + VWAP is powerful:
- VWAP tells you where price is relative to institutional fair value (above = expensive, below = cheap)
- RSI tells you the momentum direction and intensity
- Together: VWAP provides the location context; RSI provides the momentum confirmation
Bullish RSI + VWAP Setup:
Condition 1 — VWAP: Price is above VWAP (bullish session bias confirmed) Condition 2 — RSI: RSI pulled back toward 40–50 during the pullback to VWAP (reset without breaking bearish) Condition 3 — RSI reversal: RSI turns upward from 40–50 and begins rising again Condition 4 — Candlestick: A Hammer or Bullish Engulfing forms at VWAP as RSI turns up Condition 5 — Timing: The setup forms during the 9:45–11:00 AM NSE killzone
This combination — VWAP location, RSI momentum reset, candlestick confirmation, and killzone timing — produces the highest-probability intraday long entries for NSE stocks.
Entry: At the close of the bullish candlestick at VWAP, with RSI above 45 and turning upward
Stop: Below VWAP (0.2–0.3% buffer below the wick low at VWAP)
Target: Previous intraday high — minimum 2:1 risk-reward
Bearish RSI + VWAP Setup: Price below VWAP + RSI pulling back toward 50–60 from below VWAP + RSI turns down at 55 + Shooting Star or Bearish Engulfing at VWAP = Short entry
RSI Zone Chart for Intraday NSE:
| RSI Reading | VWAP Position | Action |
|---|---|---|
| RSI > 60, above VWAP | Strong bullish session | Hold longs, look for continuation |
| RSI 45–55, at VWAP | Pullback in bullish session | Best VWAP bounce entry window |
| RSI < 40, below VWAP | Bearish session | Look for short setups |
| RSI 45–55, rallying to VWAP | Rally in bearish session | Best VWAP short entry window |
| RSI > 70, far above VWAP | Extended — caution | Reduce new longs; watch for reversal |
| RSI < 30, far below VWAP | Extended — caution | Reduce new shorts; watch for bounce |
Part 6: RSI Settings for Different NSE Instruments
Nifty 50 and Nifty Futures
Daily chart: RSI 14 with standard 70/30 levels. Nifty and Bank Nifty on daily charts with RSI 14 have historically provided good entry signals for swing traders. The daily Nifty RSI below 40 at a known support zone has reliably preceded multi-day rallies in bull market conditions.
5-minute chart (intraday): RSI 9 for faster signals. On high-volume sessions, RSI 14 is also reliable. Use RSI 50 as the intraday trend filter throughout the 9:15 AM – 3:30 PM session.
Bank Nifty
Bank Nifty's higher volatility (ATR typically 1.5–2× Nifty's) means RSI extremes occur more frequently and with more intensity. Recommended adjustments:
- Use RSI 80/20 thresholds instead of 70/30 for overbought/oversold signals
- Require RSI to spend at least 2–3 candles below 20 or above 80 before treating the extreme as actionable
- Apply RSI 50 as the strict intraday direction filter — never trade RSI counter-trend on Bank Nifty
Individual NSE Stocks
For Nifty 50 large-cap stocks (HDFC Bank, ICICI Bank, Reliance, Infosys, TCS):
- Daily RSI 14 with 70/30 levels works well for swing trading
- These stocks show clean RSI oscillation patterns that swing traders actively use
- 5-minute RSI 9 or 14 for intraday setups
For mid-cap and small-cap NSE stocks:
- Higher individual volatility may require 80/20 thresholds
- Require stronger divergence signals (more visible, longer duration)
- Be cautious with RSI readings on thin-volume days
Part 7: RSI Mistakes and Exact Fixes
Mistake 1 — Selling Every RSI Above 70
The classic beginner error. RSI hits 70 and the trader shorts because "it's overbought." In a strong uptrend, RSI stays above 70 for weeks while price doubles.
The fix: RSI above 70 in an uptrend is a continuation signal, not a reversal. Only use RSI > 70 as a potential reversal signal in ranging markets or at a significant resistance level after an extended rally. Always identify the market regime first.
Mistake 2 — Buying Every RSI Below 30
The opposite error. RSI drops to 28 in a strong downtrend and the trader buys because "it's oversold." In a bear market, RSI can remain below 30 for months.
The fix: RSI below 30 in a strong downtrend is a continuation signal. Only use RSI < 30 as a bounce signal in ranging markets or in established uptrends during a significant pullback. Require a candlestick confirmation pattern and a key support level before entering.
Mistake 3 — Acting on Divergence Without Confirmation
Spotting a bullish divergence (price makes lower low, RSI makes higher low) and immediately entering long without waiting for confirmation. The divergence extends for two more weeks and the early entry accumulates a significant loss before the actual reversal.
The fix: Divergence is a warning, not an entry trigger. After spotting divergence, wait for: (1) a bullish candlestick pattern at the divergence point, (2) RSI crossing above 50, or (3) price breaking above a minor swing high. Any one of these confirmation signals justifies entry. Without confirmation, observe and wait.
Mistake 4 — Using RSI Alone (No Other Confluence)
Building an entire trading decision around a single RSI reading, ignoring price structure, key levels, volume, and trend direction.
The fix: RSI is a momentum confirmation tool, not a standalone trading system. That layered approach is how RSI works in real trading. Alone it is a number on a screen. Combined with market structure, price action, and risk management, it is one of the sharpest tools you can have on your chart. Always pair RSI with at least one other element: a candlestick pattern, a key price level, or VWAP.
Mistake 5 — Using the Wrong Period for the Timeframe
Using RSI 14 on a 1-minute chart (too slow — produces massively lagging signals) or RSI 5 on a weekly chart (too fast — creates excessive noise).
The fix: Match RSI period to chart timeframe. For 1-minute charts, use RSI 2–7. For 5-minute charts, use RSI 7–14. For daily charts, use RSI 14. For weekly charts, use RSI 14–21. The period should capture a meaningful number of price cycles for the timeframe being analyzed.
Mistake 6 — Ignoring the 50 Midline
Focusing exclusively on the 70 and 30 levels while ignoring the 50 midline as a directional filter, resulting in entries against the prevailing momentum.
The fix: Before any trade, check RSI relative to 50. Above 50 → only take bullish setups. Below 50 → only take bearish setups. This single discipline eliminates the majority of counter-momentum trades.
Part 8: RSI — Trending vs. Ranging Markets
The single most important RSI concept — and the one most traders miss:
RSI works differently in trending markets and ranging markets.
| Market Type | RSI Above 70 Meaning | RSI Below 30 Meaning | Strategy |
|---|---|---|---|
| Uptrend | Strong bullish momentum — continuation | Rare; strong pullback — potential re-entry | Trend-following; wait for pullback to 40–50 for entry |
| Downtrend | Rare; strong bounce — potential re-entry | Strong bearish momentum — continuation | Trend-following; wait for rally to 50–60 for short entry |
| Range | Price near range ceiling — reversal likely | Price near range floor — bounce likely | Mean-reversion; trade the extremes at range boundaries |
How to determine the market regime for RSI application:
- Is price above or below the 200 SMA? Above = long-term uptrend. Below = long-term downtrend.
- Are there equal highs and equal lows (range) or consistent HH/HL (trend)?
- Is the 50 SMA and 200 SMA flat (range) or sloping (trend)?
Once the regime is established, apply the appropriate RSI interpretation. This step eliminates approximately 40% of RSI false signals by ensuring the indicator is used correctly for the market condition it is in.
FAQ
Q: What is the RSI trading strategy? The RSI (Relative Strength Index) trading strategy uses the RSI momentum oscillator — a 0–100 scale measuring buyer-seller strength over a defined period — to identify trade entries and exits. Common strategies include trading RSI oversold/overbought extremes at key levels, using RSI divergence as an early reversal warning, using the RSI 50 midline as a momentum directional filter, and combining RSI with candlestick patterns or VWAP for high-probability entries. RSI alone is not a trading system — it works best as a momentum confirmation layer within a broader price action framework.
Q: What is the best RSI setting for day trading? For day trading on NSE stocks and indices: RSI 9 on the 5-minute chart for faster signals; RSI 14 on the 5-minute chart for the standard institutional setting. For Bank Nifty's higher volatility, use 80/20 overbought/oversold thresholds instead of the default 70/30. For 15-minute charts (swing intraday), RSI 14 with standard 70/30 levels works well. Always use the 50 midline as the directional bias filter.
Q: Does RSI above 70 mean I should sell? No — RSI above 70 signals strong bullish momentum, not an automatic sell. In strong uptrends, RSI can remain above 70 for extended periods while price continues to rise. Treating RSI above 70 as an automatic sell signal is one of the most expensive mistakes in technical analysis. RSI > 70 is only a potential reversal signal in ranging markets or at well-established resistance levels after an extended rally, preferably combined with a bearish candlestick confirmation pattern.
Q: What is RSI divergence? RSI divergence is the disagreement between price direction and RSI direction. Bullish divergence: price makes a lower low but RSI makes a higher low — selling momentum is weakening. Bearish divergence: price makes a higher high but RSI makes a lower high — buying momentum is weakening. Both signal potential trend reversals. Hidden divergence signals trend continuation: hidden bullish (price higher low, RSI lower low = uptrend continuing) and hidden bearish (price lower high, RSI higher high = downtrend continuing). Always require a confirmation signal before entering on divergence alone.
Q: How do I use RSI with VWAP for NSE intraday trading? Combine VWAP (location filter) and RSI (momentum filter) for high-probability NSE intraday setups. Bullish setup: price is above VWAP, RSI pulled back toward 40–50 during the VWAP retest, RSI turns upward from 40–50, and a bullish candlestick forms at VWAP — enter long with stop below VWAP. Bearish setup: price is below VWAP, RSI rallied toward 50–60 during the VWAP test, RSI turns downward, and a bearish candlestick forms at VWAP — enter short with stop above VWAP. Best time window: 9:45–11:00 AM IST.
Q: What RSI level is best for buying stocks? There is no universal "best" RSI level for buying — it depends on the market regime. In ranging markets and uptrend pullbacks, RSI below 30 (or below 40 in tighter strategies) combined with a bullish candlestick at a key support level is a high-probability buy signal. In established uptrends, RSI pulling back to 40–50 at a support level is often a better buy zone than waiting for RSI below 30 (which may never occur in strong trends). The 50 midline is the most important level: only buy when RSI is above 50 (bullish momentum confirmed).
Conclusion
RSI is one of the most valuable tools in a trader's kit — and one of the most misused. The misuse almost always comes from the same source: treating overbought and oversold as absolute signals rather than context-dependent momentum readings.
RSI measures momentum. Strong momentum is not automatically a reversal signal. Weak momentum is not automatically a buy signal. Context — trend direction, market regime, key price levels, candlestick confirmation — determines what each RSI reading means.
Three principles to carry forward:
1. The 50 midline is your directional filter. Before any trade, check RSI relative to 50. Above = bullish bias, enter only longs. Below = bearish bias, enter only shorts. This eliminates the majority of counter-momentum entries that look valid on the chart but lack the momentum backing to sustain.
2. Match RSI to the market regime. Overbought RSI in an uptrend is a momentum confirmation. The same reading at resistance in a range is a reversal warning. Identify the regime before interpreting the reading.
3. RSI is a confirmation tool, not a standalone system. Pair it with a candlestick pattern, a VWAP level, or a price structure break. Two aligned signals — RSI and price action — produce the consistently profitable setups. One signal alone produces random-level results.
Further reading: Support and Resistance: The Complete Trading Guide | Important Candlestick Patterns: The Complete Guide | How to Trade Intraday Stocks in India: The Complete Guide | Bollinger Bands Trading Strategy | Volume Analysis Trading Strategy | Smart Money Concepts: The Complete Mastery Guide | Order Blocks: The Complete Mastery Guide | Technical Analysis Mastery: The Complete Guide | 5 Best Intraday Trading Strategies for NSE India
Ready to Trade These Signals on Real Stocks?
→ Open the Dhanith Intraday Screener — find today's NSE stocks where RSI and VWAP align for high-probability setups
→ Calculate Your Risk Before Every RSI Trade — know your exact share count, stop distance, and maximum loss before you enter
→ Log Your RSI Trades in the Dhanith Journal — track which RSI settings, zones, and confirmation patterns produce your best win rate
Disclaimer: This article is for educational purposes only and does not constitute financial or investment advice. Trading involves significant risk of capital loss. Past performance does not guarantee future results. Always use proper risk management.
Have a question about this article?
Comment on our latest Instagram post or send us a DM — we reply to every one.
@dhanith_officialWas this article helpful?
Click to rate
Founder, Dhanith Trading
7+ years trading Nifty, Bank Nifty, NSE stocks, and commodities — specializing in Smart Money Concepts (SMC) and ICT price action. Founder of Dhanith — a trading journal, intraday screener, and risk tools platform built for retail traders.
Dhanith Newsletter
Enjoyed this article? Get more like it.
New trading guides, candlestick patterns, SMC strategies, and tool updates — straight to your inbox. Free, for Indian traders.
No spam. Unsubscribe anytime.
Continue Reading