On this page
- Introduction
- Part 1: What Are Bollinger Bands? — The Complete Foundation
- The Origin — John Bollinger
- The Three-Line Structure
- The Formula
- What the Bands Tell You
- Part 2: Bollinger Bands Settings — What to Use on NSE
- The Default Settings (20, 2) — Why They Work
- Adjusting Settings for Different Applications
- Bollinger BandWidth (BBW) — The Squeeze Detector
- Part 3: The Three Core Bollinger Bands Signals
- Signal 1 — The Squeeze (Low Volatility Before Explosion)
- Signal 2 — Walking the Bands (Trend Continuation)
- Signal 3 — Mean Reversion (Range Oscillation)
- Part 4: How to Set Up Bollinger Bands on Your Charts
- TradingView Setup (Recommended)
- Zerodha Kite Setup
- Visual Interpretation Rules
- Part 5: Five Complete Bollinger Bands Trading Strategies
- Strategy 1 — The Bollinger Squeeze Breakout (The Most Powerful Setup)
- Strategy 2 — Band Walk (Trend Following)
- Strategy 3 — Mean Reversion (Range Oscillation)
- Strategy 4 — Double Bollinger Bands (The Zone Strategy)
- Strategy 5 — RSI + Bollinger Bands (The Confluence Strategy)
- Part 6: Bollinger Bands for NSE — India-Specific Application
- Nifty and Bank Nifty
- Individual NSE Stocks
- Part 7: Bollinger Bands Mistakes and Exact Fixes
- Mistake 1 — Treating Every Upper Band Touch as a Sell Signal
- Mistake 2 — Trading the Squeeze Without Confirming Direction
- Mistake 3 — Mean Reversion in Trending Markets
- Mistake 4 — Using Bollinger Bands Alone
- Mistake 5 — Entering Mid-Candle on the Breakout
- Mistake 6 — Not Adjusting Settings for Instrument Volatility
- Part 8: Trending vs Ranging Markets — The Critical Context
- FAQ
- Conclusion
- Ready to Trade These Signals on Real Stocks?

Bollinger Bands Trading Strategy: The Complete Guide for Stock Traders (2026)
Master Bollinger Bands trading strategies in 2026. Learn the Squeeze breakout, Band Walk, Mean Reversion, Double Bollinger, and RSI+BB combinations — with NSE India examples, settings guide, and common mistakes with exact fixes.
Introduction
Every experienced trader has stared at a chart where price has been grinding sideways for days — the candles tight, the range shrinking, the market seemingly frozen in time.
Then suddenly, in one session, price explodes. A large candle breaks out of the compression. Volume surges. And the move extends for days.
If you had known that breakout was coming — and more importantly, which direction — you could have positioned perfectly. The Bollinger Bands Squeeze strategy exists precisely for this scenario.
Bollinger Bands are a volatility indicator consisting of a centre moving average (typically a 20-period simple moving average) and two outer bands plotted at ±2 standard deviations. The bands widen during high volatility and contract during calm markets. This dynamic, volatility-reactive behaviour gives Bollinger Bands an advantage over fixed-range indicators — they adapt to the market's actual volatility in real time.
Developed by John Bollinger in the 1980s to help traders and investors measure market volatility and identify potential trading opportunities, Bollinger Bands have become one of the most widely used indicators globally. In 2026, they remain a standard tool on the charts of professionals trading NSE stocks, Nifty futures, Bank Nifty options, and equity indices worldwide.
The power of Bollinger Bands comes from three distinct, complementary signals they generate:
- The Squeeze — compression signalling an imminent explosive move
- Walking the Bands — price riding the outer band in a strong trend
- Mean Reversion — price touching the outer band in a range and reverting to the middle
This guide covers all three — along with five complete trading strategies, NSE-specific applications, the optimal settings for Indian markets, and the most common mistakes with exact fixes.
TL;DR — Key Takeaways
- Bollinger Bands consist of three lines: middle band (20-period SMA), upper band (+2 standard deviations), lower band (−2 standard deviations)
- About 95% of all price action occurs within the upper and lower bands — touches of the bands are statistically significant events
- The Squeeze (bands contracting to 6-month lows) is the most powerful Bollinger Bands signal — a major directional move is imminent
- Price "walking the bands" in a strong trend does NOT signal reversal — it signals continuation
- Mean reversion works in ranging markets (buy lower band, sell upper band) but FAILS in trending markets
- Five strategies: Squeeze Breakout, Band Walk (Trend Following), Mean Reversion, Double Bollinger Bands, RSI + Bollinger Bands
- Default settings: 20-period SMA, 2 standard deviations — works on most NSE instruments
- Never use Bollinger Bands alone — always confirm with volume, RSI, or a candlestick pattern
Part 1: What Are Bollinger Bands? — The Complete Foundation
The Origin — John Bollinger
Bollinger Bands were developed by John Bollinger in the 1980s, introduced in his 1992 book and later detailed in Bollinger on Bollinger Bands (2001). Unlike many technical tools developed intuitively, Bollinger Bands are grounded in statistical theory — specifically, the concept of standard deviation as a measure of volatility distribution.
Bollinger's key insight was that price channels should be adaptive — they should widen when markets are volatile and narrow when they are calm. Fixed-width channels (like percentage-band envelopes) don't capture this dynamic quality. Standard deviation bands do.
The Three-Line Structure
Middle Band: A 20-period Simple Moving Average (SMA). Represents the average price over the past 20 sessions — the trend direction and the mean to which price tends to revert.
Upper Band: Middle Band + (2 × Standard Deviation). Represents the statistically significant upper extreme of the price range. Price touching or exceeding this level is an unusual event in terms of the distribution of recent prices.
Lower Band: Middle Band − (2 × Standard Deviation). The statistically significant lower extreme.
The Formula
Middle Band = 20-period SMA

Standard Deviation (σ) = √(Σ(Price − SMA)² ÷ N)

Upper Band = SMA + (2 × σ)
Lower Band = SMA − (2 × σ)
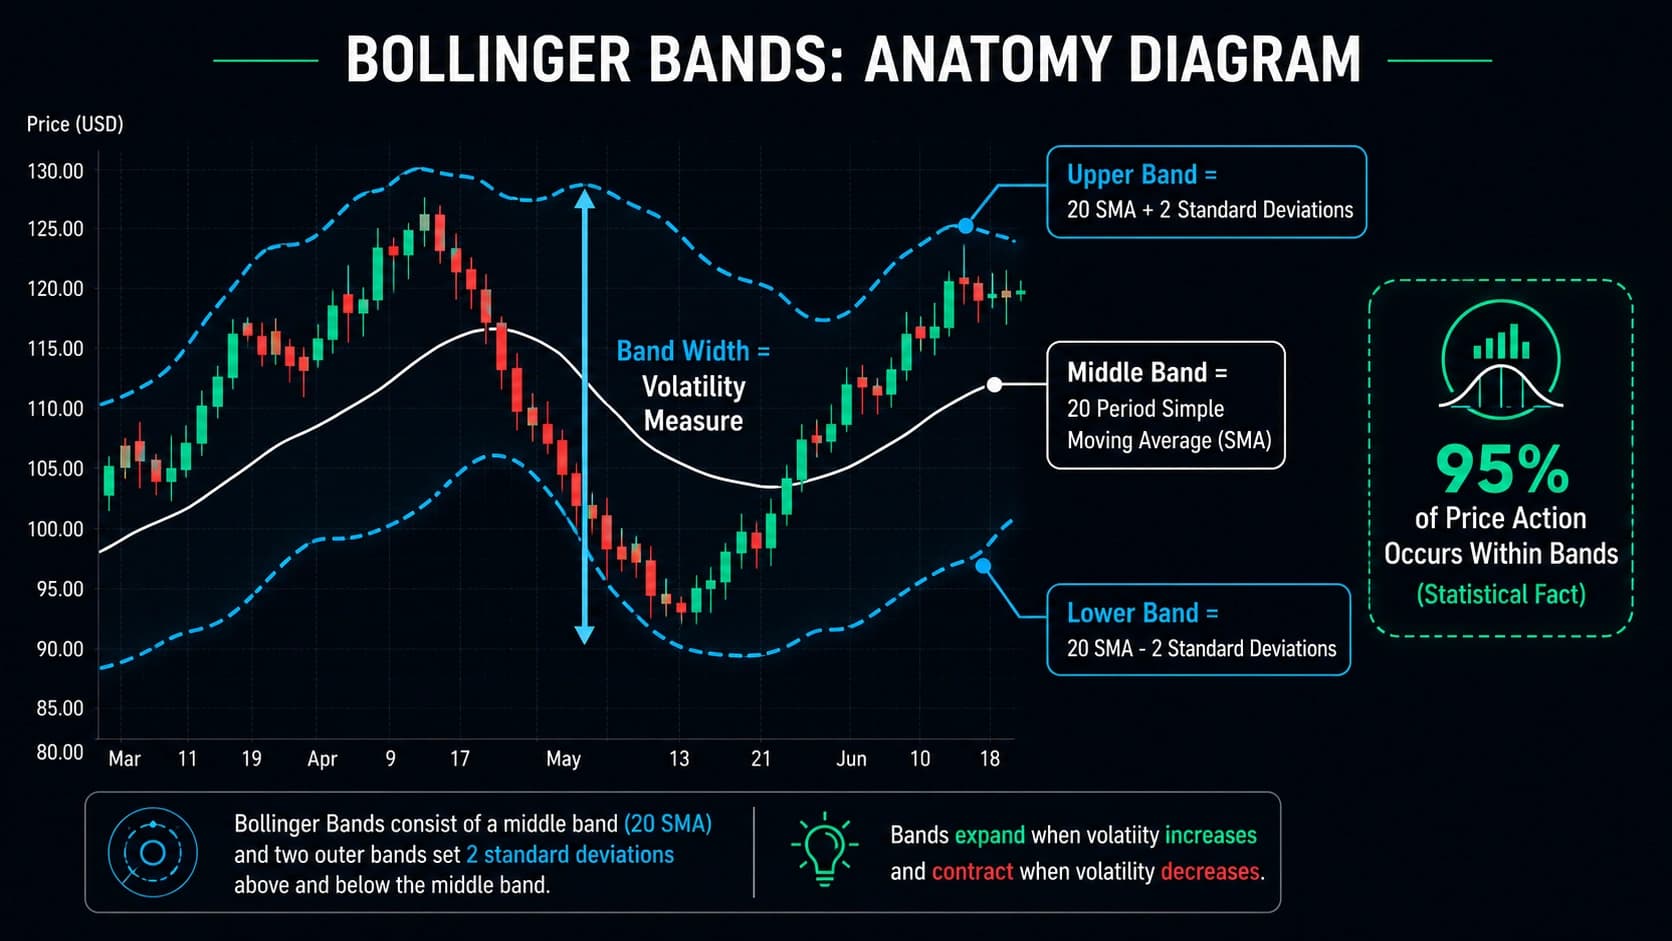
The 2-standard-deviation setting means that statistically, approximately 95% of all price action should occur within the bands. When price touches or breaches the bands, it is entering the 5% statistical extreme — an unusual event that warrants attention.
What the Bands Tell You
Band width (the distance between upper and lower bands):
- Bands wide apart: High current volatility — large moves in progress
- Bands close together (squeeze): Low current volatility — a major move is building
Price position relative to the bands:
- Price at upper band: Bullish momentum at a statistical extreme — either continuation (trend) or reversal (range)
- Price at lower band: Bearish momentum at a statistical extreme — either continuation or reversal
- Price at middle band: Price has returned to the average — the mean has been reached
Middle band slope:
- Middle band sloping upward: Uptrend — look for long setups
- Middle band sloping downward: Downtrend — look for short setups
- Middle band flat: No trend — look for range setups
Part 2: Bollinger Bands Settings — What to Use on NSE
The Default Settings (20, 2) — Why They Work
The most commonly used market setting is 20 periods. A month has about 20 trading days. The 20 SMA reflects the average market cost over the past month and is representative. Good balance: a period shorter than 20 makes the indicator overly sensitive and generates too much noise. A period longer than 20 reacts more slowly and may miss early trend signals.
The 2-standard-deviation setting captures approximately 95% of price action within the bands — making band touches statistically significant without being so extreme they rarely occur.
The default (20, 2) works well on 5-minute and 15-minute timeframes for Nifty, Bank Nifty, and liquid F&O stocks.
Adjusting Settings for Different Applications
| Trading Style | Period | Std Dev | Best For |
|---|---|---|---|
| Scalping (1–5 min) | 10–15 | 1.5–2.0 | Quick intraday reversals |
| Intraday (5–15 min) | 20 | 2.0 | Standard NSE intraday setups |
| Swing Trading (Daily) | 20 | 2.0 | Standard daily setups |
| Position Trading (Weekly) | 50 | 2.5 | Major trend identification |
| High-volatility (Bank Nifty) | 20 | 2.5–3.0 | Reduces false band touches |
For Bank Nifty specifically: Because Bank Nifty has a higher ATR (Average True Range) than Nifty 50, the standard 2 SD bands are touched more frequently. Using 2.5 or 3.0 standard deviations reduces false signals by only flagging the most extreme moves as band touches.
Bollinger BandWidth (BBW) — The Squeeze Detector
The Bollinger BandWidth (BBW) indicator is a supplementary tool that measures the width of the Bollinger Bands as a percentage of the middle band:
BBW = ((Upper Band − Lower Band) ÷ Middle Band) × 100
A high BBW means the bands are wide (high volatility). A low BBW means the bands are narrow (low volatility, potential squeeze). Track BBW over 8–12 months to identify when it approaches historically low levels — this indicates an imminent expansion.
Add BBW to your charts as a separate panel alongside the price chart with Bollinger Bands. When BBW reaches its lowest point in 6+ months, the Squeeze breakout setup is active.
Pro Tip: Set up a TradingView alert on BBW reaching a 6-month low for your watchlist stocks. This automated alert means you never miss a Squeeze setup forming — the most explosive Bollinger Bands signal. When the alert fires, switch to active monitoring and wait for the breakout direction to emerge.
Part 3: The Three Core Bollinger Bands Signals
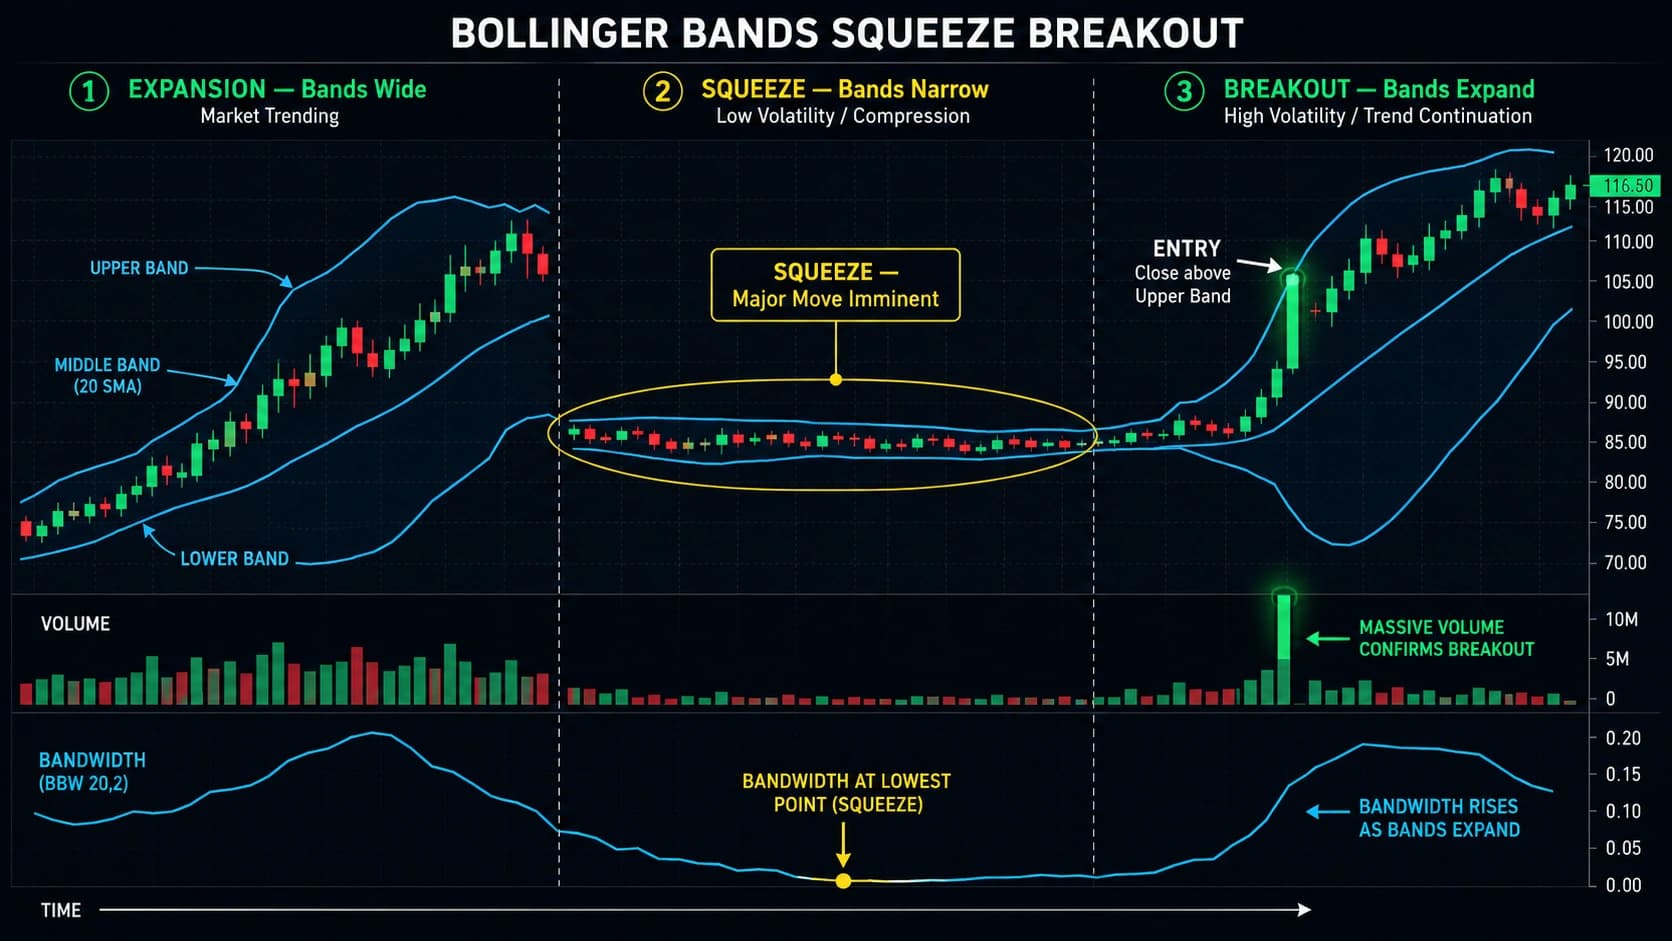
Signal 1 — The Squeeze (Low Volatility Before Explosion)
The Squeeze is the most powerful Bollinger Bands signal. When the bands contract to their narrowest width in 6+ months, it signals that a major directional move is imminent.
The squeeze occurs when bandwidth — the distance between upper and lower bands expressed as a percentage of the middle band — contracts to multi-month lows. In 2026, a Squeeze is a signal that liquidity is being built. The market is consolidating, building energy like a compressed spring, before a significant directional release.
Visual identification: The upper and lower bands are visibly close together. The middle band is flat or nearly flat. Price is making tiny candles within a tight range. On the price chart, the "channel" formed by the bands is noticeably narrower than at any point in recent history.
What it does NOT tell you: The Squeeze identifies THAT a move is coming — not WHICH direction it will go. Direction must be determined from other signals (volume, RSI, higher timeframe structure, candlestick patterns).
Using BBW to confirm: When BBW drops to a 6-month low AND begins turning upward (expanding), the Squeeze is releasing. This expansion is the moment to watch for the breakout candle.
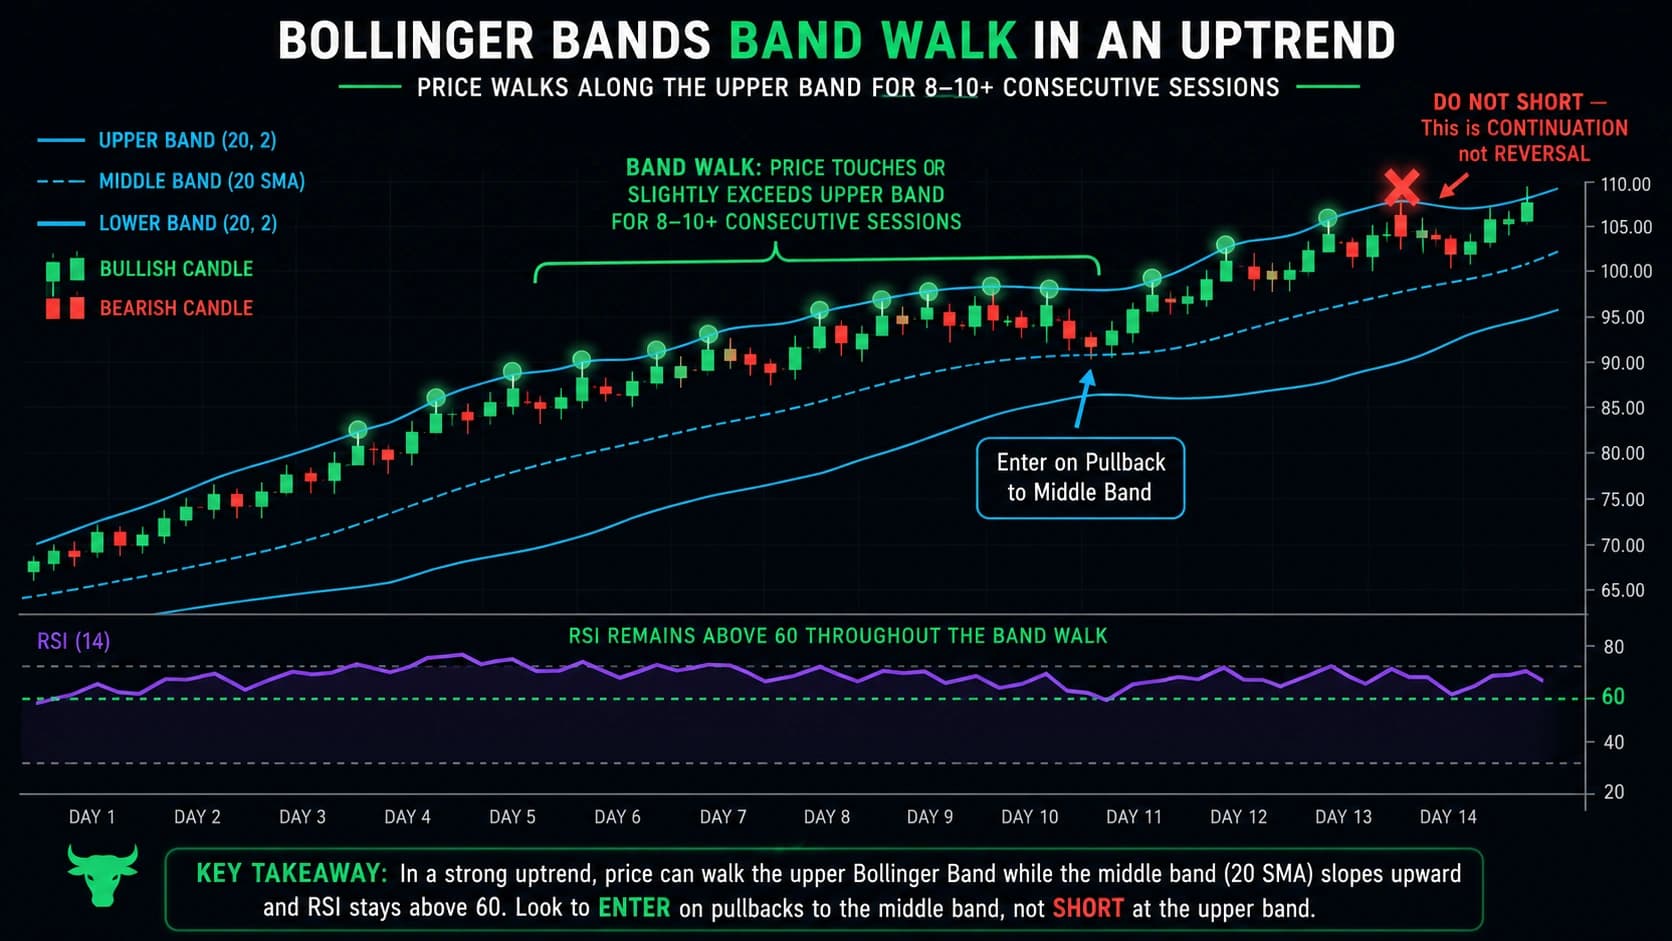
Signal 2 — Walking the Bands (Trend Continuation)
In a strong trend, price rides along the upper band (bull trend) or lower band (bear trend) for extended periods. This is called "walking the bands."
The most costly Bollinger Bands mistake is thinking that touching the upper band is always a sell signal. Do not short every time price touches the upper band in a trending market — price walks the bands during strong trends.
How to identify band walking:
- Price closes above the upper band (or below the lower band) on multiple consecutive candles
- The middle band is sloping in the direction of price movement
- Volume is above average throughout the band-walking phase
- RSI is above 60 (bullish walk) or below 40 (bearish walk) — confirming momentum
What band walking tells you: The trend is exceptionally strong. Institutions are aggressively buying (upper band walk) or selling (lower band walk). The statistical extreme of being outside the band is being sustained by genuine directional flow.
The correct response to band walking: Trade with the trend, not against it. Enter on pullbacks to the middle band during a band walk — not on band touches as reversal signals.
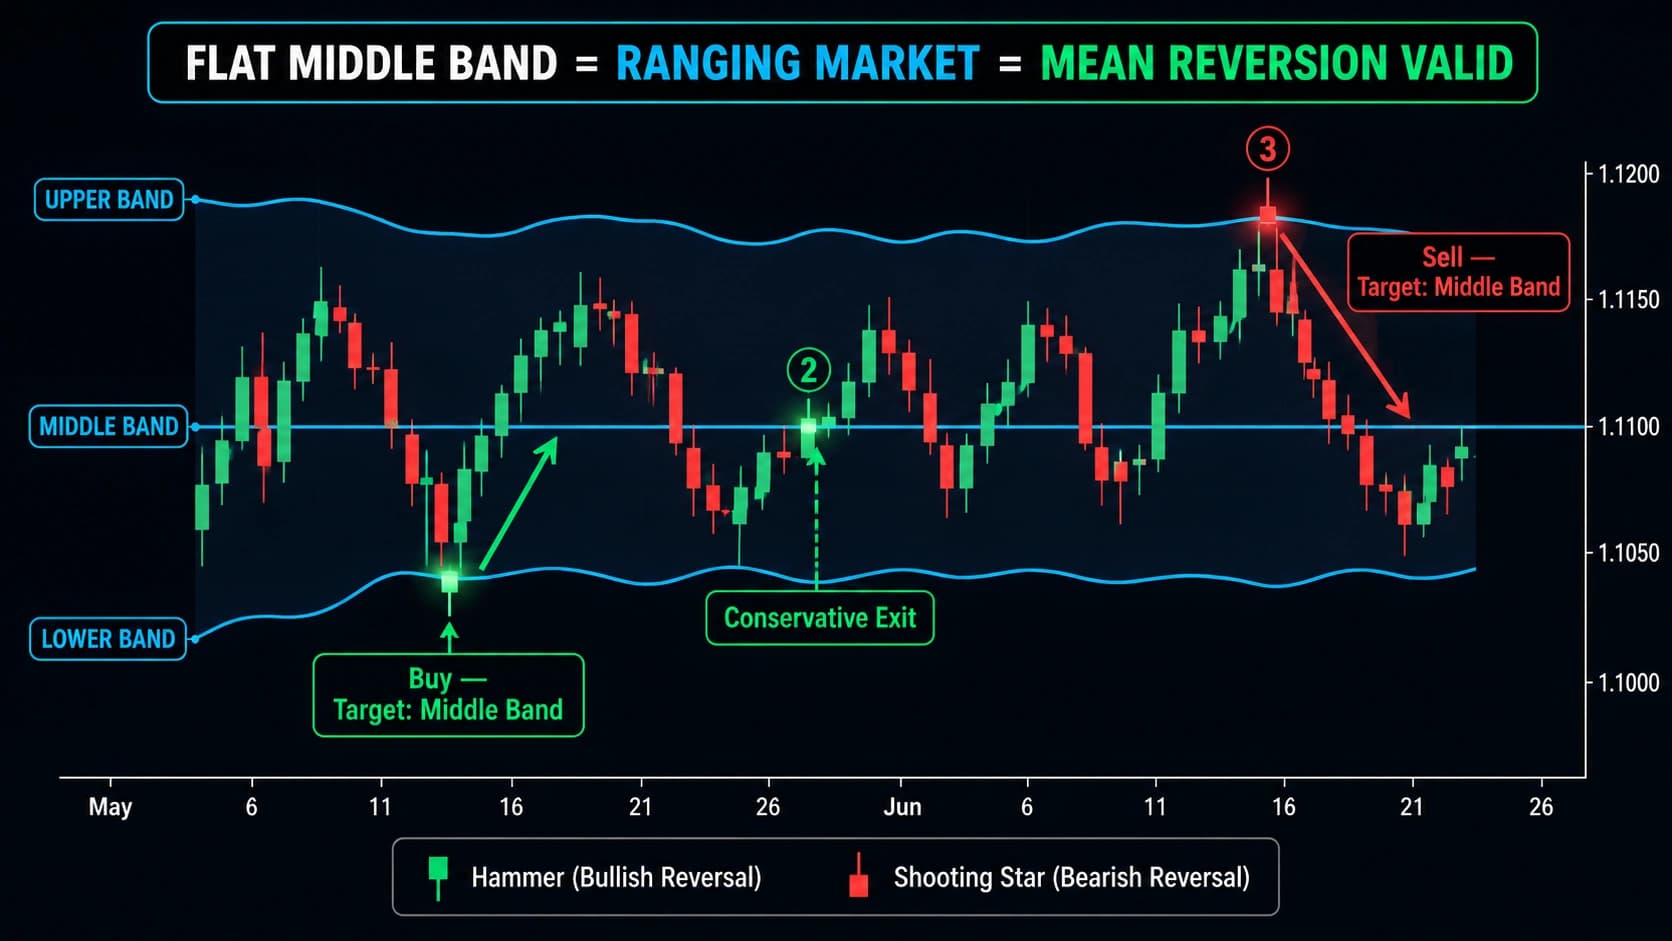
Signal 3 — Mean Reversion (Range Oscillation)
In a ranging market, price oscillates between the upper and lower bands, with the middle band acting as the mean that price returns to.
One characteristic you might notice about Bollinger Bands is that price often tends to return to the middle band, treating the lower and upper bands as areas of support and resistance, respectively.
The mean reversion pattern:
- Price touches the lower band — buy signal (expect return to middle band)
- Price touches the upper band — sell signal (expect return to middle band)
- Middle band is the target for both
Critical requirement: Mean reversion ONLY works in ranging markets. Applying it in a trending market produces consistent losses. The bands tell you which regime you are in — a flat middle band = range; a sloping middle band = trend.
Part 4: How to Set Up Bollinger Bands on Your Charts
TradingView Setup (Recommended)
- Open any NSE stock chart (5-minute for intraday, daily for swing)
- Click Indicators at the top
- Search "Bollinger Bands" and select the built-in indicator
- In Settings, verify:
- Length: 20
- Multiplier (Std Dev): 2.0
- Source: Close
- Enable the middle band, upper band, and lower band (all should be on by default)
- Optionally, add a second set of bands at 1.0 standard deviation for the Double Bollinger strategy
Adding BBW (BandWidth):
- Indicators → Search "Bollinger Bands Width"
- Add as a separate panel below the price chart
- Set period to 20, multiplier to 2
- Optionally add a moving average of BBW to identify when it is at historical lows
Zerodha Kite Setup
- Open chart → Indicators → Bollinger Bands
- Default settings (20, 2) apply
- The three bands appear on the chart automatically
- Add RSI (14) in a separate panel below for confluence
Visual Interpretation Rules
Once Bollinger Bands are on your chart, read the following at a glance:
Are the bands expanding or contracting?
- Expanding — volatility increasing — trend may be developing
- Contracting — volatility decreasing — Squeeze forming, prepare for breakout
Where is the middle band sloping?
- Sloping upward — uptrend context — trade bullish setups
- Sloping downward — downtrend context — trade bearish setups
- Flat — ranging context — trade mean reversion
Where is price relative to the bands?
- Above upper band — extreme bullish momentum (trend) or overbought reversal (range)
- Below lower band — extreme bearish momentum (trend) or oversold bounce (range)
- Touching lower band from above, reversing — potential buy in range
- Near middle band — mean area — potential support/resistance
Part 5: Five Complete Bollinger Bands Trading Strategies
Strategy 1 — The Bollinger Squeeze Breakout (The Most Powerful Setup)
The Squeeze breakout is the highest-reward Bollinger Bands strategy because it captures the beginning of a new major move from a point of maximum compression. The longer and tighter the Squeeze, the more explosive the ensuing breakout tends to be.
Setup identification:
Step 1 — Identify the Squeeze: BBW drops to its lowest level in 6+ months AND the middle band is flat (not sloping). Visually, the bands are as narrow as they have been in recent history — price has been coiling tightly.
Step 2 — Confirm the Squeeze is still active: Price is making tight, small candles within the band range. Volume is declining during the squeeze (building compression, not leaking direction).
Step 3 — Determine potential breakout direction: The Squeeze itself is directionally neutral — it tells you a move is coming, not which way. Use these additional signals to gauge direction:
- Higher timeframe trend: If the daily chart is bullish, the breakout is more likely upward
- RSI during the squeeze: RSI above 50 = bullish bias; below 50 = bearish bias
- Volume divergence: Aggressive buying volume inside the Squeeze = bullish directional bias
- Candlestick structure: Are the candles within the Squeeze making higher lows (bullish) or lower highs (bearish)?
Step 4 — Enter on the breakout: Enter on the first candle that closes outside the bands after the Squeeze. For a bullish breakout: first candle that closes above the upper band. For a bearish breakout: first candle that closes below the lower band.
Do not enter mid-candle — wait for the candle to fully close outside the band. A close outside confirms the breakout; a mere wick is insufficient.
Squeeze breakout entry: Bandwidth contracts to 6-month low, price closes outside upper or lower band on rising volume — enter in the direction of the breakout on the close or the next open.
Stop Loss: For bullish breakout: below the middle band (the 20-period SMA) at the time of entry. The middle band is the mean — if price falls back below it immediately after a bullish breakout, the breakout has failed.
Target: Measure the width of the Squeeze range (the distance from the highest to lowest price during the Squeeze period). Project this distance upward from the breakout point — this is the minimum expected move.
Example — NSE Stock: An NSE large-cap stock has been consolidating in a ₹50 range for 15 sessions. BBW reaches its lowest level in 8 months. Volume has been declining during the consolidation. RSI is at 55 (mild bullish bias). On Day 16, a large green candle closes above the upper Bollinger Band with volume 2.3× the 20-day average.
- Entry: ₹520 (close of the first breakout candle)
- Stop: ₹498 (below the middle band at breakout)
- Risk: ₹22
- Target: ₹570 (Squeeze range ₹50 projected above ₹520)
- Risk-Reward: 2.27:1 ✓
Warning: The most common Squeeze breakout mistake is entering on every tight period regardless of whether BBW has truly reached multi-month lows. Many "squeezes" are simply normal low-volatility periods, not the genuine compressions that precede explosive moves. Track BBW actively — only trade the Squeeze when BBW is at its lowest point in 6+ months.
Strategy 2 — Band Walk (Trend Following)
The Band Walk strategy captures sustained trending moves by entering when price begins to ride along the outer band — and staying in the trade as long as the band walk continues.
Setup identification:
- Price has recently broken out of a significant resistance level or a Squeeze
- The first candle closes above the upper band (or below the lower band for a bearish walk)
- The middle band begins sloping in the direction of price
- Volume is above average on the breakout candle and the initial band-walk candles
- RSI is above 60 (bullish walk) or below 40 (bearish walk)
Entry rule: Enter the first pullback to the middle band after the initial band walk begins. Do NOT chase the price when it is riding the outer band — wait for the mean reversion to the 20-period middle band, which provides a lower-risk entry within the established trend.
Band walk: Price closes above upper band with ADX above 25; enter on first pullback to the 20-period moving average.
Why the middle band pullback entry is optimal: When price pulls back from the upper band to the middle band in a bullish band walk, the middle band often acts as dynamic support (it is the 20 SMA — a widely watched moving average). Entering at the middle band gives you a tighter stop (below the middle band) and more room to run to the upper band and beyond.
Stop Loss: Below the middle band by 0.2–0.3% for large-cap NSE stocks. If price closes below the middle band after entering, the band walk has likely ended.
Target: The upper band (first target in a bullish walk). Then continue trailing the stop below each new higher swing low as long as price remains above the middle band.
Managing the trade: Trail the stop below the middle band throughout the band walk. As the bands expand upward (because of increasing volatility in the trend), your stop moves with the middle band. Exit the trade when price closes below the middle band — the band walk is over.
Strategy 3 — Mean Reversion (Range Oscillation)
The Mean Reversion strategy is the most straightforward Bollinger Bands strategy — and the one most traders incorrectly apply to trending markets, producing consistent losses.
This strategy works ONLY in ranging, sideways markets.
Setup identification:
- Middle band is flat (not sloping) — confirming range-bound conditions
- Price has oscillated between the upper and lower bands at least 2–3 times (confirming the range is established)
- The range's upper boundary aligns with the upper Bollinger Band
- The range's lower boundary aligns with the lower Bollinger Band
Bullish Mean Reversion trade:
When the stock touches or moves below the lower band and shows signs of reversing back upward:
Condition 1: Price touches or slightly pierces the lower Bollinger Band Condition 2: RSI is below 40 (or below 30 for stronger confirmation) Condition 3: A bullish candlestick pattern forms at the lower band (Hammer, Bullish Engulfing) Condition 4: The next candle begins moving back inside the bands (price acceptance above lower band)
Entry: At the close of the first candle that moves back inside the lower band (or at the bullish confirmation candle) Stop: Below the lower band low (the most recent wick that pierced the band) Target: The middle band (conservative exit) or the upper band (full mean reversion target)
HDFC Bank example: HDFC Bank is trading in a range between ₹1,200 and ₹1,300. When the stock touches the lower band near ₹1,200, it indicates oversold conditions and suggests a potential bounce. Entry at this level with a stop-loss slightly below ₹1,190. As the price moves upward, exit at the middle band around ₹1,250 for a conservative 4% gain, or hold until the upper band at ₹1,300 for an 8% return.
Critical warning: Do NOT apply mean reversion when the middle band is sloping (trending market). In a trending market, price touching the lower band while the bands are wide and expanding means the trend is continuing aggressively — buying here puts you directly against institutional momentum. Confirm the middle band is flat before every mean reversion trade.
Strategy 4 — Double Bollinger Bands (The Zone Strategy)
The Double Bollinger Bands strategy uses two sets of Bollinger Bands simultaneously — one at 2 standard deviations and one at 1 standard deviation — to create three distinct trading zones.
Setup: Add a second set of Bollinger Bands at 1.0 standard deviation (keeping the default 2.0 SD bands also on the chart). This creates four boundary lines:
- Upper 2.0 SD band
- Upper 1.0 SD band
- Lower 1.0 SD band
- Lower 2.0 SD band
These four lines divide the chart into four zones relative to the middle band:
The "Buy Zone" (between Upper 1.0 SD and Upper 2.0 SD): When price is in this zone — above the 1 SD band but below the 2 SD band — the uptrend is strong. Price is elevated but not at the extreme. The current uptrend is strong — this confirms long positions.
The "Neutral Zone" (between Upper 1.0 SD and Lower 1.0 SD): Price is near the mean. Neither buyers nor sellers have extreme momentum. Avoid new trend-following entries here; wait for price to move into the Buy or Sell Zone.
The "Sell Zone" (between Lower 1.0 SD and Lower 2.0 SD): Price is depressed but not at the extreme. In a downtrend, this confirms the bearish move. This implies the current downtrend is strong.
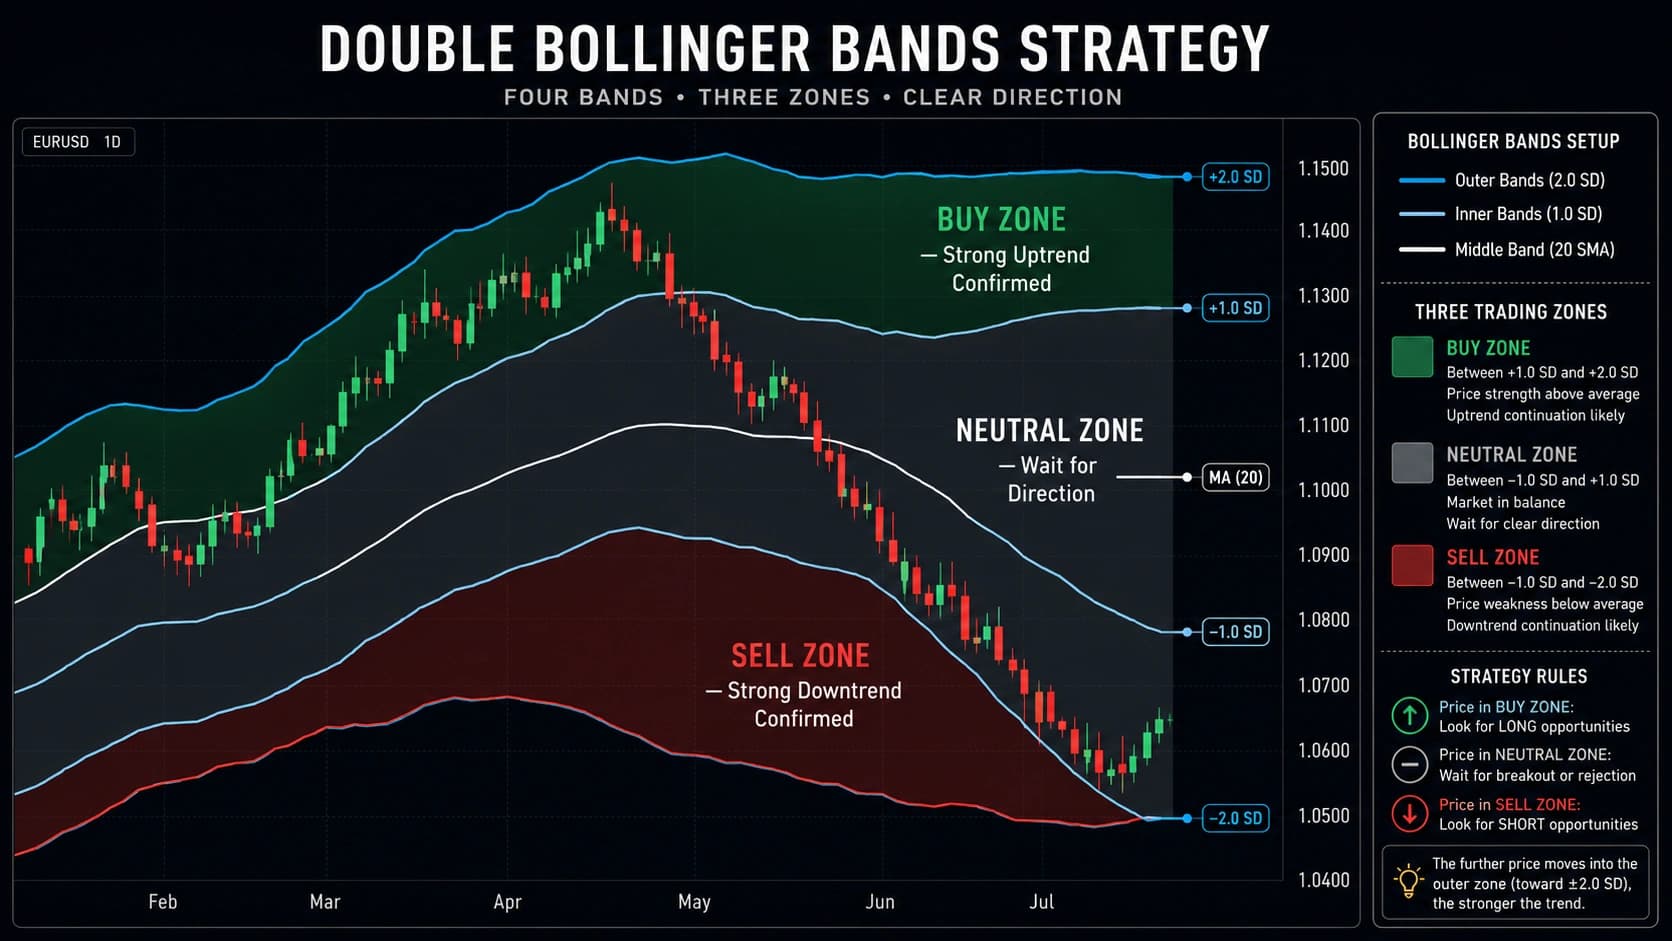
Trading the zones:
Long entry: Price enters the Buy Zone (between 1 SD and 2 SD upper bands) from the Neutral Zone → enter long → hold while price remains in the Buy Zone → exit when price falls back into the Neutral Zone
Short entry: Price enters the Sell Zone (between 1 SD and 2 SD lower bands) from the Neutral Zone → enter short → hold while price remains in the Sell Zone → exit when price rises back into the Neutral Zone
The Double Bollinger advantage: This strategy reduces whipsaws compared to trading at the outer 2 SD band alone. By entering when price crosses from neutral into the zone (not when it reaches the extreme band), you enter earlier in the move with a more defined exit (when price returns to neutral).
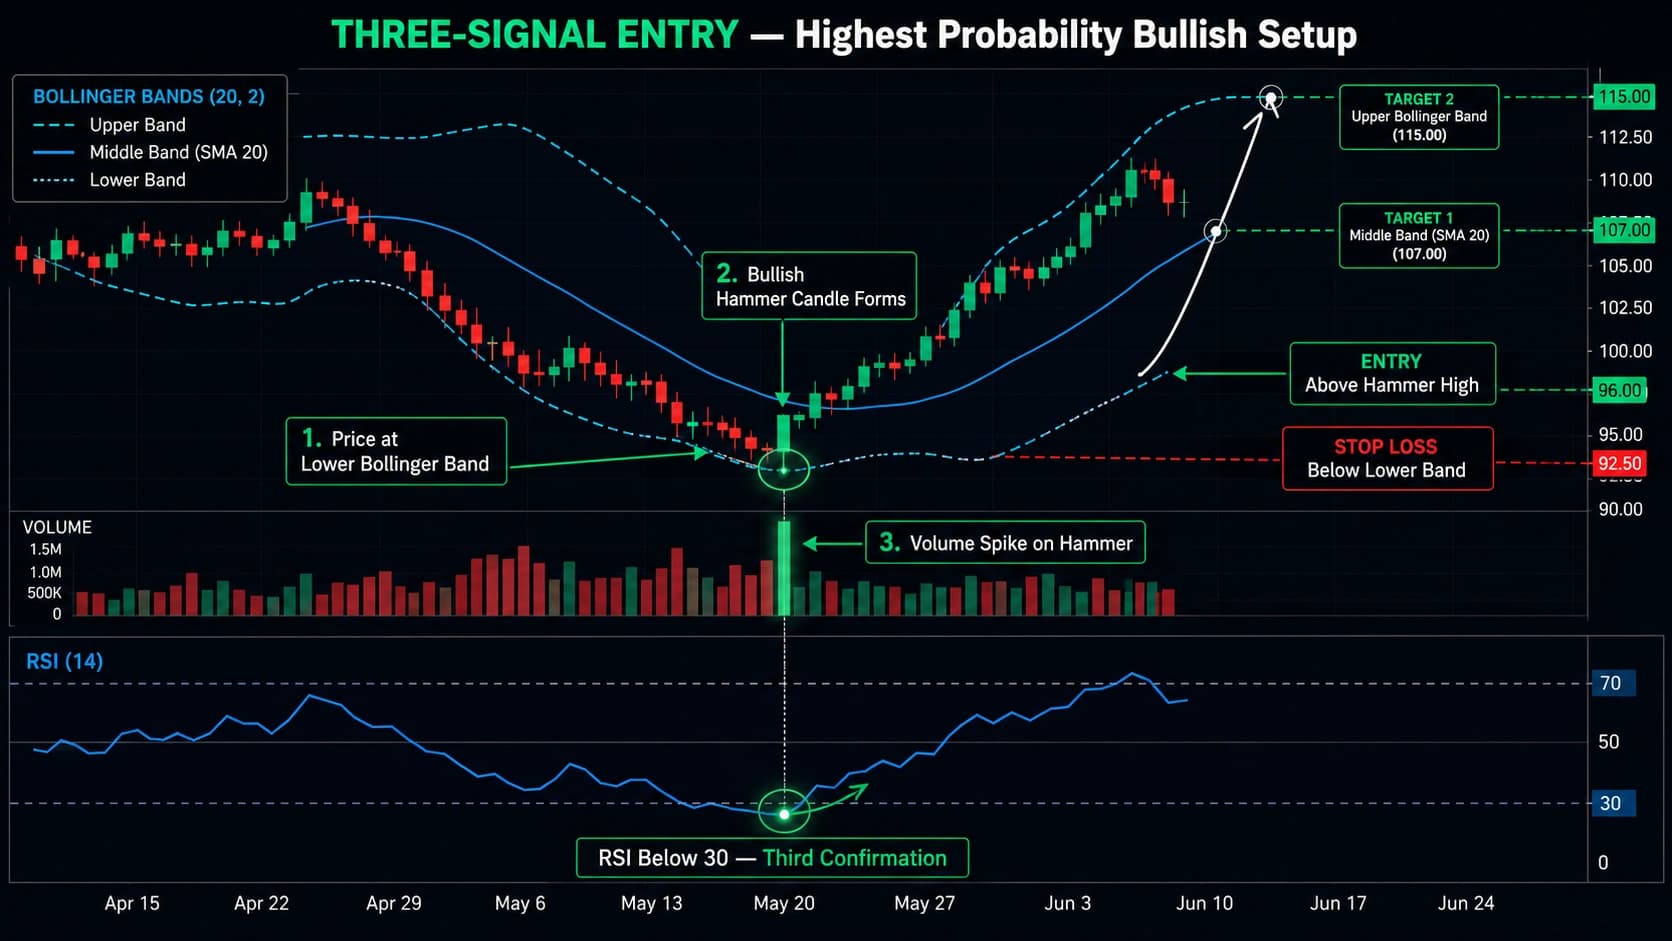
Strategy 5 — RSI + Bollinger Bands (The Confluence Strategy)
Combining RSI with Bollinger Bands creates the most reliable Bollinger Bands strategy for Indian intraday traders. The Bollinger Bands provide the volatility-based price context; RSI provides the momentum confirmation.
Pairing RSI with Bollinger Bands as a confirmation layer consistently produces results above either indicator alone, while significantly reducing false signals.
Bullish RSI + Bollinger Bands entry:
Condition 1 — Bollinger Bands: Price touches or closes at/below the lower Bollinger Band
Condition 2 — RSI: RSI is below 40 (or below 30 for extreme oversold confirmation) AND turning upward from the low
Condition 3 — Candlestick: A bullish candlestick pattern forms at the lower band (Hammer, Bullish Engulfing, Morning Star)
Condition 4 — Location: The lower band touch coincides with a significant support level (prior swing low, round number, moving average)
Entry: At the close of the confirming bullish candlestick Stop: Below the lower band wick low (0.2% buffer) Target: The middle band (conservative) or the upper band (aggressive mean reversion)
Bearish RSI + Bollinger Bands entry:
Price pushes into resistance on a weak move, RSI prints above 70, and price closes back below resistance with a strong red candle. If a bearish engulfing pattern forms in that zone (at the upper Bollinger Band), the confluence of three signals makes for a compelling short entry. Target: the 20-period SMA (middle Bollinger Band) or lower band.
Condition 1: Price at or above upper Bollinger Band Condition 2: RSI above 70 (overbought) and turning downward Condition 3: Bearish candlestick pattern at upper band (Shooting Star, Bearish Engulfing) Condition 4: At a resistance level
Entry: At the close of the confirming bearish candle Stop: Above the upper band wick high Target: Middle band (20 SMA) then lower band
NSE intraday application: On the 5-minute chart, when price compresses below the lower Bollinger Band during the morning session (9:30–10:00 AM), RSI is below 35, and a Hammer forms at VWAP intersection — that is a three-indicator confluence (BB lower band + RSI oversold + VWAP support) producing a high-probability bounce entry for the 10:00–11:00 AM distribution phase.
Part 6: Bollinger Bands for NSE — India-Specific Application
Nifty and Bank Nifty
Default (20, 2) works well on 5-minute and 15-minute timeframes for Nifty, Bank Nifty, and liquid F&O stocks.
For Bank Nifty: Due to its higher volatility (daily ATR 1.5–2× Nifty's), standard 2 SD bands are touched more frequently. Use (20, 2.5) or (20, 3.0) to reduce false band-touch signals. Only flag Band Walk and extreme Mean Reversion signals — smaller touches become noise.
For Nifty Futures (intraday): (20, 2) on the 15-minute chart is the standard. The Squeeze setup is particularly reliable on Nifty because the index has defined volatility cycles — low-volatility consolidation phases (pre-RBI meetings, pre-Budget) followed by explosive directional moves (post-announcement).
The Nifty Squeeze pattern: Before major events (RBI Policy, Union Budget, US Fed decisions), Nifty often enters a Squeeze phase on the 15-minute or hourly chart. BBW contracts to multi-day lows as institutional players wait for the event. After the announcement, one direction is chosen explosively. The Bollinger Squeeze entry (first candle close outside the band after the event) captures this post-event directional move.
Individual NSE Stocks
For Nifty 50 large-cap stocks (Reliance, HDFC Bank, TCS, Infosys):
- Daily (20, 2) for swing trading — clean signals due to deep institutional participation
- 5-minute (20, 2) for intraday — the high liquidity produces reliable band touches and squeezes
- Mean reversion works particularly well on highly liquid stocks in consolidation phases
For mid-cap stocks:
- Daily (20, 2) remains standard but expect more false signals due to lower institutional participation
- Require stricter volume confirmation on breakouts — minimum 2× average on breakout candle
- The Squeeze setup is less reliable on thin-volume mid-caps — a "squeeze" may simply reflect lack of interest rather than institutional compression
Part 7: Bollinger Bands Mistakes and Exact Fixes
Mistake 1 — Treating Every Upper Band Touch as a Sell Signal
The most common and most expensive Bollinger Bands error. Price touches the upper band in a strong uptrend and the trader shorts, expecting mean reversion. Instead, price continues walking the upper band for 10 more sessions while the short accumulates losses.
The fix: Check the middle band slope before any band-touch trade. Middle band sloping upward = uptrend = price touching the upper band is CONTINUATION, not reversal. Only use band touches as reversal signals when the middle band is FLAT (range context). In trends, trade with the band walk, not against it.
Mistake 2 — Trading the Squeeze Without Confirming Direction
The BBW reaches a 6-month low, the Squeeze setup is active — and the trader enters long simply because they are "in the buy zone." The breakout goes the other way and produces a significant loss.
The fix: The Squeeze tells you WHEN a move is coming, not WHICH direction. Before the Squeeze resolves, check: (1) higher timeframe trend, (2) RSI above or below 50 within the Squeeze, (3) volume patterns showing directional bias inside the Squeeze. Only enter AFTER the first candle closes outside the bands — not in anticipation of direction.
Mistake 3 — Mean Reversion in Trending Markets
Buying the lower band touch in a downtrend. The trend continues aggressively, price walks the lower band, and the long position turns into a deep loss as the "oversold" stock continues falling.
The fix: Before any mean reversion trade, confirm the middle band is flat. A sloping middle band = trending market = mean reversion does not apply. Walk away from band touches in trends — they are continuation signals, not reversal opportunities.
Mistake 4 — Using Bollinger Bands Alone
Building an entire trading strategy on Bollinger Bands without any confirmation from RSI, volume, or candlestick patterns. Bollinger Bands show RELATIVE price extremes — they don't tell you whether those extremes will reverse.
The fix: Always confirm Bollinger Bands signals with at least one other tool. The most reliable combinations: BB + RSI (momentum), BB + Volume (institutional confirmation), BB + Candlestick (timing precision). Multiple confirming signals transform a BB extreme from an interesting observation into a tradeable edge.
Mistake 5 — Entering Mid-Candle on the Breakout
Seeing price spike above the upper band on the breakout candle and entering immediately — before the candle closes. The candle wicks back inside the band and closes below the upper band — a false breakout. The position is now losing.
The fix: Never enter mid-candle on a Bollinger Band breakout. Wait for the candle to fully close outside the band. Only a candle close outside the band confirms the breakout is real, not just a brief spike. One additional minute or day of patience eliminates a large percentage of false breakout entries.
Mistake 6 — Not Adjusting Settings for Instrument Volatility
Using the default (20, 2) settings on Bank Nifty — a high-volatility instrument — producing too many false band touches and unreliable signals.
The fix: Adjust the standard deviation multiplier based on the instrument's volatility. For high-volatility instruments (Bank Nifty, high-beta mid-caps), use 2.5 or 3.0 standard deviations to ensure band touches are genuinely extreme. For lower-volatility instruments (defensive large-caps, bond futures), the standard 2.0 may produce too few signals — try 1.5.
Part 8: Trending vs Ranging Markets — The Critical Context
Like RSI, Bollinger Bands behave completely differently in trending and ranging markets. Misidentifying the regime is the source of most Bollinger Bands losses.
How to identify the regime using Bollinger Bands:
| Indicator | Trending Market | Ranging Market |
|---|---|---|
| Middle band | Sloping (up or down) | Flat or nearly flat |
| Band width | Wide and expanding | Narrow and contracting |
| Price behaviour | Walking along one band | Oscillating between both bands |
| RSI | Sustained above 60 or below 40 | Oscillating between 30 and 70 |
What to do in each regime:
Trending market: Use the Band Walk strategy. Enter on pullbacks to the middle band in the direction of the trend. Do not use mean reversion. The Squeeze may develop at the end of a trend — watch for it.
Ranging market: Use the Mean Reversion strategy. Buy lower band touches, sell upper band touches. Watch for the Squeeze developing — it signals the range is about to end with a breakout.
Transitioning market (Squeeze to trend): Use the Squeeze Breakout strategy. The compression phase is ending; a new trend is beginning. Enter on the first confirming candle close outside the bands.
FAQ
Q: What is the Bollinger Bands trading strategy? Bollinger Bands trading uses three dynamic lines — a 20-period SMA (middle band) and upper/lower bands at ±2 standard deviations — to identify volatility-based trading opportunities. The three primary setups are: (1) Squeeze Breakout — bands contract to multi-month lows before an explosive directional move; (2) Band Walk — price rides the outer band in a strong trend; (3) Mean Reversion — price oscillates between bands in a range. Each strategy applies to a different market regime.
Q: What does the Bollinger Band Squeeze mean? The Bollinger Band Squeeze occurs when the bands contract to their narrowest width in 6+ months, signalling that volatility has compressed and a major directional move is imminent. The Squeeze is detected visually (bands very close together) or quantitatively (Bollinger BandWidth indicator at a multi-month low). The Squeeze does not predict direction — it predicts magnitude. Enter on the first candle that closes outside the bands after the Squeeze, with direction confirmed by RSI, higher timeframe trend, and volume.
Q: What are the best Bollinger Bands settings for NSE stocks? The default (20, 2) — 20-period SMA, 2 standard deviations — works well for most NSE instruments on 5-minute, 15-minute, and daily charts. For Bank Nifty, which has higher volatility, use 2.5 or 3.0 standard deviations to reduce false band touches. For scalping on 1-minute charts, reduce the period to 10–15. For weekly position trading, use 50 periods with 2.5 standard deviations.
Q: Does touching the upper Bollinger Band mean I should sell? No — in a strong uptrend, price can walk along the upper band for extended periods while continuing to rise. Selling every upper band touch in a trending market is one of the most expensive Bollinger Bands mistakes. Upper band touches are potential sell signals ONLY in ranging markets where the middle band is flat. In trending markets, upper band touches indicate strong bullish momentum and the correct response is to trail your stop, not exit or short.
Q: How do I use Bollinger Bands with RSI? The most reliable RSI + Bollinger Bands setup: price touches the lower band (Bollinger signal) AND RSI is below 40 (momentum confirmation) AND a bullish candlestick forms at the lower band (timing confirmation). Enter at the candlestick close with stop below the band wick low and target at the middle band or upper band. For shorts: price at upper band + RSI above 70 + bearish candlestick = highest-confidence short entry. The triple confluence significantly outperforms either indicator alone.
Q: What is the Bollinger Band mean reversion strategy? Mean reversion using Bollinger Bands: in a ranging market (flat middle band, price oscillating between bands), buy when price touches or pierces the lower band and reversal signs appear, targeting the middle band or upper band. Sell when price reaches the upper band with reversal signs, targeting the middle band. This strategy fails in trending markets — always confirm the middle band is flat before applying mean reversion.
Conclusion
Bollinger Bands are one of the most versatile technical indicators available to traders — precisely because they capture three different market conditions (compression, trending, and ranging) with a single tool.
The key to using them profitably is matching the right strategy to the right market regime:
Squeeze = imminent explosion. When BBW reaches a 6-month low and bands contract tightly, a major move is building. Don't enter during the Squeeze — enter on the first confirmed candle close outside the bands, in the direction indicated by higher timeframe context and RSI.
Band walking = trend continuation. When price rides the outer band with the middle band sloping, the trend is exceptionally strong. Do not fight it with mean reversion trades. Enter on pullbacks to the middle band and trail your stop.
Flat bands = mean reversion. When the middle band is flat and price oscillates between the bands, buy the lower band, sell the upper band. Exit at the middle band (conservative) or the opposite band (aggressive). The moment the middle band begins sloping, this strategy no longer applies.
Three principles to carry forward:
1. Identify the regime before choosing the strategy. Middle band flat — mean reversion. Middle band sloping + bands expanding — band walk. Bands at 6-month lows — Squeeze breakout. This single discipline eliminates most Bollinger Bands losses.
2. Never act on a band touch alone. Pair Bollinger Band signals with RSI, volume, or a candlestick confirmation. Two aligned signals from independent sources create genuine trading edges.
3. Never enter mid-candle on a Squeeze breakout. The candle must close outside the band to confirm the breakout is real. Patience of one candle eliminates the majority of false breakout entries.
Further reading: RSI Trading Strategy: Complete Guide | Support and Resistance: The Complete Trading Guide | Important Candlestick Patterns: The Complete Guide | How to Trade Intraday Stocks in India | Volume Analysis Trading Strategy | Technical Analysis Mastery: The Complete Guide | Dhanith Intraday Screener | Smart Money Concepts: The Complete Mastery Guide | Order Blocks: The Complete Mastery Guide | 5 Best Intraday Trading Strategies for NSE India
Ready to Trade These Signals on Real Stocks?
→ Open the Dhanith Intraday Screener — find today's NSE stocks where Bollinger Bands and VWAP align for high-probability setups
→ Calculate Your Risk Before Every BB Trade — know your exact share count, stop distance, and maximum loss before you enter
→ Log Your BB Trades in the Dhanith Journal — track which strategies and confirmation patterns produce your best win rate
Disclaimer: This article is for educational purposes only and does not constitute financial or investment advice. Trading involves significant risk of capital loss. Past performance does not guarantee future results. Always use proper risk management.
Have a question about this article?
Comment on our latest Instagram post or send us a DM — we reply to every one.
@dhanith_officialWas this article helpful?
Click to rate
Founder, Dhanith Trading
7+ years trading Nifty, Bank Nifty, NSE stocks, and commodities — specializing in Smart Money Concepts (SMC) and ICT price action. Founder of Dhanith — a trading journal, intraday screener, and risk tools platform built for retail traders.
Dhanith Newsletter
Enjoyed this article? Get more like it.
New trading guides, candlestick patterns, SMC strategies, and tool updates — straight to your inbox. Free, for Indian traders.
No spam. Unsubscribe anytime.
Continue Reading