On this page
- Introduction
- What Is the Flag and Pole Pattern?
- Why Does the Flag and Pole Pattern Form?
- How to Identify the Pole
- How to Identify the Flag
- Bull Flag vs Bear Flag: Side-by-Side Comparison
- How to Trade the Flag and Pole Pattern
- Entry
- Stop Loss
- Measured Move Target
- Flag and Pole Pattern Examples
- Example 1 — NSE India: Bank Nifty Intraday Bull Flag
- Example 2 — Crypto: Ethereum (ETH/USDT)
- Common Flag and Pole Mistakes — And How to Fix Them
- Final Thoughts
- FAQ
- Related Articles
Learn how to identify and trade the flag and pole pattern. Bull flag, bear flag, entry rules, stop loss, measured move target — with NSE, crypto & US examples.
Introduction
Every trader has experienced this: a stock, crypto, or index makes a sharp, explosive move upward in just a few candles — strong volume, clean momentum, the kind of move that makes you wish you had been positioned for it. Then it pauses. Price drifts sideways or pulls back slightly, volume dries up, and the whole thing looks like it might be reversing.
It is not reversing. In many cases, it is reloading.
This is what the flag and pole pattern looks like in real markets — one of the most reliable, most widely traded continuation patterns in technical analysis. It appears across NSE stocks, Bitcoin, and US equities with the same structure and the same psychology, and properly identified and traded, it carries a documented success rate of 65–72% according to 2026 trading data.
This guide covers everything: what the pattern is and why it forms, how to identify the pole and the flag separately, the difference between a bull flag and a bear flag, exactly how to enter, where to stop, how to calculate your target using the measured move, and three complete worked examples from the Indian market, crypto, and the US market.
What Is the Flag and Pole Pattern?
The flag and pole pattern is a continuation chart pattern consisting of two parts:
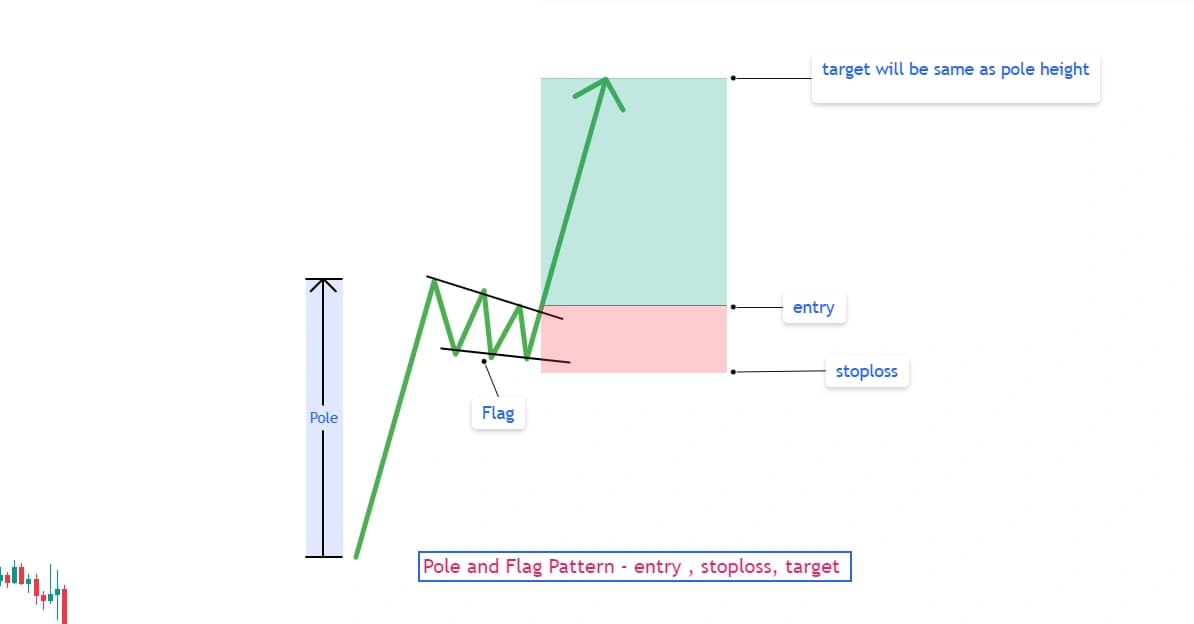
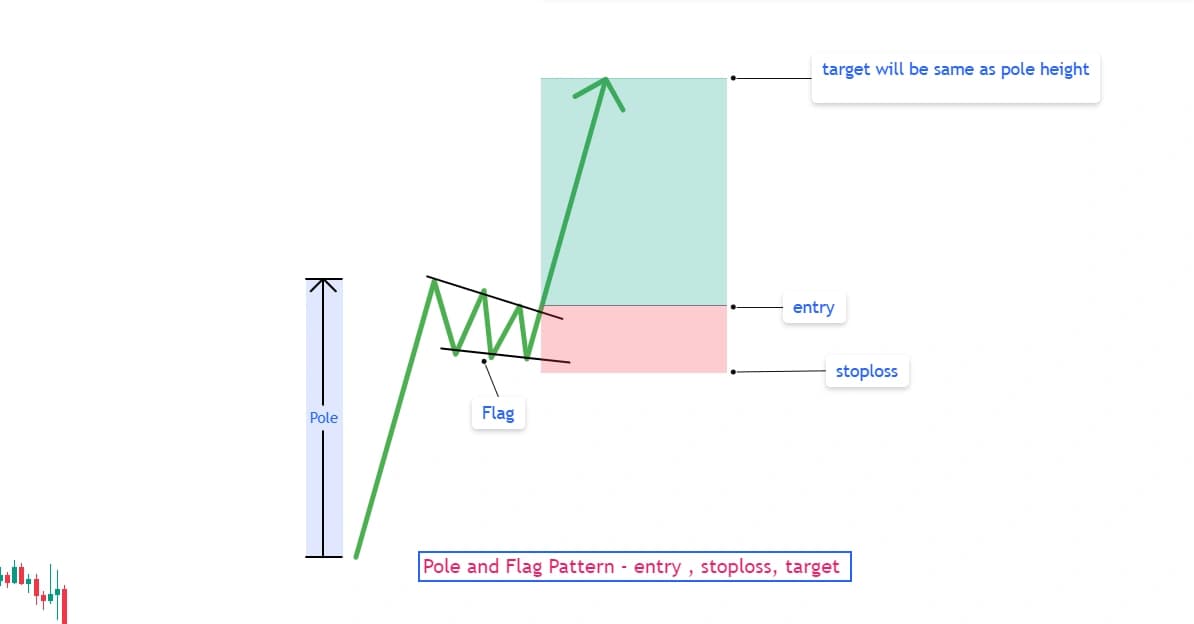
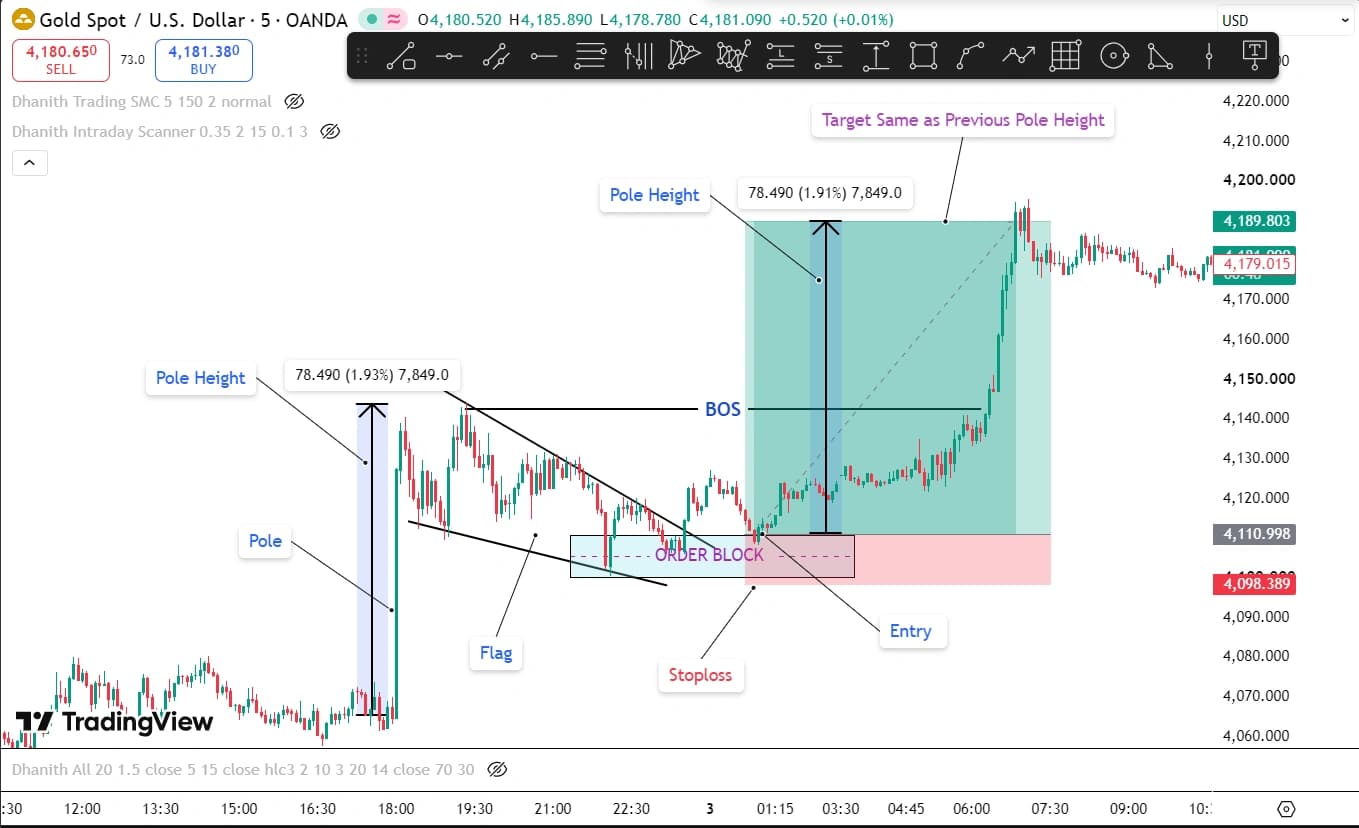
The Pole: A sharp, nearly vertical price move — upward for a bull flag, downward for a bear flag — driven by strong buying or selling pressure, typically on high volume. This sudden move is the flagpole.
The Flag: A brief, controlled consolidation that follows the pole, forming a small rectangular or slightly tilted channel where price drifts mildly against the pole's direction before breaking out to continue the original trend.
The name comes directly from its visual appearance — a steep pole with a small, gently angled flag hanging from the top. The entire structure signals one clear idea: a strong trend paused briefly to catch its breath, and is now ready to resume.
Two versions:
- Bull Flag: Pole is upward, flag drifts slightly downward, breakout resumes upward
- Bear Flag: Pole is downward, flag drifts slightly upward, breakdown resumes downward
Why Does the Flag and Pole Pattern Form?
Understanding the psychology makes you a significantly better pattern trader, because it lets you evaluate whether a real flag is forming or whether you are just looking at random consolidation.
During the pole: A sudden surge in price is driven by genuine conviction — a news catalyst, a technical breakout from a longer base, or a momentum squeeze that forces short sellers to cover rapidly. This is a moment of genuine one-sided control by either buyers or sellers.
During the flag: Early buyers from the pole begin taking profits — they got in before the big move and are now exiting into strength. This profit-taking creates a controlled, orderly pullback. Simultaneously, a new group of buyers is waiting for exactly this pullback to enter at a better price than the pole's top. The result is a temporary equilibrium: sellers (profit-takers) and buyers (dip-buyers) roughly balanced, which is why volume contracts and the range narrows.
At the breakout: The profit-takers exhaust themselves. The dip-buyers who have been accumulating during the flag overwhelm the remaining sellers. The original trend resumes — often with the same or greater momentum than the pole itself.
For the flag to be valid, the pullback during the flag should not go back more than half the distance of the flagpole. If it lasts too long — usually more than three weeks — it might signal that the trend is actually reversing rather than continuing.
How to Identify the Pole
Not every sharp move qualifies as a valid pole. A tradeable flagpole has four specific characteristics:
1. Steep angle: The pole should be a near-vertical move on the chart — visually distinct from the surrounding price action, not a gentle slope. A steeper and more decisive flagpole indicates a stronger trend and makes the entire pattern more reliable.
2. High volume during formation: During the formation of the flagpole, volume increases. During the consolidation phase, the volume decreases indicating a slowdown of trading activity. Volume increases again during the breakout, confirming the continuation.
3. Short duration: The pole forms quickly — typically 1 to 5 candles on daily charts, or 3 to 8 candles on intraday charts. A slow, gradual climb over many sessions is a trend, not a pole.
4. A clear catalyst (often): Many poles are triggered by identifiable news — strong earnings, a sector breakout, a policy announcement, an index rebalancing event. A catalyst-backed pole carries more genuine institutional momentum than a purely technical move on thin volume.
Measuring the pole: Measure from the pole's starting point (where the sharp move began) to the pole's end (where consolidation begins). This measurement becomes your target projection later.
How to Identify the Flag
Once the pole is confirmed, the flag must meet these specific criteria:
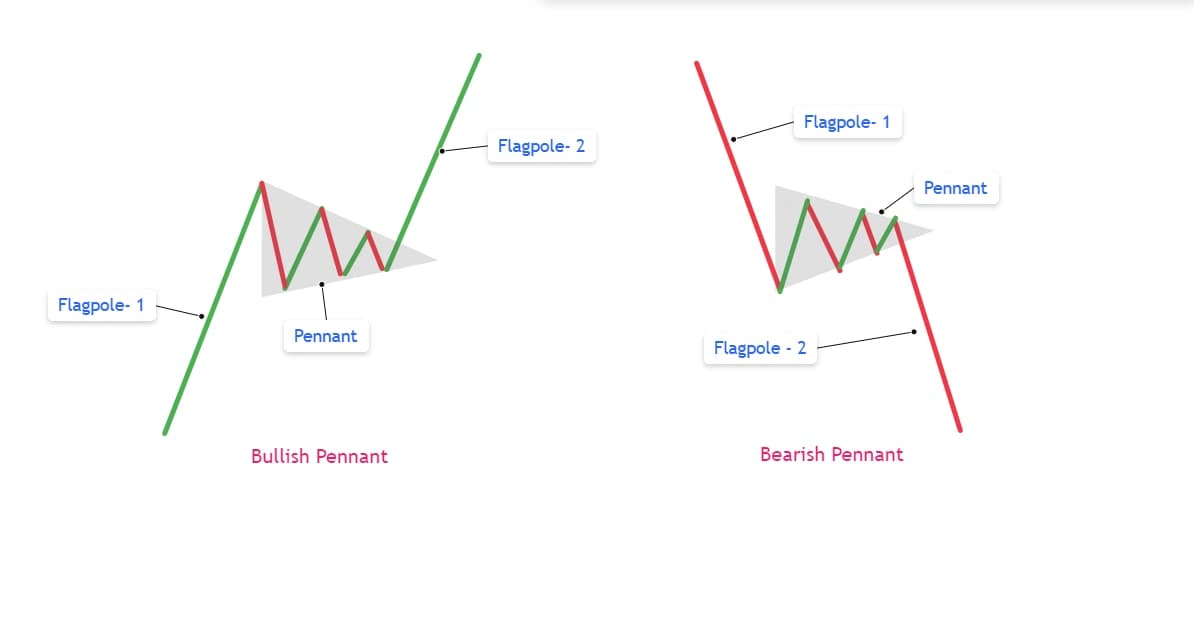
Parallel trendlines: The consolidation must be bounded by two roughly parallel lines. If the lines are converging, you have a pennant, not a flag — a closely related but technically distinct pattern with slightly different rules.
Slopes against the pole direction: A bull flag's channel drifts slightly downward. A bear flag's channel drifts slightly upward. A completely horizontal channel is also acceptable. What is not acceptable: a channel drifting in the same direction as the pole (that would be a continuation of the trend itself, not a consolidation).
Shallow retracement: It is considered a sign of weakness if the stock retraces more than 50% of the initial move. Most high-quality flags retrace only 20–40% of the pole before breaking out.
Volume contracts: If the volume during the consolidation is higher than the initial move up, it indicates selling pressure. Volume should visibly decline through the flag's formation — this contraction is the single most important confirmation that the pullback is healthy profit-taking, not genuine reversal.
Duration: 1 to 4 weeks maximum: A flag that drags on too long loses its character. Limit trades to flags lasting one to four weeks for daily charts, or proportionally less for intraday charts.
Bull Flag vs Bear Flag: Side-by-Side Comparison
| Feature | Bull Flag | Bear Flag |
|---|---|---|
| Pole direction | Sharp move UP | Sharp move DOWN |
| Flag direction | Drifts slightly DOWN | Drifts slightly UP |
| Breakout direction | UP (above upper trendline) | DOWN (below lower trendline) |
| Volume on pole | High | High |
| Volume in flag | Declining | Declining |
| Volume on breakout | Expanding | Expanding |
| Entry trigger | Close above upper flag boundary | Close below lower flag boundary |
| Stop loss | Below flag low | Above flag high |
| Target formula | Breakout price + pole height | Breakdown price − pole height |
How to Trade the Flag and Pole Pattern
Entry
Standard breakout entry: Wait for a candle to close above the upper flag trendline (bull flag) or below the lower flag trendline (bear flag), with volume expanding on the breakout candle. This is the most widely used and most reliable entry approach.
Retest entry (higher confidence, slightly later): After the breakout candle closes, some traders wait for price to pull back and retest the broken trendline from the other side — where former resistance becomes support (bull flag) or former support becomes resistance (bear flag). Entering on this retest with a confirming candlestick gives a tighter stop and better risk-reward, at the cost of missing fast-moving breakouts that never retest.
Stop Loss
Place the stop loss just beyond the flag's opposite boundary:
- Bull flag: Stop below the flag's lowest point (the lowest low formed during the consolidation)
- Bear flag: Stop above the flag's highest point (the highest high formed during the consolidation)
Always set a stop-loss below the flag's opposite boundary — for bull flags, or above it for bear flags — to manage downside exposure.
A useful additional rule: if the stock breaks the 9-period Exponential Moving Average or the Volume Weighted Average Price (VWAP), it is considered a sign of weakness — treat this as an early exit signal even before the formal stop is hit.
Measured Move Target
Bull Flag Target  = Breakout Price + Pole Height
Bear Flag Target  = Breakdown Price − Pole Height
Measure the pole from its starting point to its end, then project that exact distance forward from the breakout point. This is the measured move — the pattern's own built-in price target.
Some traders use a partial target approach: take half the position off at 50% of the measured move, then trail the rest toward the full target with a moving average or structure-based stop.
Flag and Pole Pattern Examples
Example 1 — NSE India: Bank Nifty Intraday Bull Flag
On a 15-minute chart during a bullish NSE session, Bank Nifty rises sharply from 51,200 to 51,850 in six candles — a 650-point pole on volume 2.3x the 20-period average. The pole is steep, clean, and clearly visible on the chart.
Bank Nifty then enters a bull flag: a gently descending channel between 51,750 and 51,600, lasting four candles (one hour). Volume contracts sharply during the flag — each successive candle's volume is smaller than the last. Price stays above VWAP throughout the flag's formation, confirming the intraday institutional bias remains bullish.
On the fifth candle, Bank Nifty closes at 51,870 — above the upper flag trendline — on volume 1.9x the 20-period average.
Entry:          51,870 (breakout candle close)
Stop Loss:      51,590 (just below flag low)
Risk:           280 points

Pole Height:    51,850 − 51,200 = 650 points
Target:         51,870 + 650 = 52,520

Reward:         650 points
Risk-Reward:    650 ÷ 280 = 2.3:1
VWAP note: The entire bull flag consolidation formed while Bank Nifty stayed above VWAP. Flags forming above VWAP (for bullish setups) or below VWAP (for bearish setups) carry higher probability — they confirm that the institutional intraday bias aligns with the flag's expected breakout direction.
Example 2 — Crypto: Ethereum (ETH/USDT)
On the 4-hour chart, Ethereum surges from $2,800 to $3,350 in 10 candles — a $550 pole on visibly elevated volume. The catalyst: a major network upgrade announcement driving genuine buying interest.
ETH forms a bull flag: a slight downward-drifting channel between $3,280 and $3,180, lasting 8 candles (32 hours). Volume contracts steadily. The flag retraces approximately 31% of the pole — within the healthy 20–40% range.
On the ninth candle, ETH closes at $3,295 above the upper flag boundary, with volume expanding to 2.1x the recent average.
Entry:          $3,295
Stop Loss:      $3,165 (below flag low)
Risk:           $130

Pole Height:    $3,350 − $2,800 = $550
Target:         $3,295 + $550 = $3,845

Reward:         $550
Risk-Reward:    $550 ÷ $130 = 4.2:1
Crypto-specific note: On crypto, the best bull flags tend to appear early in a momentum cycle — when the coin is making its first or second major breakout from a base, not the fifth or sixth. The later the run and the more consolidations you have, the less likely a bull flag is to perform well — the asset could be getting tired. The best bull flags occur at the start of a new uptrend.
Common Flag and Pole Mistakes — And How to Fix Them
Mistake 1 — Entering before the breakout confirms. Buying inside the flag — anticipating the breakout — results in being caught in false moves that temporarily reverse before eventually breaking out. Fix: Always wait for a full candle close beyond the flag's boundary with volume confirmation before entering.
Mistake 2 — Accepting a flag that retraces more than 50% of the pole. Deep retracements signal genuine selling pressure rather than healthy profit-taking. The setup loses its continuation character when the flag erases more than half of what the pole created. Fix: If the flag retraces more than 50%, skip the setup or demand significantly stronger breakout volume as additional confirmation.
Mistake 3 — Trading flags in sideways markets. Flag patterns are more reliable in strong and trending markets compared to sideways or choppy markets. A flag-like consolidation in the middle of a range-bound, directionless market is just noise — not a genuine continuation setup. Fix: Confirm the broader trend is clearly directional before treating any consolidation as a flag.
Mistake 4 — Ignoring the volume signature. A breakout on average or below-average volume has a meaningfully higher false-breakout rate. Patterns lacking proper volume confirmation generate false breakouts approximately 43% more frequently, according to 2026 trading data. Fix: Never enter a flag breakout unless the breakout candle's volume is visibly above recent average — aim for at least 1.5–2x the 20-period average.
Mistake 5 — Holding a flag that lasts too long. A flag that extends beyond three to four weeks has likely transitioned into a different pattern — a rectangle, a triangle, or a genuine range — where the simple measured-move continuation expectation no longer applies reliably. Fix: Set a time-based exit rule: if the flag has not resolved within the expected duration for your timeframe, exit and reassess.
Final Thoughts
The flag and pole pattern works across markets and timeframes because it encodes something real: genuine momentum pauses, distributes gains from early participants to new buyers, and then resumes. This cycle repeats from the 5-minute Bank Nifty chart to the weekly Bitcoin chart to the daily NVIDIA chart.
Three things to remember for every flag trade:
1. The pole's quality determines the flag's potential. A steep, high-volume, catalyst-backed pole produces a more reliable flag and a more powerful breakout than a shallow, low-conviction move mislabeled as a pole. Evaluate the pole first, always.
2. Volume is the only confirmation that matters. The price shape alone — a rectangular channel drifting against the trend — is not enough to call something a tradeable flag. Volume must contract through the flag and expand at the breakout. Without this, the pattern is unconfirmed.
3. The 50% retracement rule is your quality filter. Flags retracing less than 50% of the pole represent healthy, controlled profit-taking. Beyond 50%, genuine selling pressure is overcoming the buying conviction the pole established. Skip those setups.
Disclaimer: This blog is for educational purposes only and is not investment advice. Trading chart patterns involves substantial risk of capital loss. Past performance of any pattern does not guarantee future results. Always use proper risk management including stop-loss orders and defined position sizing before entering any trade.
FAQ
Q: What is the flag and pole pattern in trading? The flag and pole pattern is a continuation chart pattern consisting of two parts: a sharp, steep directional price move (the pole) followed by a brief, controlled consolidation within parallel trendlines (the flag) that drifts mildly against the pole's direction. When price breaks out of the flag in the same direction as the original pole, the trend typically resumes with comparable momentum. It appears in both bullish (bull flag) and bearish (bear flag) versions across stocks, crypto, and forex markets.
Q: What is the difference between a bull flag and a bear flag? A bull flag forms after a sharp upward move and consists of a consolidation that drifts slightly downward before breaking out upward to resume the uptrend. A bear flag forms after a sharp downward move and consists of a consolidation that drifts slightly upward before breaking down to resume the downtrend. Both patterns are continuation signals — the direction of the pole determines the direction of the expected breakout.
Q: How do you calculate the price target for a flag and pole pattern? Measure the height of the pole — the price distance from where the sharp move started to where it ended. For a bull flag, add this height to the breakout price (where price closes above the upper flag trendline). For a bear flag, subtract this height from the breakdown price. This is the measured move target.
Q: How deep should a flag retrace before it becomes invalid? A flag retracing more than 50% of the pole's height is considered a sign of weakness — it suggests the pullback represents genuine selling pressure rather than healthy profit-taking. Most high-quality flags retrace only 20–40% of the pole. A flag retracing beyond 50% should be skipped or treated with significant additional skepticism.
Q: How long should a flag pattern last? For daily chart setups, a flag should resolve within one to four weeks. For intraday setups (15-minute, 1-hour charts), the duration scales proportionally — an intraday flag might last just 2 to 8 hours. A consolidation that extends beyond the expected duration for its timeframe has likely transitioned into a different pattern where the simple continuation expectation may not apply.
Q: Does the flag pattern work on intraday NSE charts? Yes — the flag and pole pattern is one of the most commonly traded intraday setups on NSE, particularly on Bank Nifty and high-momentum individual stocks during active sessions. For intraday use, confirm the flag's position relative to VWAP: bull flags forming above VWAP carry higher probability since they align with the session's institutional bias. The same five identification rules apply on intraday charts, just compressed to a shorter time scale.
Related Articles
- Cup and Handle Pattern: How to Identify and Trade It — Sibling continuation pattern with the same measured-move logic
- Head and Shoulders Pattern: How to Identify & Trade — The bearish reversal counterpart, useful contrast with this continuation setup
- Pennant Pattern: How to Identify Bull & Bear Pennant — Pennant is the converging-triangle version of a flag — closely related
- Volume Analysis: The Complete Trading Guide — Volume confirmation is the most critical element in every flag setup
- Support and Resistance: The Complete Trading Guide — Flag boundaries act as dynamic temporary S/R zones
- Best Online Trading Journal — Track every flag trade to identify your edge across different setups
Have a question about this article?
Comment on our latest Instagram post or send us a DM — we reply to every one.
@dhanith_officialWas this article helpful?
Click to rate
Founder, Dhanith Trading
7+ years trading Nifty, Bank Nifty, NSE stocks, and commodities — specializing in Smart Money Concepts (SMC) and ICT price action. Founder of Dhanith — a trading journal, intraday screener, and risk tools platform built for retail traders.
Dhanith Newsletter
Enjoyed this article? Get more like it.
New trading guides, candlestick patterns, SMC strategies, and tool updates — straight to your inbox. Free, for Indian traders.
No spam. Unsubscribe anytime.
Continue Reading