On this page
- Introduction
- What Is the Cup and Handle Pattern?
- Why Does the Cup and Handle Pattern Form?
- How to Identify the Cup and Handle Pattern: The 5-Rule Filter
- Rule 1 — A Prior Uptrend of At Least 30% Must Exist
- Rule 2 — The Cup Must Be Rounded, Not V-Shaped
- Rule 3 — Cup Depth Should Be 12–33% of the Prior High
- Rule 4 — Handle Depth Must Not Exceed One-Third of the Cup
- Rule 5 — Volume Must Confirm Every Stage
- How to Trade the Cup and Handle Pattern
- Entry: Three Valid Approaches
- Stop Loss Placement
- Price Target: The Measured Move
- Cup and Handle Pattern Examples — NSE India, Crypto, and USA
- Example 1 — NSE India: Nifty 50 Large-Cap Stock
- Example 2 — Crypto: Bitcoin (BTC/USDT)
- Example 3 — USA: NVIDIA (NVDA)
- Common Cup and Handle Pattern Mistakes — And How to Fix Them
- Cup and Handle vs Inverted Cup and Handle
- Final Thoughts
- FAQ
- Related Articles
Learn how to identify and trade the cup and handle pattern with real examples from NSE India, Bitcoin, and NVIDIA. Entry, stop loss, and target rules explained.
Introduction
There is a chart pattern that William O'Neil — one of the greatest stock market researchers of the 20th century — called one of his highest-performing technical setups. He introduced it in his landmark 1988 book How to Make Money in Stocks, and it has been one of the most widely tracked bullish continuation patterns in technical analysis ever since.
It is called the cup and handle pattern, and once you learn to see it correctly, you will find it on NSE stocks, Bitcoin, and US equities alike — same structure, same psychology, same trade rules, just different price scales.
This guide covers everything: what the pattern actually looks like and why it forms, the five identification rules that filter out weak setups from genuinely tradeable ones, exactly how to enter, where to place your stop loss, how to calculate your price target, and three complete worked examples — one from the Indian market, one from crypto, and one from the US market — so you can apply this immediately across whichever market you trade.
What Is the Cup and Handle Pattern?
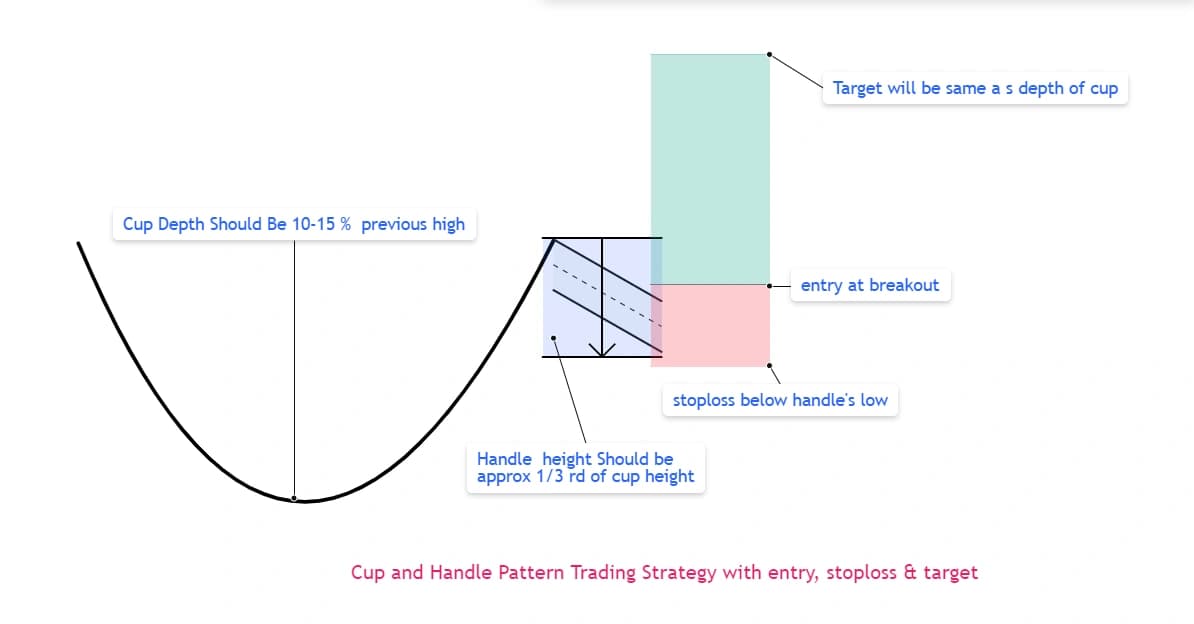
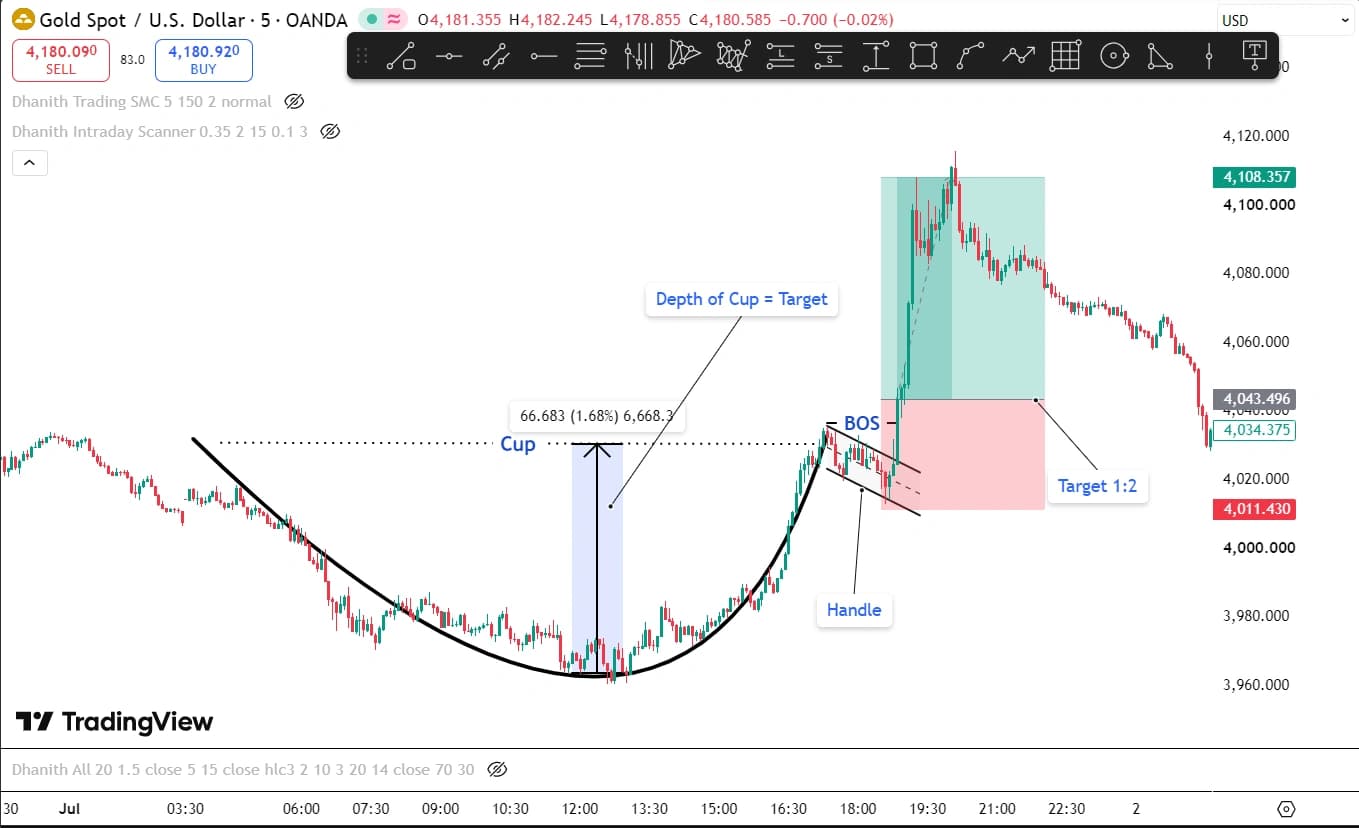
The cup and handle is a bullish continuation chart pattern. It forms when a stock or asset that has been in an uptrend pulls back into a rounded, U-shaped consolidation (the cup), recovers back toward its prior high, and then makes one final small pullback (the handle) before breaking out to continue the original uptrend.
The pattern gets its name from its visual appearance — it genuinely resembles a teacup when drawn on a chart: a wide, curved bowl shape with a smaller dip attached to the right side.
The three structural components:
1. The Prior Uptrend: The pattern only qualifies as a continuation pattern if a meaningful uptrend already exists before the cup begins forming. Without this, the rounded bottom is a reversal pattern (or just random consolidation), not a genuine cup and handle setup.
2. The Cup: A gradual, rounded decline followed by an equally gradual recovery back toward the original high. The key word is rounded — a sharp V-shaped recovery is a different, less reliable structure. The cup represents institutional accumulation: smart money quietly buying during the pullback, with volume drying up at the base and gradually increasing on the right side as buyers regain control.
3. The Handle: After the cup's right side recovers to near the prior high, price makes one final, shallow pullback — the handle. This represents the last wave of profit-taking by early buyers before the breakout. The handle should be small, controlled, and stay in the upper half of the cup. A deep handle that retraces more than one-third of the cup's height is a red flag — it signals excess supply rather than normal profit-taking.
Why Does the Cup and Handle Pattern Form?
Understanding the psychology behind the pattern is more valuable than just memorising the shape, because it lets you judge the quality of any real-world setup you encounter.
When a stock that has been trending higher pulls back from a peak, early buyers begin taking profits. This selling creates the left side of the cup. As the selling exhausts itself, the stock bases — often for several weeks — at the cup's low. This is where institutional accumulation occurs quietly: large buyers building positions without dramatically pushing the price.
As buyers gradually overcome sellers, price recovers up the right side of the cup. When it approaches the prior high, a new wave of selling appears — traders who bought at the old high and are now back at breakeven want to exit. This creates the handle: a final, controlled pause near resistance.
Once those breakeven sellers have been absorbed, the path of least resistance is upward. The breakout above the handle's resistance represents buyers having fully overwhelmed the remaining supply — and the original uptrend resumes, often with significant momentum.
How to Identify the Cup and Handle Pattern: The 5-Rule Filter
Applying all five of these rules before trading any cup and handle eliminates roughly 70% of false setups — leaving only the high-probability configurations.
Rule 1 — A Prior Uptrend of At Least 30% Must Exist
The pattern requires a prior uptrend. Without an existing advance to consolidate, there is no continuation, no cup, and no valid setup. The general benchmark is a minimum 30% advance before the cup begins.
A rounded bottom that appears after an extended downtrend — with no meaningful prior uptrend — is a reversal pattern, not a cup and handle. It may still be tradeable, but under completely different analytical rules.
Rule 2 — The Cup Must Be Rounded, Not V-Shaped
The cup should have a smooth, gradual curvature at the bottom — not a sharp spike down followed by an equally sharp spike up. V-shaped recoveries imply unstable, unresolved price action. The rounded base reflects genuine, patient accumulation over time, which is what gives the eventual breakout its staying power.
The minimum reliable cup duration on daily charts is approximately 7 weeks (William O'Neil's original specification). Cups completing faster than this are usually noise rather than genuine institutional accumulation.
Rule 3 — Cup Depth Should Be 12–33% of the Prior High
The cup's decline — from its starting high down to the lowest point of the base — should be meaningful but not excessive. The ideal range is 12–33% below the prior high. Within this range, the pullback represents healthy consolidation rather than a trend breakdown.
Cups deeper than 33% can still be valid in volatile markets or on longer timeframes, but they require extra confirmation (stronger breakout volume, cleaner handle structure) before trading.
Rule 4 — Handle Depth Must Not Exceed One-Third of the Cup
The handle should retrace no more than approximately one-third of the cup's total height, and it must form in the upper half of the cup's overall range.
Example:
Cup forms between ₹99 and ₹100 (cup height = ₹1)
Ideal handle depth = ₹0.33 or less (one-third of ₹1)
Handle should stay above ₹99.67 — never below ₹99.50
A handle that extends into the lower half of the cup shows excessive selling pressure and significantly reduces the probability of a successful breakout.
Rule 5 — Volume Must Confirm Every Stage
Volume behavior across the three stages of the pattern is one of the strongest confirmation tools available:
- Left side of the cup: Volume declines as early profit-taking exhausts itself
- Base of the cup: Volume reaches its lowest point — the quietest accumulation phase
- Right side of the cup: Volume gradually increases as institutional buying builds
- Handle: Volume contracts again — a final, quiet consolidation before the move
- Breakout candle: Volume expands sharply — at minimum 40% above the 50-day average, ideally significantly more
A breakout on weak volume is one of the most reliable early warning signs of a false breakout. Never enter a cup and handle breakout without confirming that the breakout candle's volume is meaningfully above average.
How to Trade the Cup and Handle Pattern
Entry: Three Valid Approaches
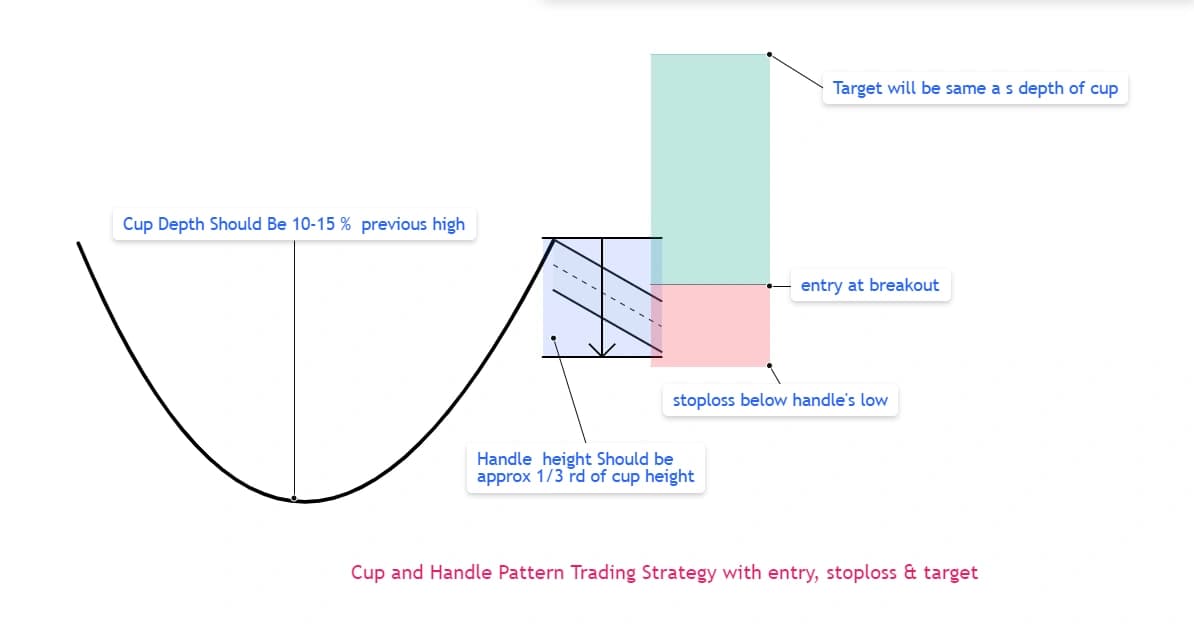
Approach 1 — Classic Breakout Entry (Most Common): Wait for price to close above the handle's resistance level (the high formed during the handle's consolidation) on expanding volume. Enter at the close of that breakout candle. This is the safest, most widely used approach.
Approach 2 — Handle Bounce Entry (Earlier, Tighter Risk): Enter when price bounces off the handle's lower trendline rather than waiting for the full breakout above resistance. This gives a tighter stop loss and a better risk-reward ratio — but it requires the handle to show at least two clear touches of its lower boundary before the bounce is reliable.
Approach 3 — Stop-Buy Order (Automated): Place a buy-stop order slightly above the handle's resistance. The order only triggers if price actually breaks that level — you don't need to watch the screen in real time. This is useful for swing traders who cannot monitor live.
Stop Loss Placement
Standard (tighter): Just below the handle's lowest point. If price falls back below the handle, the pattern has failed and the thesis is invalidated.
Conservative (wider): Below the cup's low — the absolute lowest point of the entire pattern. This gives the trade more room to survive a retest, but produces a lower risk-reward ratio.
For most setups, the standard stop (below the handle low) is the appropriate choice. The conservative stop is only justified when the cup and handle is exceptionally large and well-formed on a weekly chart, and the expected target is proportionally large.
Price Target: The Measured Move
Cup Depth = Cup's starting high − Cup's lowest point

Target = Breakout price + Cup Depth
This is the same measured-move methodology used across most continuation patterns — the pattern's own height projected forward from the breakout point.
Some traders use a more conservative target approach: instead of projecting the full cup depth, they use the nearest significant supply zone (horizontal resistance) above the breakout as the exit target. This often captures a more reliable, immediately available profit rather than waiting for the full measured-move projection.
Cup and Handle Pattern Examples — NSE India, Crypto, and USA
Example 1 — NSE India: Nifty 50 Large-Cap Stock
A Nifty 50 large-cap stock has been in a clear uptrend, rising from ₹1,200 to ₹1,650 over four months — a 37.5% advance, satisfying Rule 1.
The stock then pulls back into a rounded cup formation over six weeks, declining from ₹1,650 to a base of ₹1,420 — a 13.9% retracement, within the ideal 12–33% Rule 3 range. Volume declines steadily through the left side and base of the cup, and increases gradually on the right-side recovery back toward ₹1,640. The cup is rounded — no sharp V-shape.
The handle forms as a two-week, tight descending channel between ₹1,640 and ₹1,610 — a retracement of just ₹30 against a cup height of ₹230, well within the one-third Rule 4 threshold. Volume contracts sharply during the handle.
On day fifteen of the handle, price closes at ₹1,652 — above the handle's resistance — on volume 2.1x the 50-day average.
Entry:          ₹1,652 (breakout candle close)
Stop Loss:      ₹1,608 (below handle low, with small buffer)
Risk per share: ₹44

Cup Depth:      ₹1,650 − ₹1,420 = ₹230
Target:         ₹1,652 + ₹230 = ₹1,882

Reward:         ₹1,882 − ₹1,652 = ₹230
Risk-Reward:    ₹230 ÷ ₹44 = 5.2:1
VWAP addition for intraday traders: If trading this on the 15-minute chart within the breakout session, confirm the breakout candle is also reclaiming and holding above VWAP. A cup and handle breakout that simultaneously clears the handle's resistance and reclaims VWAP provides dual institutional confirmation — both the pattern signal and the session's volume-weighted reference aligning together.
Example 2 — Crypto: Bitcoin (BTC/USDT)
Bitcoin has been trending from $52,000 to $71,000 — a 36.5% prior advance satisfying Rule 1.
BTC then forms a cup over nine weeks, declining from $71,000 to a base of $58,500 — a 17.6% retracement within the valid range. The cup is clearly rounded — the decline is gradual, the base spends three weeks in a tight range ($58,500–$60,200), and the recovery back toward $70,500 shows visibly increasing volume as buyers return. All five identification rules are met.
The handle forms as a 10-day symmetrical triangle consolidation between $70,500 and $68,800 — tight, controlled, declining volume. On day eleven, BTC breaks above $70,500 with volume 1.8x the 20-period average.
Entry:            $70,600 (breakout candle close)
Stop Loss:        $68,600 (below handle low)
Risk per unit:    $2,000

Cup Depth:        $71,000 − $58,500 = $12,500
Target:           $70,600 + $12,500 = $83,100

Reward:           $83,100 − $70,600 = $12,500
Risk-Reward:      $12,500 ÷ $2,000 = 6.25:1
Crypto-specific note: On Bitcoin specifically, the breakout volume confirmation carries extra weight because crypto trades 24/7 — a breakout that occurs during low-liquidity weekend hours on weak volume is statistically more likely to be a false break than one occurring during peak US or Asian session hours. Always check whether the breakout candle's volume represents genuine participation or just thin-market noise before committing.
Example 3 — USA: NVIDIA (NVDA)
NVIDIA forms a textbook cup and handle pattern between September 2025 and January 2026, as documented across multiple analyst reports from that period.
The stock pulls back from a prior high of $140 down to a cup base of approximately $95 — a 32% retracement, at the upper boundary of the valid 12–33% range. The cup forms over approximately 14 weeks. Volume dries up at the base and the right-side recovery shows clear institutional accumulation with progressively rising volume.
The handle forms as a two-week tight consolidation near the $138–$140 zone before the breakout.
The handle breakout occurred on January 15, 2026, with volume 3.2x the 20-day average. The stock closed at $141, above the previous high. From there, it rode toward $165 — measured by the cup depth: $140 − $95 = $45, plus the entry price of approximately $120, giving a target of $165.
Entry:          $141 (breakout candle close)
Stop Loss:      Below handle low (~$136)
Risk per share: ~$5

Cup Depth:      $140 − $95 = $45
Target:         $141 + $45 = $186 (full measured move)
Conservative:   $160 (nearest supply zone, where institutional
                sellers were observed during the move)

Risk-Reward (conservative): $19 ÷ $5 = 3.8:1
Risk-Reward (full move):    $45 ÷ $5 = 9:1
This NVIDIA example also illustrates the supply-line exit strategy: rather than mechanically waiting for the full $186 measured-move target, traders using nearby horizontal resistance ($160) as their exit captured a more immediately available profit — with a still-exceptional 3.8:1 risk-reward — before the stock later pulled back from that zone.
Common Cup and Handle Pattern Mistakes — And How to Fix Them
Mistake 1 — Trading a cup without a prior uptrend. The most common identification error. A rounded bottom after a downtrend is a reversal pattern with different rules. Always confirm the prior advance before calling it a cup and handle.
Mistake 2 — Buying the right rim before the handle forms. Entering at the top of the cup's right side — before the handle has developed — frequently leads to an immediate drawdown as the handle forms. Patience is the fix: wait for the handle to complete, and enter only on the confirmed breakout above handle resistance.
Mistake 3 — Accepting a V-shaped cup. Sharp recoveries represent unstable price action, not genuine accumulation. The minimum reliable cup duration on daily charts is approximately 7 weeks — if the cup completed faster, treat it with significant skepticism.
Mistake 4 — Ignoring volume on the breakout candle. A breakout on average or below-average volume has a meaningfully higher false-breakout rate. If the breakout candle's volume does not expand noticeably above the recent average, wait for the next session's confirmation before entering.
Mistake 5 — Handle too deep. Handles that retrace more than one-third of the cup's height signal excessive selling pressure — the supply overhead has not been adequately absorbed. Skip these setups rather than accepting the lower probability.
Cup and Handle vs Inverted Cup and Handle
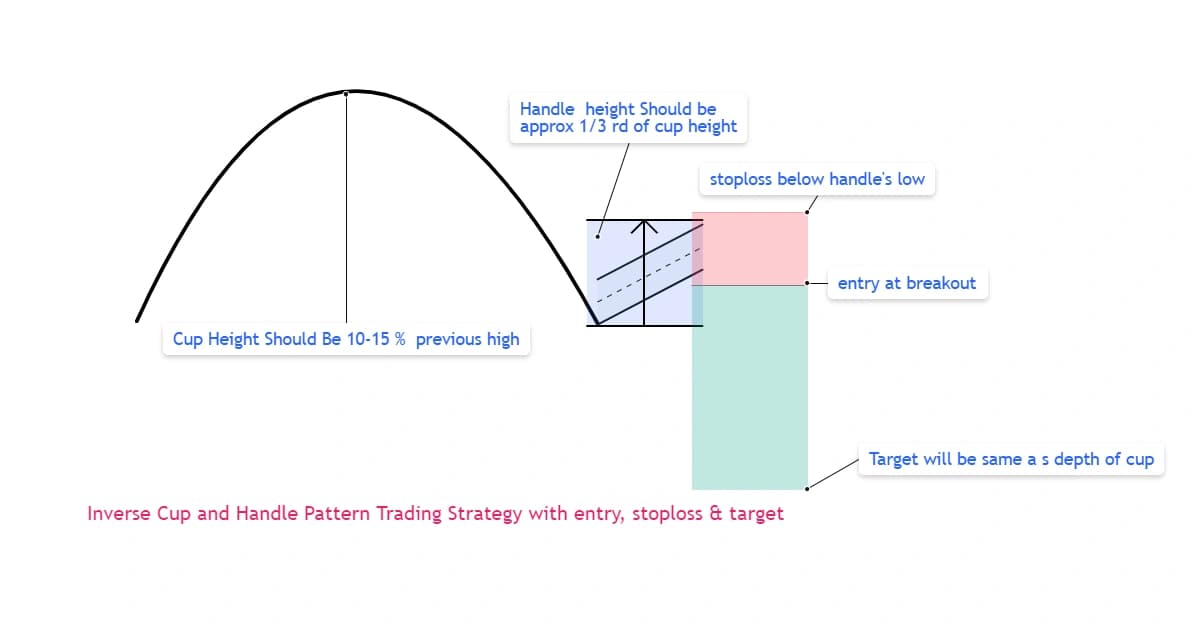
The inverted cup and handle is the exact bearish mirror of the standard pattern. It forms after a downtrend, consists of an inverted U-shaped peak (the inverted cup) followed by a brief upward drift near the bottom of that peak (the inverted handle), and resolves with a breakdown below the handle's support — signaling the continuation of the downtrend.
All the same identification rules apply in reverse: a prior downtrend, a rounded inverted peak (not V-shaped), the handle forming in the lower portion of the inverted cup, volume contracting through the handle, and a breakdown on expanding volume.
The measured-move target for the inverted pattern: subtract the cup depth from the breakdown price (the mirror of adding the cup depth to the breakout price for the bullish version).
Final Thoughts
The cup and handle pattern earns its reputation as one of the most reliable bullish continuation setups precisely because it encodes a clear, reproducible institutional psychology: gradual accumulation during the cup base, a final profit-taking shakeout in the handle, and a volume-confirmed breakout once that last supply has been absorbed.
What separates traders who profit from this pattern consistently from those who do not is almost never the basic shape recognition — it is the discipline to apply all five identification rules before entering, to confirm the breakout with volume, and to exit at the measured-move target rather than holding through the eventual pullback hoping for more.
Three rules to remember every time:
1. No prior uptrend, no trade. The pattern is a continuation setup — without the prior advance, the entire thesis is different.
2. Volume on the breakout candle is non-negotiable. The shape tells you what might happen. The volume tells you whether the market actually believes it.
3. Handle depth is your quality filter. A handle retracing less than one-third of the cup in the upper half of the cup's range signals controlled, healthy consolidation. Beyond that, excess supply is working against you before the trade even begins.
FAQ
Q: What is the cup and handle pattern? The cup and handle is a bullish continuation chart pattern consisting of a rounded, U-shaped pullback (the cup) followed by a shallow, brief consolidation near the prior high (the handle). When price breaks above the handle's resistance on expanding volume, the pattern signals that the prior uptrend is resuming. First documented by William O'Neil in 1988, it is one of the most studied and widely used continuation patterns in technical analysis.
Q: How do you identify a valid cup and handle pattern? A valid cup and handle requires five conditions: a prior uptrend of at least 30%, a rounded (not V-shaped) cup base lasting at minimum 7 weeks on daily charts, a cup depth of 12–33% below the prior high, a handle that does not retrace more than one-third of the cup's height and stays in the upper half of the cup's range, and volume that declines through the cup and handle before expanding sharply on the breakout candle.
Q: Where should you place the stop loss on a cup and handle trade? The standard stop loss goes just below the handle's lowest point — the level at which the pattern's structure is broken and the bullish thesis is invalidated. A more conservative alternative is a stop below the cup's lowest point, which gives the trade more room at the cost of a lower risk-reward ratio.
Q: How do you calculate the price target for a cup and handle? Measure the cup's depth — the distance from the cup's starting high down to its lowest point. Add this full distance to the breakout price (the price at which the candle closes above the handle's resistance). For example, if the cup depth is ₹230 and the breakout occurs at ₹1,652, the measured-move target is ₹1,882.
Q: What is the difference between the cup and handle and inverted cup and handle? The standard cup and handle is a bullish continuation pattern forming after an uptrend, resolving with a breakout to the upside. The inverted cup and handle is the exact bearish mirror — an inverted U-shaped peak followed by a brief upward handle drift, resolving with a breakdown to the downside after a downtrend. The same five identification rules apply in reverse for the inverted version.
Q: Does the cup and handle pattern work on crypto and Indian stocks? Yes — the cup and handle pattern applies across all liquid, actively traded markets including NSE stocks, Bitcoin, and US equities. The same five identification rules apply regardless of market. The primary adjustment needed for crypto is extra attention to breakout timing, since crypto trades 24/7 and breakouts during low-liquidity weekend hours carry a higher false-break rate than those during peak trading sessions.
Disclaimer: This blog is for educational purposes only and is not investment advice. Trading chart patterns involves risk of capital loss. Past performance of any pattern does not guarantee future results. Always use proper risk management including stop-loss orders and position sizing before entering any trade.
Related Articles
- Head and Shoulders Pattern: How to Identify & Trade — The bearish reversal counterpart to this bullish continuation setup
- Flag and Pole Pattern: How to Identify and Trade It — Sibling continuation pattern with the same measured-move logic
- Pennant Pattern: How to Identify Bull & Bear Pennant — Another continuation pattern with a tighter, converging consolidation
- Volume Analysis: The Complete Trading Guide — Volume confirmation is central to every cup and handle entry
- Best Online Trading Journal — Track every cup and handle trade to build pattern-recognition data
Have a question about this article?
Comment on our latest Instagram post or send us a DM — we reply to every one.
@dhanith_officialWas this article helpful?
Click to rate
Founder, Dhanith Trading
7+ years trading Nifty, Bank Nifty, NSE stocks, and commodities — specializing in Smart Money Concepts (SMC) and ICT price action. Founder of Dhanith — a trading journal, intraday screener, and risk tools platform built for retail traders.
Dhanith Newsletter
Enjoyed this article? Get more like it.
New trading guides, candlestick patterns, SMC strategies, and tool updates — straight to your inbox. Free, for Indian traders.
No spam. Unsubscribe anytime.
Continue Reading