
Nifty Prediction for Today (July 17, 2026): 24,160–24,220 Resistance Holds the Key
Previous Close
24,072.75
Support
24,008 / 23,930
Resistance
24,160 / 24,313
Nifty closed Thursday, July 16, 2026 at 24,072.75, down just 5.75 points (-0.02%). The index opened firmer, rallied to a session high of 24,186, then faded through the afternoon to close almost flat — a round-trip day that once again stalled just under the 24,160–24,220 resistance band. Bias: range-bound, with 24,008–24,020 support and 24,160–24,220 resistance defining the box for Friday.
Today's Price Action Recap
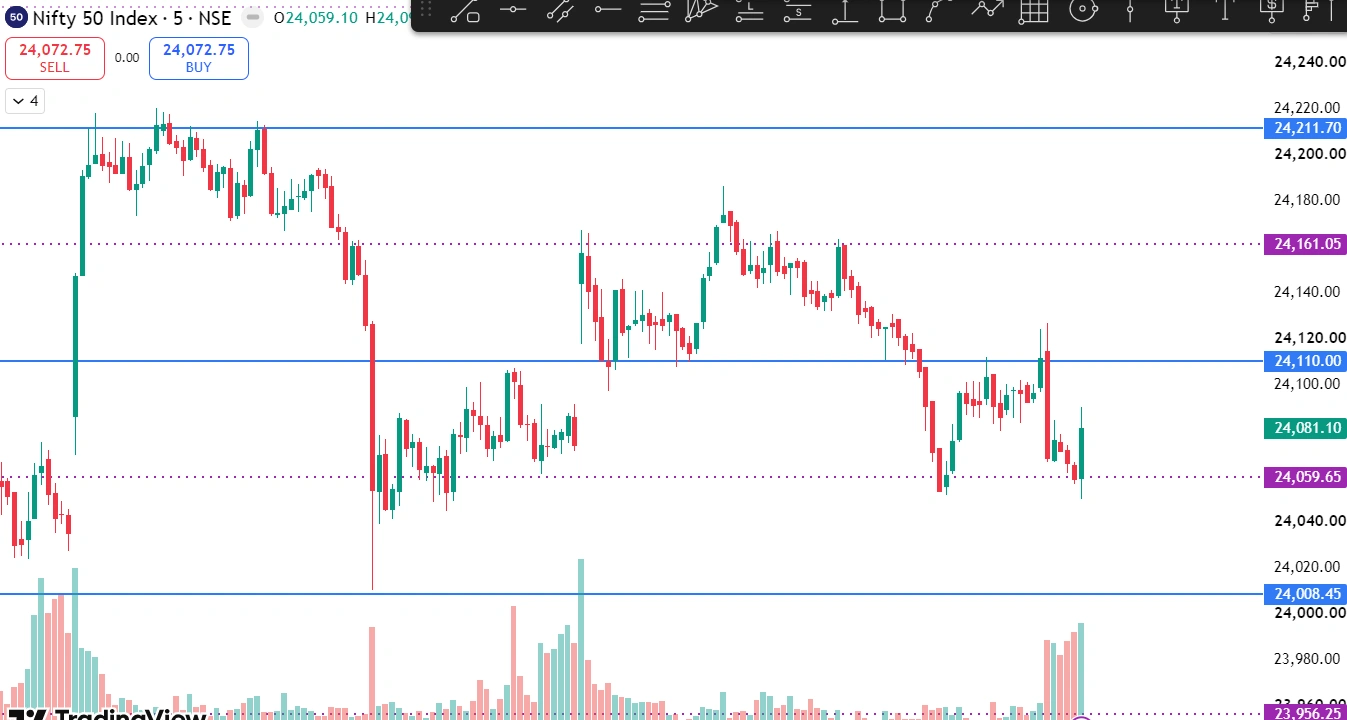
Nifty opened with strength and pushed up to an intraday high of 24,186, briefly testing the 24,211 resistance level that has capped upside across the last several sessions. As of the 3:00 PM mark the index was still holding gains near 24,108, but selling in realty, banking, and financial services stocks dragged the index lower into the close, leaving Nifty at 24,072.75 — almost exactly flat on the day.
On the 5-minute chart, this showed up as two separate rejections from the 24,180–24,220 zone, a sharp dip toward the 24,008–24,020 support band in between, a quick recovery, and a final fade back down toward 24,070–24,080 into the close. The index is, once again, oscillating inside the same range it's held for the past several sessions rather than breaking decisively either way.
Key Levels for Friday
| Level Type | Price Zone |
|---|---|
| Major Resistance | 24,313 |
| Near-term Resistance | 24,160 – 24,220 |
| Immediate Resistance | 24,110 |
| Current Spot | 24,073 |
| Immediate Support | 24,008 – 24,020 |
| Near-term Support | 23,930 – 23,960 (50-day EMA zone) |
| Major Support | 23,780 |
Market commentary continues to flag the 24,160–24,200 zone as the key resistance area, and the 23,960–23,930 band (where the 50-day EMA currently sits) as the immediate support to watch — a sustained breach there would open the door toward 23,780.
How to Trade These Levels: Reading Reversal Candles at Support & Resistance
Support and resistance levels only become useful once you pair them with what price is actually doing when it gets there. A few candlestick patterns are worth watching specifically at the zones above:
- Bullish engulfing at support (24,008–24,020 or 23,930–23,960): A red candle followed by a larger green candle that fully "engulfs" it signals that buyers have stepped in forcefully at that level, often after a stretch of selling. This is one of the more reliable signs that a support zone is holding, not just pausing.
- Bearish engulfing at resistance (24,160–24,220 or 24,313): The mirror image — a green candle followed by a larger red candle that swallows it — suggests sellers overwhelming buyers right at a resistance shelf, often marking the point where a rally stalls.
- Hammer at support: A small-bodied candle with a long lower wick and little to no upper wick, forming after a decline into a support zone, shows that sellers pushed price down intraday but buyers dragged it back up before the close — a classic sign of demand absorbing supply at that level.
- Shooting star at resistance: The inverse of a hammer — a small body with a long upper wick, forming after a rally into resistance — shows buyers pushed price up but were rejected, with sellers taking control into the close.
None of these patterns work in isolation; they matter because of where they form. A hammer in the middle of a range means far less than a hammer forming right at a well-tested support shelf like 24,008. Watching for these formations at the levels above is how the "prediction" turns into a live read on the next session, rather than a static forecast.
Check Our Predictions for Accuracy
We track how each day's outlook actually plays out, rather than only publishing the calls. For reference: yesterday's outlook for July 16 called for a range-bound session between 24,008 support and the 24,211–24,350 resistance band, with the note that holding above 24,008 would keep the recovery intact. That's close to how Thursday actually unfolded — Nifty topped out at 24,186 (just under the flagged 24,211 resistance), never came close to testing 24,008, and closed essentially flat within the range. Browse our archive of past Nifty outlooks to see the full track record, both the calls that played out cleanly and the ones that didn't.
Two Scenarios for Friday
Bullish scenario: A bullish engulfing or hammer forming at 24,008–24,020 or the 23,930–23,960 EMA zone would support a bounce back toward 24,110, then a fresh test of 24,160–24,220. A decisive close above 24,220–24,313 would be needed to break the current range and open a path toward 24,600.
Bearish scenario: A bearish engulfing or shooting star at 24,160–24,220 would reinforce this as a rejection zone, favoring a slide back toward 24,008–24,020. A sustained break below 23,930–23,960 would shift the broader structure and put 23,780 in focus.
One-Line Takeaway
Nifty stays boxed between 24,008 support and 24,160–24,220 resistance heading into Friday — watch for a reversal candle at either edge of that range before assuming a breakout.
Looking beyond the index? See Best Short-Term Stocks for Investment in India — technical setup breakdowns on individual NSE stocks near Fibonacci, Bollinger Band, and Fair Value Gap reaction zones.
Disclaimer: This article is for educational purposes only and does not constitute investment advice. Dhanith Trading is not a SEBI-registered Research Analyst or Investment Adviser. Trading and investing in securities involves substantial risk. Please consult a SEBI-registered advisor before making investment decisions.
Founder, Dhanith Trading
7+ years trading Nifty, Bank Nifty, NSE stocks, and commodities — specializing in Smart Money Concepts (SMC) and ICT price action. Founder of Dhanith — a trading journal, intraday screener, and risk tools platform built for retail traders.