On this page
- Introduction
- Part 1: What Is the Hammer Candlestick Pattern?
- The Formal Definition
- The Four OHLC Data Points of a Hammer
- The 2× Wick Rule — The Most Important Identification Criterion
- Part 2: The Four Types of Hammer Patterns
- Type 1 — Green (Bullish) Hammer
- Type 2 — Red (Bearish Body) Hammer
- Type 3 — Doji Hammer (Dragonfly Doji)
- Type 4 — The Hammer in a Pullback (Uptrend Context)
- Part 3: The Data — Hammer Pattern Win Rate and Statistics
- Part 4: How to Identify a Valid Hammer — The Complete Checklist
- The 7-Point Hammer Identification Checklist
- Part 5: Five Complete Hammer Trading Strategies
- Strategy 1 — The Classic Hammer at Support (Foundation Strategy)
- Strategy 2 — Hammer + RSI Confluence (Momentum Confirmation)
- Strategy 3 — Hammer at VWAP (Intraday Strategy for NSE)
- Strategy 4 — Hammer + Moving Average Support (Swing Trading)
- Strategy 5 — Hammer + Bullish Engulfing Confirmation (The Two-Signal Entry)
- Part 6: Stop Loss and Target — The Complete Rules
- Stop Loss Placement
- Target Setting — The Two-Level Approach
- Part 7: Hammer vs. Hanging Man vs. Shooting Star vs. Inverted Hammer
- Hammer vs. Hanging Man
- Hammer vs. Inverted Hammer
- Hammer vs. Shooting Star
- Quick Reference: The Four Related Patterns
- Part 8: Hammer Pattern on Different Timeframes
- Daily Chart Hammers — The Most Reliable
- Weekly Chart Hammers — Maximum Power
- 15-Minute and 5-Minute Chart Hammers — Intraday Application
- Part 9: Common Hammer Pattern Mistakes and Exact Fixes
- Mistake 1 — Entering Without Confirmation
- Mistake 2 — Ignoring the Prior Trend Requirement
- Mistake 3 — Trading Hammers Without Volume
- Mistake 4 — Placing Stop Loss Inside the Wick
- Mistake 5 — Confusing Hammer With Hanging Man
- Mistake 6 — Targeting Too Close
- FAQ
- Conclusion
- Ready to Trade the Hammer Pattern on Real Stocks?

Hammer Candlestick Pattern: Complete Trading Guide with Strategies (2026)
Master the Hammer candlestick pattern in 2026. Learn identification rules, 5 proven trading strategies, RSI + VWAP + support combinations, stop loss placement, targets, and the difference from Hanging Man — with real chart examples.
Introduction
There is a moment every trader remembers — the moment they watched a stock fall sharply, then suddenly reverse and rally strongly. Afterwards, looking at the chart, they saw something they had never noticed before: a single candle with a tiny body at the top and a very long tail pointing downward.
That was a Hammer.
The Hammer candlestick pattern is one of the most important, most searched, and most traded single-candle signals in technical analysis. It appears at the bottom of downtrends, at support levels, and at significant price zones — signalling that sellers have exhausted themselves and buyers are stepping in to take control.
What makes the Hammer so powerful is not its visual simplicity — it is what it represents psychologically. The long lower wick is not decoration. It is evidence of a battle: sellers pushed the price sharply lower during the session, driving it toward a new low — and then buyers surged back with such force that they erased virtually the entire decline and closed the candle near the top of its range. The wick is the story of a defeated seller army. The close near the top is the evidence of buyer victory.
The hammer's reliability stems from the market psychology it reveals: sellers pushed prices lower during the session, but buyers rejected those levels forcefully enough to drive prices back up before the close.
This guide covers everything you need to know about the Hammer. The precise identification rules. All four types of Hammer patterns. The data on win rates. Five complete trading strategies. Stop loss and target rules. The critical differences from the Hanging Man, Shooting Star, and Inverted Hammer. And the most common mistakes — with exact fixes.
TL;DR — Key Takeaways
- A Hammer is a bullish reversal candlestick with a small body at the top and a long lower wick at least 2× the body length — appearing at the bottom of downtrends
- According to Thomas Bulkowski's Encyclopedia of Candlestick Charts, the Hammer pattern shows a 60.3% success rate in bullish reversals when confirmed by a breakout above the high
- A green Hammer is stronger than a red Hammer — but both are valid bullish signals
- Three mandatory conditions: (1) prior downtrend, (2) structural criteria met (wick 2× body, minimal upper wick), (3) confirmation candle closes above the Hammer's body
- Five strategies: Hammer at Support, Hammer + RSI, Hammer + VWAP (intraday), Hammer + Moving Average, Hammer + Engulfing confirmation
- Stop loss always goes below the Hammer's lowest wick — never inside the body
- The Hammer and the Hanging Man look identical — the difference is the prior trend context only
- The Hammer candlestick has a 60% success rate and 4.2% average return over 10 days for swing traders
Part 1: What Is the Hammer Candlestick Pattern?
The Formal Definition
A Hammer candlestick is a single-candle bullish reversal pattern that forms when:
- The body of the candle is small — it sits at the upper portion of the candle's total range
- The lower wick (shadow) is long — at least 2× the length of the body, and ideally 3×
- The upper wick is minimal — either very short or non-existent
- The pattern appears after a prior downtrend — this is the non-negotiable context requirement
The name comes from the visual appearance: a candle that looks like a hammer about to drive a nail. The small body is the hammer's head. The long lower wick is the handle. And just like a hammer drives a nail into the floor, the pattern signals that price is being driven back upward from the bottom.
The Four OHLC Data Points of a Hammer
| Price Point | Position | What It Tells You |
|---|---|---|
| Open | Near the top of the candle | Sellers opened at a reasonable level |
| High | Very close to Open | Buyers never pushed significantly above the open |
| Low | Far below the Open | Sellers pushed price down aggressively during the session |
| Close | Near the Open (upper half) | Buyers recovered virtually all of the session's decline |
The story: sellers had control early and pushed price significantly lower. Then buyers stepped in with force, erasing the decline and closing near where the session opened. The session's low was decisively rejected.
The 2× Wick Rule — The Most Important Identification Criterion
The lower wick must be at least twice the length of the candle body. This 2× minimum is what distinguishes a genuine Hammer from a random small-body candle with a slightly longer lower wick.
The 2× ratio ensures the pattern represents a genuine battle — not just minor intraday noise. A wick that is 1.2× the body shows some lower rejection. A wick that is 3× or 4× the body shows dramatic lower rejection — an overwhelming buyer response to seller pressure.
In practice: Aim for the lower wick to be 2×–3× the body for minimum reliability. A 3×+ wick with minimal upper shadow and a small body near the session high is the ideal Hammer formation.
Pro Tip: Do not rigidly require exactly 2×. A wick of 1.8× in a highly liquid stock, at a major support level, after a 10-session decline, with volume 2× average — that is a higher-probability setup than a textbook 2.2× wick in a thin, choppy stock at no particular level. The 2× rule is a guideline for identifying meaningful patterns, not a mathematical cutoff that overrides context.

Part 2: The Four Types of Hammer Patterns
Understanding that there are four distinct Hammer variants — not just one — allows you to read the full range of situations where this signal appears.
Type 1 — Green (Bullish) Hammer
The Green Hammer closes higher than it opens — the bullish candle version.
- Opens near the bottom of the body
- Drops sharply (creating the long lower wick)
- Recovers and closes above the open
While a green hammer (where the close is higher than the open) is a stronger bullish signal, a red hammer still indicates that buyers forcefully rejected the extreme lows of the session.
The Green Hammer is the strongest version because the close above the open confirms that buyers not only recovered from the session's lows but also pushed slightly beyond the opening level. The bias is unambiguously bullish.
Signal strength: Strongest
Type 2 — Red (Bearish Body) Hammer
The Red Hammer has a bearish candle body — the close is below the open — but the pattern still has the critical long lower wick.
- Opens near the top of the body
- Drops sharply (long lower wick)
- Recovers but closes slightly below the open
The red body indicates sellers retained a small edge at the close. However, the massive rejection of lower prices (the long lower wick) still demonstrates significant buyer force. Sellers won the body battle but lost the wick war decisively.
Signal strength: Moderately strong — valid but requires stronger confirmation

Type 3 — Doji Hammer (Dragonfly Doji)
When the Hammer's body is so small that the Open and Close are nearly identical, the pattern becomes a Dragonfly Doji — the most extreme form of the Hammer signal.
The Dragonfly Doji has a long lower wick with minimal upper wick. It appears at market bottoms and suggests a bullish reversal.
The Dragonfly Doji shows complete buyer recovery — not just a partial recovery but a full return to the opening price. Combined with the dramatic lower wick showing the depth of the seller push, this is among the strongest single-candle bullish reversal signals available.
Signal strength: Strongest (equal to or exceeding the Green Hammer)
Type 4 — The Hammer in a Pullback (Uptrend Context)
While the Hammer is most commonly described as a downtrend reversal signal, experienced traders like to trade the Hammer pattern in an uptrend, where it can indicate the end of a pullback, rather than using it to anticipate the reversal of a full-blown downtrend. They confirm an uptrend first and look for the pattern around key support levels when the price is in a pullback.
This pullback Hammer — a Hammer forming after a brief retracement within a larger uptrend — is often the highest-probability version of the pattern because:
- You are trading with the primary trend (not against it)
- The Hammer marks the end of a retracement, not a full trend reversal
- The subsequent move carries the momentum of the primary trend
This application is particularly valuable for NSE swing traders who want to enter high-momentum stocks at pullback levels rather than chasing breakouts.
Part 3: The Data — Hammer Pattern Win Rate and Statistics
Before committing capital to any pattern, the honest question is: what does the data actually say?
According to Thomas Bulkowski's Encyclopedia of Candlestick Charts, the Hammer pattern shows a 60.3% success rate in bullish reversals when confirmed by a breakout above the high.
The Hammer candlestick pattern has a 60% success rate and 4.2% average return over 10 days, making it particularly appealing for swing traders.
On its own, the hammer has a mediocre win rate around 55 to 60 percent.
What the data tells us:
A standalone Hammer — without confluence filters — produces 55–60% win rates. This is positive but modest. The real edge comes from applying the context filters:
| Hammer Configuration | Approximate Win Rate |
|---|---|
| Hammer in isolation (no context) | 50–55% |
| Hammer after confirmed downtrend | 58–62% |
| Hammer at key support level | 63–68% |
| Hammer + RSI below 30 (oversold) | 65–70% |
| Hammer + high volume (1.5×+) + support | 68–73% |
| Hammer + confirmation candle + support + volume | 70–75%+ |
The lesson: every filter you add improves the probability. The base pattern alone is insufficient. With three or four aligned factors, the Hammer becomes one of the most reliable single-candle signals in technical analysis.
The Hammer candlestick pattern appears frequently on the chart, but the reliable Hammer pattern statistically appears less frequently. On daily charts of actively traded stocks or indices, the Hammer pattern appears in 8–12% of all candles.
This frequency statistic is important — it means you will see Hammer-shaped candles regularly, but most of them will lack the context that makes them tradeable. Learning to distinguish the 2–3 high-quality Hammers per month from the 15–20 random Hammer-shaped candles is the core skill.
Part 4: How to Identify a Valid Hammer — The Complete Checklist
Run through this checklist before acting on any Hammer pattern:
The 7-Point Hammer Identification Checklist
Check 1 — Prior Downtrend: Price must have been declining for at least 3–5 candles before the Hammer forms. The Hammer is a reversal signal — it reverses something. Without a prior decline, there is nothing to reverse.
Check 2 — Small Body at the Upper End: The body (Open to Close) occupies the upper portion of the candle's total range (from High to Low). The body should be no more than 30–40% of the total candle height.
Check 3 — Lower Wick at Least 2× the Body: Measure the lower wick length and the body length. Divide wick by body. The ratio must be 2.0 or greater. A ratio of 2.5–3.5 indicates a high-quality Hammer.
Check 4 — Minimal Upper Wick: The upper wick should be either absent or very short — no more than the body length. A long upper wick reduces the signal quality because it shows sellers pushed back against the close, reducing the bullishness of the recovery.
Check 5 — Key Level Proximity: Is the Hammer forming at or near a meaningful technical level? Check for:
- Prior support zones (where price previously bounced)
- Round numbers (₹500, ₹1,000, ₹2,000 etc.)
- Previous swing lows or equal lows
- Moving averages (20 EMA, 50 SMA, 200 SMA)
- VWAP (for intraday Hammers)
Check 6 — Volume Confirmation: The Hammer's volume should be noticeably higher than the recent average. Above-average volume confirms institutional participation — buyers stepping in with real size. Below-average volume Hammers produce significantly more false signals.
Check 7 — Confirmation Candle: The candle immediately following the Hammer should close above the Hammer's body. This confirmation candle is not optional — it is the difference between acting on a forming signal and acting on a confirmed signal.
Minimum passing score for trading: 5 out of 7 checks. Checks 1, 3, and 7 are mandatory — if any of these three fail, the pattern is not tradeable regardless of the others.

Part 5: Five Complete Hammer Trading Strategies
Strategy 1 — The Classic Hammer at Support (Foundation Strategy)
The simplest, most reliable, and most widely taught application of the Hammer pattern.
Setup conditions:
- Identify a significant support level on the daily or weekly chart (prior swing low, horizontal support, round number)
- Price declines toward that support over multiple sessions
- A Hammer forms exactly at or very near the support level
- The Hammer's lower wick briefly penetrates below the support (a liquidity sweep of stop orders below the level) and closes back above it
Why the wick below support matters: The brief penetration below support sweeps the sell stops of traders who placed stops just below the support level, collecting their sell orders as liquidity before the real bounce begins. When the Hammer closes back above support, those sellers have been cleared and the buyers are in control.
Entry:
- Conservative: Enter on the close of the confirmation candle (the candle after the Hammer that closes above the Hammer's body)
- Aggressive: Enter at the close of the Hammer candle itself, before confirmation
Stop Loss: Below the Hammer's lowest wick point, with a small buffer of 0.2–0.3% of the stock price. This is the absolute low of the pattern — if price closes below this level, the support has failed and the trade thesis is invalidated.
Target: The previous swing high above (where the downtrend began). For a minimum target, aim for at least 2:1 risk-reward — if your stop is ₹15 below the entry, your first target must be at least ₹30 above.
Example (NSE Stock):
- Nifty 50 stock at ₹800 has been declining from ₹920 over 8 sessions
- Major support at ₹800 (previous swing low from 3 months ago)
- A Hammer forms with the body at ₹802–₹808 and a wick to ₹794
- Volume on the Hammer: 2.3× the 20-day average
- Confirmation: next day closes at ₹820
- Entry: ₹820 (confirmation candle close)
- Stop: ₹792 (below wick low with buffer)
- Risk: ₹28 per share
- Target: ₹876 (previous swing high), ₹56 above entry
- Risk-Reward: 2:1
Pro Tip: The most powerful support-level Hammers form after the third or more test of a key support zone. The first test collects the breakout buyers. The second test tests the conviction. By the third test, retail sellers are committed to a breakdown — and that is exactly when institutional buyers step in decisively, producing the sharp Hammer reaction.

Strategy 2 — Hammer + RSI Confluence (Momentum Confirmation)
Adding RSI to the Hammer setup filters out false signals and identifies the highest-probability reversal moments — when both price structure and momentum oscillator signal oversold conditions simultaneously.
Setup conditions:
- Hammer forms after a downtrend at a key level (Strategy 1 base)
- RSI (14-period) is below 30 (oversold territory) OR showing positive divergence (RSI making higher lows while price makes lower lows)
RSI below 30 (Oversold) + Hammer: If a shooting star or hammer appears while the RSI is in oversold territory (below 30), the probability of a reversal is heightened.
When the RSI is below 30 at the same time a Hammer forms, two independent measurements are signaling the same thing: selling pressure is exhausted. RSI below 30 tells you momentum is oversold. The Hammer tells you buyers are rejecting lower prices. The confluence of both gives you higher confidence than either alone.
RSI Positive Divergence + Hammer: Price makes a new low. RSI makes a higher low. The divergence shows that although price reached a new extreme, the underlying selling momentum is weakening — fewer sellers are participating in the new low. When a Hammer forms at this divergence point, it is the visual confirmation of what the divergence implied.
Entry: Same as Strategy 1 — confirmation candle close above the Hammer's body
Stop: Below the Hammer's wick low
Target: Use the RSI returning to 50 as a minimum momentum target. Look for the previous swing high as the price target.
Additional RSI rule: After entering, if RSI quickly rises above 50, bullish momentum has firmly shifted. Consider trailing your stop loss behind each new swing low as the recovery continues.

Strategy 3 — Hammer at VWAP (Intraday Strategy for NSE)
For Indian intraday traders, the Hammer pattern at VWAP is one of the most precise and institutionally-backed setups available on NSE.
Why the Hammer at VWAP is powerful: VWAP can be used for pullback entries: in an uptrend, wait for RSI above 50 and a pullback to VWAP for a cleaner long entry.
When a stock pulls back to VWAP from above — meaning it was above VWAP (bullish session bias confirmed) and dips back to it — and forms a Hammer at that VWAP level, you have a combination of:
- Institutional fair value level (VWAP) being defended
- Visual buyer rejection of prices below VWAP (the long lower wick)
- Session bias confirmation (price was above VWAP before the pullback = bullish day)
Setup conditions:
- Daily bias is bullish (GIFT Nifty positive, FII net buyers, sector positive)
- Stock from the Dhanith Intraday Screener (high momentum, volume breakout confirmed)
- Stock has been trading above VWAP for 30+ minutes (session bullish bias established)
- Price pulls back to VWAP on declining volume
- A Hammer forms with the wick dipping below VWAP and the body closing at or above VWAP
- Volume on the Hammer is higher than the preceding pullback candles
Timeframe: 5-minute chart
Entry: At the close of the Hammer candle at VWAP, or at the high of the Hammer if waiting for a confirmatory break
Stop: Below the Hammer's lower wick by 0.2–0.3% of the stock price. If the wick went 5 points below VWAP on a Nifty stock, your stop is 5–8 points below the wick.
Target: Previous intraday high (the prior swing high of the day). Minimum 2:1 risk-reward.
RSI filter for intraday: RSI should be above 50 overall (confirming the bullish session bias) but pulled back toward 40–50 during the pullback to VWAP. As the Hammer forms and the RSI turns upward from 40–50, the momentum confirmation aligns with the price pattern.
This is the exact setup the Dhanith intraday strategy is built around. Find pre-screened NSE stocks with the session momentum already confirmed — then wait for the Hammer at VWAP.
→ Open the Dhanith Intraday Screener — today's high-momentum stocks where VWAP Hammer setups form cleanest

Strategy 4 — Hammer + Moving Average Support (Swing Trading)
Moving averages provide dynamic, institutionally-watched support levels that are powerful locations for Hammer formations on daily and weekly charts.
The three key moving average support levels:
- 20-period EMA: Short-term trend support — tested in corrections within established uptrends
- 50-period SMA: Intermediate support — a significant level in medium-term trends
- 200-period SMA: The most watched line in global markets — the long-term bull/bear divider
Why moving averages amplify the Hammer signal: Moving averages are watched by institutional traders, fund managers, and algorithmic systems worldwide. When the 200 SMA provides support, millions of market participants are watching the same level. A Hammer at the 200 SMA — with volume — means institutional buyers are defending the long-term trend support actively.
Setup conditions:
- Stock in an established uptrend (higher highs and higher lows on the daily chart)
- Price corrects down toward the 20 EMA, 50 SMA, or 200 SMA
- Price touches the moving average and forms a Hammer
- Volume on the Hammer is above the 20-day average
- RSI has pulled back to 40–55 range (moderate, not extreme oversold — suggesting this is a correction within a healthy uptrend, not a breakdown)
Entry: Confirmation candle close above the Hammer's body
Stop: Below the Hammer's wick low — and critically, below the moving average itself. If price closes below the 50 SMA, the medium-term trend support has broken and the trade is invalidated.
Target: The most recent swing high. For stocks in strong uptrends, the uptrend usually continues to new highs after a successful moving average support bounce.
| MA Level | Best For | Signal Strength | Frequency |
|---|---|---|---|
| 20 EMA | Short-term momentum traders | High in strong uptrends | Very frequent |
| 50 SMA | Swing traders | Very High | Moderate |
| 200 SMA | Position traders | Maximum | Rare but powerful |
Strategy 5 — Hammer + Bullish Engulfing Confirmation (The Two-Signal Entry)
The most conservative of the five strategies — requiring both a Hammer and a subsequent Bullish Engulfing candle before entry. This combination dramatically reduces false entries at the cost of a slightly later, slightly worse entry price.
Why two signals together work: Combined trading strategies using the Hammer pattern involve finding and confirming the pattern using other technical analysis tools. After confirming the Hammer, look for another reversal pattern such as Three White Soldiers or a bullish Engulfing to confirm the reversal.
A Hammer followed by a Bullish Engulfing means:
- Session 1 (Hammer): Sellers pushed down, buyers fought back and closed near the top. Warning signal — watch closely.
- Session 2 (Bullish Engulfing): Buyers completely overwhelmed sellers, opening below the Hammer's body and closing above the Hammer's high. The reversal is confirmed.
The sequence:
- Day 1: Hammer forms at key level
- Day 2: Confirmation candle closes above Hammer body (basic confirmation — still cautious)
- Day 3: A Bullish Engulfing candle opens below Day 2's close and closes above Day 2's open (full two-signal confirmation)
Entry: At the close of the Bullish Engulfing candle (Day 3)
Stop: Below the Hammer's lowest wick — the original low of the entire setup
Target: The most recent swing high, targeting minimum 2:1 R:R
When to use this strategy: On larger position sizes, on daily or weekly charts, and for traders who prefer certainty over entry timing. The two-signal entry sacrifices approximately 0.5–1% of potential gain in exchange for significantly higher confidence.
Part 6: Stop Loss and Target — The Complete Rules
Stop Loss Placement
The universal Hammer stop loss rule: Place your stop loss below the lowest point of the Hammer's lower wick, with a small buffer.
For Indian stocks:
- Large-cap NSE stocks (₹500+ price): 0.2–0.3% buffer below the wick low
- Mid-cap stocks: 0.3–0.5% buffer
- Nifty/Bank Nifty futures (intraday): 5–10 points below the wick low
Why below the wick — not below the body: The wick represents the maximum seller push during the session. If price closes below this wick low, it means sellers returned with enough force to push price back below even the session's most extreme low — invalidating the entire buyer-recovery story of the Hammer. A stop inside the wick (but below the body) will get hit by normal intraday noise before the actual invalidation point is reached.
Never place the stop at:
- The bottom of the Hammer's body (too tight — normal intraday movement triggers it)
- An arbitrary round number (psychologically comfortable but technically incorrect)
- "A few points below my entry" (has nothing to do with where the pattern is wrong)
Target Setting — The Two-Level Approach
Primary target (first scale-out point): The previous swing high that initiated the downtrend. This is where the trend reversed from bullish to bearish — and where supply (selling) previously overwhelmed buyers. Expect resistance here.
Secondary target (running position): Beyond the previous swing high, the next significant structural resistance or the swing high before the one that started the decline. For stocks in strong uptrends making new highs, there may be no overhead resistance — use a trailing stop.
Minimum risk-reward: 2:1. Measure the distance from your entry to your stop. Your primary target must be at least twice that distance above your entry. If it is not, the setup does not meet the minimum quality threshold — skip the trade.
Scale-out approach:
- At 1:1 (risk covered): Close 25–30% of the position, move stop to breakeven
- At 2:1 (primary target): Close another 40–50% of the position
- Let the remaining 20–25% run with a trailing stop behind each new swing low
Know your exact share count and stop distance before entering any Hammer trade. Use the Dhanith Risk Management Calculator — enter your capital, risk percentage, and stop distance to get your position size instantly.
Part 7: Hammer vs. Hanging Man vs. Shooting Star vs. Inverted Hammer
The Hammer pattern belongs to a family of four related single-candle patterns that are visually similar but carry different signals based entirely on context.
Hammer vs. Hanging Man
The hammer and the hanging man look almost identical on a chart, but they signal completely opposite things. This is why understanding placement within the trend is essential for interpreting candlestick patterns correctly. Hammer: Forms after a downtrend — signals a potential bullish reversal. Hanging Man: Forms after an uptrend — signals a potential bearish reversal.
| Feature | Hammer | Hanging Man |
|---|---|---|
| Visual appearance | Identical | Identical |
| Prior trend | Downtrend | Uptrend |
| Signal | Bullish reversal | Bearish warning |
| Body colour | Green or red | Green or red |
| Upper wick | Minimal | Minimal |
| Lower wick | Long (2× body min) | Long (2× body min) |
| Reliability | Moderate-High | Moderate (needs confirmation) |
The one thing that tells them apart: the prior trend. This single piece of context transforms a bullish signal into a bearish one. Never identify a Hammer without first confirming you are looking at a downtrend.
Hammer vs. Inverted Hammer
| Feature | Hammer | Inverted Hammer |
|---|---|---|
| Body position | Upper end of range | Lower end of range |
| Long wick direction | Lower wick | Upper wick |
| Signal strength | Stronger (direct buyer control) | Weaker (buyers attempted, sellers recovered partially) |
| Confirmation need | Strong but one candle | Requires strong confirmation |
The Hammer shows buyers fully recovered the session's decline and closed near the top. The Inverted Hammer shows buyers pushed significantly higher during the session but sellers pushed the close back down — yet still higher than the low. The recovery attempt is visible but incomplete, making the Inverted Hammer a weaker signal requiring more confirmation.
Hammer vs. Shooting Star
| Feature | Hammer | Shooting Star |
|---|---|---|
| Prior trend | Downtrend | Uptrend |
| Long wick | Lower | Upper |
| Signal | Bullish reversal | Bearish reversal |
| Psychology | Buyers rejected the lows | Sellers rejected the highs |
The Shooting Star is the Hammer's bearish counterpart. Both have small bodies and long wicks — but in opposite directions and opposite trend contexts.
Quick Reference: The Four Related Patterns
| Pattern | Trend | Long Wick | Signal |
|---|---|---|---|
| Hammer | Downtrend | Lower | Bullish reversal |
| Hanging Man | Uptrend | Lower | Bearish warning |
| Shooting Star | Uptrend | Upper | Bearish reversal |
| Inverted Hammer | Downtrend | Upper | Weak bullish warning |
Part 8: Hammer Pattern on Different Timeframes
Daily Chart Hammers — The Most Reliable
Higher timeframes win. A daily hammer beats a 5-minute hammer every time. Trade the highest timeframe your strategy allows.
The daily chart Hammer is the most reliable and most acted-upon version because:
- Each daily candle represents a full trading session — 6.25 hours of buyer-seller battle on NSE
- Institutional participation is consistent and high
- The pattern is visible to fund managers, prop desks, and algorithmic systems worldwide
- The support level it forms at is watched by thousands of professional participants
For swing traders on NSE, a daily Hammer at a key support level is a primary setup signal. The confirmation candle provides the entry, and the trade typically plays out over 3–10 sessions.
Weekly Chart Hammers — Maximum Power
A weekly Hammer represents five full trading days of buyer-seller battle compressed into one candle. When the weekly candle has a long lower wick — meaning sellers pushed price significantly lower across multiple days of the week but buyers recovered the entire move by Friday's close — the reversal signal carries enormous institutional weight.
Weekly Hammers at major support levels are rare (appearing perhaps 6–10 times per year on a given stock) but extremely powerful when they appear. When a weekly Hammer confirms, the subsequent rally often lasts weeks to months.
15-Minute and 5-Minute Chart Hammers — Intraday Application
Intraday Hammers on the 5-minute and 15-minute charts work best during the 9:30–11:00 AM NSE session when institutional volume is highest. The key requirements remain identical — prior decline, 2× wick, minimal upper shadow, volume confirmation — but the time compression means the "prior downtrend" may be just 5–7 bearish candles preceding the pattern.
A hammer candlestick pattern can appear on any timeframe, but it is generally more reliable when it appears at a significant support level on higher timeframes like a daily chart or weekly chart. Multi-timeframe analysis can improve the effectiveness of hammer patterns by confirming overarching trends.
Multi-timeframe application for NSE day traders:
- Check the daily chart: Is the stock at a key daily support?
- Check the 15-minute chart: Has a Hammer formed at that support during the session?
- Check the 5-minute chart: Is there a volume surge on the Hammer candle?
- Entry: At the high of the 5-minute Hammer or confirmation candle
Part 9: Common Hammer Pattern Mistakes and Exact Fixes
Mistake 1 — Entering Without Confirmation
Entering at the low of the Hammer (the worst possible moment — while the wick is still forming) or entering at the Hammer's close without waiting for confirmation.
The fix: Conservative approach: Wait for the next candle to close higher (confirmation candle) before entering a long position. This reduces the risk of false signals but may result in a less favorable entry price. Always wait for the confirmation candle to close above the Hammer's body before entering. Yes, you give up a small amount of potential profit. In exchange, you eliminate most false Hammer signals before they cost you money.
Mistake 2 — Ignoring the Prior Trend Requirement
Finding a Hammer-shaped candle in a sideways market, or after only one or two bearish candles, and treating it as a reversal signal.
The fix: A minimum of 3–5 bearish candles must precede the Hammer. In practice, the best Hammers appear after 7–15 session declines that create a genuine trend to reverse. If you cannot clearly identify the downtrend that the Hammer is reversing, it is not a valid Hammer signal.
Mistake 3 — Trading Hammers Without Volume
Entering a beautiful-looking Hammer on below-average volume — a thin, unconvincing session where the long wick formed without institutional backing.
The fix: Check the volume bar of the Hammer candle against the 20-period average. Require volume at least 1.5× above average. Low-volume hammers are less reliable than high-volume ones. Below-average volume reduces a 65% pattern to a 50% coin flip.
Mistake 4 — Placing Stop Loss Inside the Wick
Setting the stop at the bottom of the Hammer's body instead of below the wick. Normal intraday or inter-session volatility briefly dips into the wick and triggers the stop — then price reverses upward exactly as expected.
The fix: Stop loss goes below the lowest wick point with a 0.2–0.3% buffer. The wick extreme is the genuine invalidation level. If price closes below it, the buying recovery story of the Hammer has been disproven. Until then, normal price fluctuation within the wick is not invalidation.
Mistake 5 — Confusing Hammer With Hanging Man
Buying a Hanging Man (Hammer-shaped candle at the top of an uptrend) because it "looks like a Hammer."
The fix: Before acting on any Hammer-shaped candle, verify the prior trend. The candle is a Hammer only if it follows a downtrend. The same shape after an uptrend is a Hanging Man — a bearish warning. The visual is identical. The context is opposite. Context wins every time.
Mistake 6 — Targeting Too Close
Setting a target just 5–7 points above entry on a stock where the stop is 20 points below — creating a negative risk-reward ratio on a legitimate setup.
The fix: Before any Hammer trade, calculate the risk (distance from entry to stop) and verify the target is at least 2× the risk away. If the target is closer than 2:1, either skip the trade or identify a more aggressive entry that improves the ratio.
FAQ
Q: What is a Hammer candlestick pattern? A Hammer candlestick is a single-candle bullish reversal pattern with a small body at the top of its range and a long lower wick at least twice the body's length. It appears at the bottom of downtrends and at key support levels, signalling that sellers pushed price sharply lower during the session but buyers overwhelmed them and drove price back up before the close. The long lower wick is the visual evidence of this buyer recovery.
Q: What is the difference between a Hammer and a Hanging Man? Both patterns are visually identical — small body, long lower wick (2× minimum), minimal upper wick. The sole difference is context: a Hammer appears after a downtrend and is a bullish reversal signal. A Hanging Man appears after an uptrend and is a bearish warning signal. The same visual shape carries opposite meanings depending on the prior trend direction.
Q: Is a red Hammer bullish? Yes — a red (bearish body) Hammer is still a bullish reversal signal. The red body means the close was slightly below the open, but the long lower wick still demonstrates that sellers tried to push price much lower and buyers recovered the vast majority of that decline. A green Hammer is a stronger signal (close above open confirms buyer control), but a red Hammer with a long wick at a key support level with volume is a valid bullish setup.
Q: What is the success rate of the Hammer candlestick pattern? Based on Thomas Bulkowski's backtesting data, the Hammer shows a 60.3% success rate when confirmed by a breakout above the high. With additional confluence filters applied — forming at a recognised support level, RSI below 30, and above-average volume — the win rate rises to 68–75%+. Standalone, without context, the Hammer is approximately a 55–60% pattern.
Q: Do I need a confirmation candle for the Hammer pattern? Yes — a confirmation candle is strongly recommended and significantly improves the pattern's reliability. The confirmation candle (the candle following the Hammer) should close above the Hammer's body. Waiting for confirmation reduces false entries by over 30% according to backtesting data. The cost is a slightly higher entry price, which is well worth the improved win rate.
Q: How do I set my stop loss on a Hammer pattern? Place the stop loss below the Hammer's lowest wick point — the absolute lowest price reached during the Hammer session — with a small buffer of 0.2–0.3% of the stock price. Never place the stop inside the wick (too tight — normal volatility triggers it) or at an arbitrary round number (no technical relevance). The wick low is the genuine invalidation point: if price closes below it, the Hammer's buyer-recovery narrative has been disproven.
Q: What is the best timeframe for Hammer patterns? Daily and weekly charts produce the most reliable Hammer patterns because they represent extended buyer-seller battles with genuine institutional participation. For intraday traders on NSE, the 5-minute and 15-minute charts produce actionable Hammers during the 9:30–11:00 AM session. The highest-probability intraday Hammers occur at the VWAP level when the stock has an established bullish session bias.
Conclusion
The Hammer candlestick pattern is one of the oldest, most reliable, and most universally recognised signals in technical analysis. Its three-century history reflects something fundamental: the psychology it captures — seller exhaustion and buyer emergence — is a constant feature of all liquid markets regardless of technology, regulation, or era.
Mastering the Hammer means understanding three things above everything else:
1. Context is mandatory. A Hammer without a prior downtrend is just a candle with a long lower wick. A Hammer after a 10-session decline at a major support level, on above-average volume, is a high-probability trade with a clearly defined entry, stop, and target.
2. Volume is your confirmation partner. Every Hammer with volume above the 20-period average moves into the 65–75% win rate territory. Every Hammer on thin volume deserves your skepticism regardless of how perfect it looks visually.
3. Wait for the confirmation candle. The patience of watching the following candle close above the Hammer's body eliminates the majority of false signals. The slightly worse entry price is a small cost for a significantly better win rate.
Apply the five strategies in this guide — starting with the Classic Support Hammer — and build from there. One strategy mastered is more valuable than five strategies half-understood.
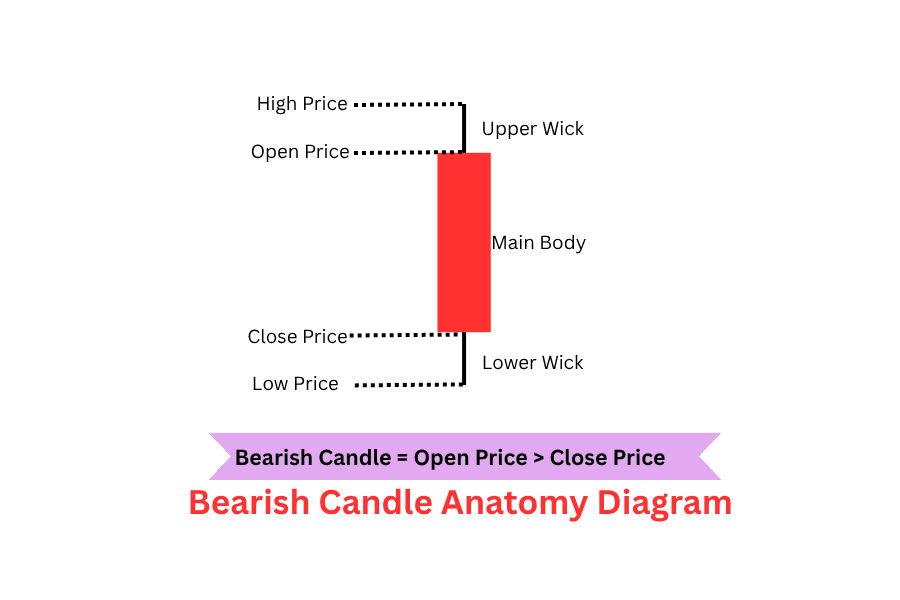
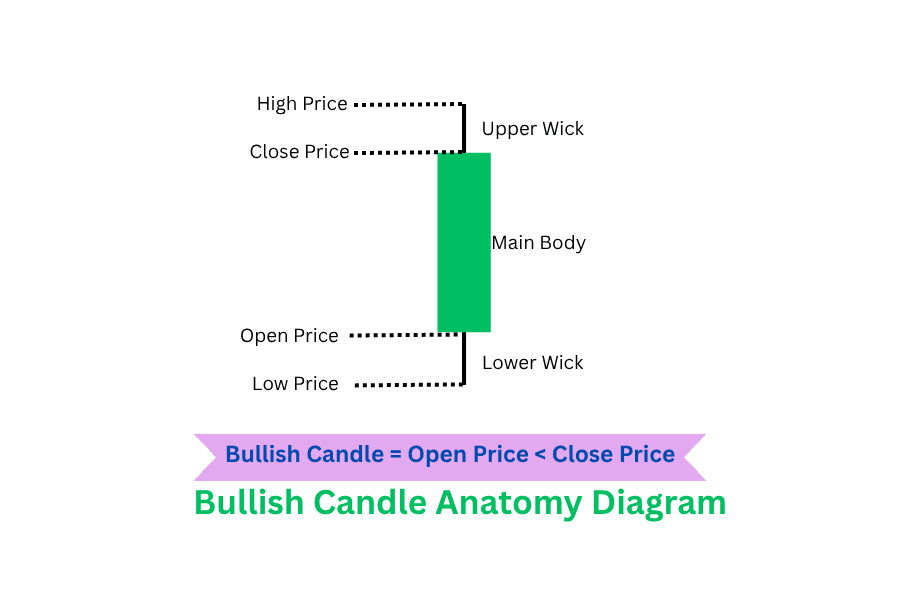
Further reading: Bullish Candle Anatomy: How to Read a Bullish Candlestick | Bearish Candle Anatomy: How to Read a Bearish Candlestick | Important Candlestick Patterns: The Complete Guide | Morning Star Candlestick Pattern: Complete Trading Guide | How to Trade Intraday Stocks in India | RSI Trading Strategy: Complete Guide | Support and Resistance: The Complete Trading Guide | Volume Analysis Trading Strategy | Bollinger Bands Trading Strategy | Bullish Engulfing Pattern: Complete Trading Guide | Bearish Engulfing Pattern: Complete Trading Guide | Shooting Star Candlestick Pattern: Complete Trading Guide | Technical Analysis Mastery: The Complete Guide | Smart Money Concepts: The Complete Mastery Guide | 5 Best Intraday Trading Strategies for NSE India
Ready to Trade the Hammer Pattern on Real Stocks?
→ Open the Dhanith Intraday Screener — find today's NSE stocks where Hammer setups are forming at VWAP and key support levels on above-average volume
→ Calculate Your Position Size and Stop Distance — know your exact share count and maximum loss before entering any Hammer trade
→ Log Every Hammer Trade in the Dhanith Journal — track which Hammer configurations produce the best results for your trading style
Disclaimer: This article is for educational purposes only and does not constitute financial or investment advice. Trading in stocks and financial markets involves significant risk of capital loss. Past performance of any pattern does not guarantee future results. Always use proper risk management and stop losses.
Have a question about this article?
Comment on our latest Instagram post or send us a DM — we reply to every one.
@dhanith_officialWas this article helpful?
Click to rate
Founder, Dhanith Trading
7+ years trading Nifty, Bank Nifty, NSE stocks, and commodities — specializing in Smart Money Concepts (SMC) and ICT price action. Founder of Dhanith — a trading journal, intraday screener, and risk tools platform built for retail traders.
Dhanith Newsletter
Enjoyed this article? Get more like it.
New trading guides, candlestick patterns, SMC strategies, and tool updates — straight to your inbox. Free, for Indian traders.
No spam. Unsubscribe anytime.
Continue Reading