On this page
- Introduction
- Part 1: What Is the Bullish Engulfing Pattern?
- The Formal Definition
- The OHLC Story — What Each Candle Is Saying
- The Body-to-Body Engulfment Rule — The Most Important Distinction
- Part 2: Four Types of Bullish Engulfing Setups
- Type 1 — Perfect Engulfing (Strongest)
- Type 2 — Standard Engulfing (Reliable)
- Type 3 — Gap Engulfing (High Momentum)
- Type 4 — Engulfing at Trend Exhaustion (Reversal Opportunity)
- Part 3: The Data — Bullish Engulfing Win Rate and Statistics
- What the Research Shows
- The Confluence Multiplier Effect
- Frequency and Practicality
- Part 4: How to Identify a Valid Bullish Engulfing — The Complete Checklist
- The 7-Point Identification Checklist
- Part 5: Five Complete Bullish Engulfing Trading Strategies
- Strategy 1 — Bullish Engulfing at Support (The Foundation Strategy)
- Strategy 2 — Bullish Engulfing + RSI (Oversold Confirmation)
- Strategy 3 — Bullish Engulfing + VWAP (Intraday NSE Strategy)
- Strategy 4 — Bullish Engulfing at Moving Average Support (Swing Trading)
- Strategy 5 — Bullish Engulfing as Continuation Signal (Second-Chance Entry)
- Part 6: Stop Loss and Target — The Complete Rules
- Stop Loss Placement
- Target Setting Rules
- Part 7: Bullish Engulfing vs. Bearish Engulfing vs. Related Patterns
- Bullish Engulfing vs. Bearish Engulfing
- Bullish Engulfing vs. Bullish Piercing Line
- Bullish Engulfing vs. Bullish Harami
- Part 8: Bullish Engulfing on Different Timeframes
- Daily Chart — The Most Reliable
- Weekly Chart — Maximum Power
- 5-Minute and 15-Minute Chart — Intraday NSE Application
- Part 9: Common Bullish Engulfing Mistakes and Exact Fixes
- Mistake 1 — Trading Incomplete Engulfment
- Mistake 2 — Ignoring the Prior Trend
- Mistake 3 — Entering on Low Volume
- Mistake 4 — Wrong Stop Loss Placement
- Mistake 5 — Trading Bullish Engulfing Against the Primary Trend
- Mistake 6 — Setting Target Too Close
- FAQ
- Conclusion
- Ready to Trade the Bullish Engulfing on Real Stocks?
Bullish Engulfing Pattern: Complete Trading Guide & Strategies (2026)
Master the Bullish Engulfing candlestick pattern in 2026. Learn identification rules, 5 proven strategies, RSI + VWAP + support combinations, stop loss and target placement, comparison with Bearish Engulfing — with real stock examples.
Introduction
Imagine you are watching a declining stock. The sellers have been in control for days. Each session confirms the bearish trend — lower opens, lower closes, relentless selling pressure. You are either short the stock or waiting on the sidelines, watching the decline.
Then something changes.
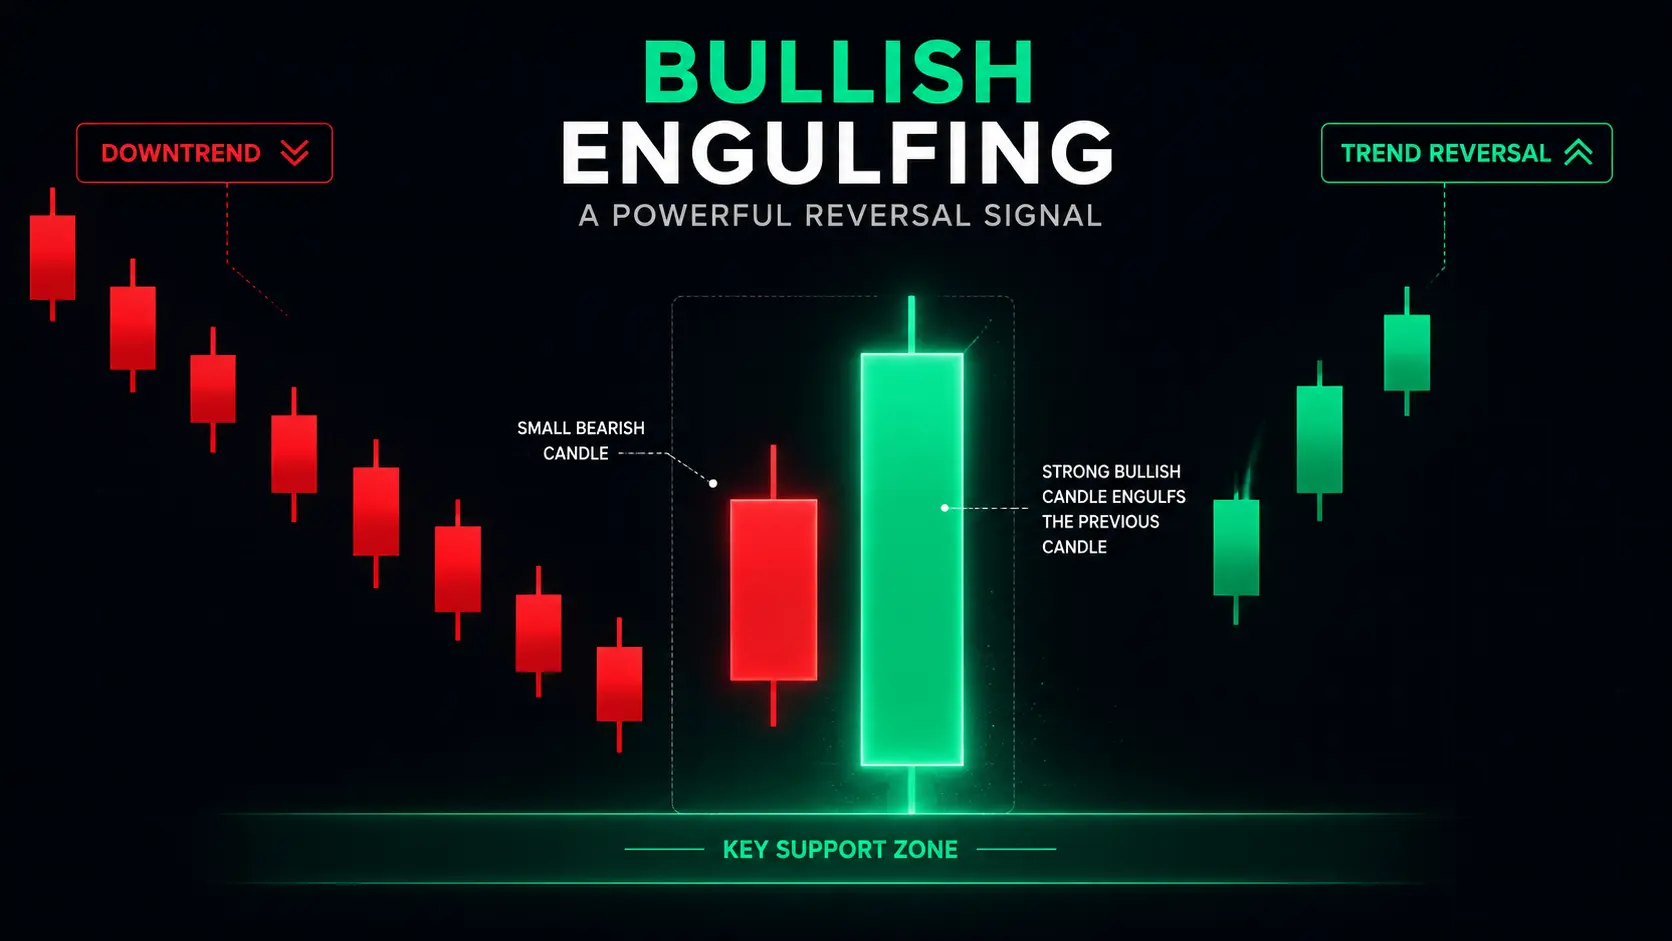
On a single trading day, buyers step in so powerfully and so decisively that they erase the entire previous session's decline — and go beyond it. The session that started looking bearish ends as a large, confident green candle that swallows the entire prior red candle whole. The sellers tried to continue downward. The buyers said no — and proved it in one session.
That is a Bullish Engulfing pattern. And it is one of the most important signals in all of technical analysis.
The Bullish Engulfing candlestick pattern is a classic two-bar reversal signal that traders use to catch shifts from selling pressure to fresh buying momentum. This setup forms when a small red candle is fully covered by the next green candle's body, showing that buyers have stepped in with force to reverse the prior downtrend.
What gives the Bullish Engulfing its edge is not merely its visual clarity — it is the psychological completeness of the signal. The prior bearish candle (Day 1) told traders the sellers were winning. The engulfing candle (Day 2) tells them the buyers have won so decisively that not only did they erase Day 1 — they went further. That completeness of buyer response, in a single session, is what separates the Bullish Engulfing from weaker, ambiguous reversal signals.
This guide covers everything: the precise identification rules, four types of engulfing setups, what the data says about win rates, five complete trading strategies, stop loss and target placement, and the most common mistakes with exact fixes.
TL;DR — Key Takeaways
- A Bullish Engulfing pattern is a two-candle reversal signal where a small bearish candle (Day 1) is completely engulfed by a larger bullish candle (Day 2) that opens lower and closes higher
- Research by Liberated Stock Trader puts the win rate at approximately 53% in isolation — rising to 60–70% with support, volume, and RSI confirmation
- Intraday stats show Bullish Engulfing patterns achieve 55–65% win rates when volume aligns
- Three non-negotiable requirements: prior downtrend, complete body engulfment (not wick), above-average volume on Day 2
- Five strategies: Bullish Engulfing at Support, Engulfing + RSI, Engulfing + VWAP (intraday NSE), Engulfing + Moving Average, Engulfing as Continuation Signal
- Stop loss: below the Day 1 low (the low of the entire two-candle pattern)
- Target: previous swing high above — minimum 2:1 risk-reward required
- The Bullish Engulfing and Bearish Engulfing appear regularly across all markets — making them the first patterns most professional traders learn to trade at scale
Part 1: What Is the Bullish Engulfing Pattern?
The Formal Definition
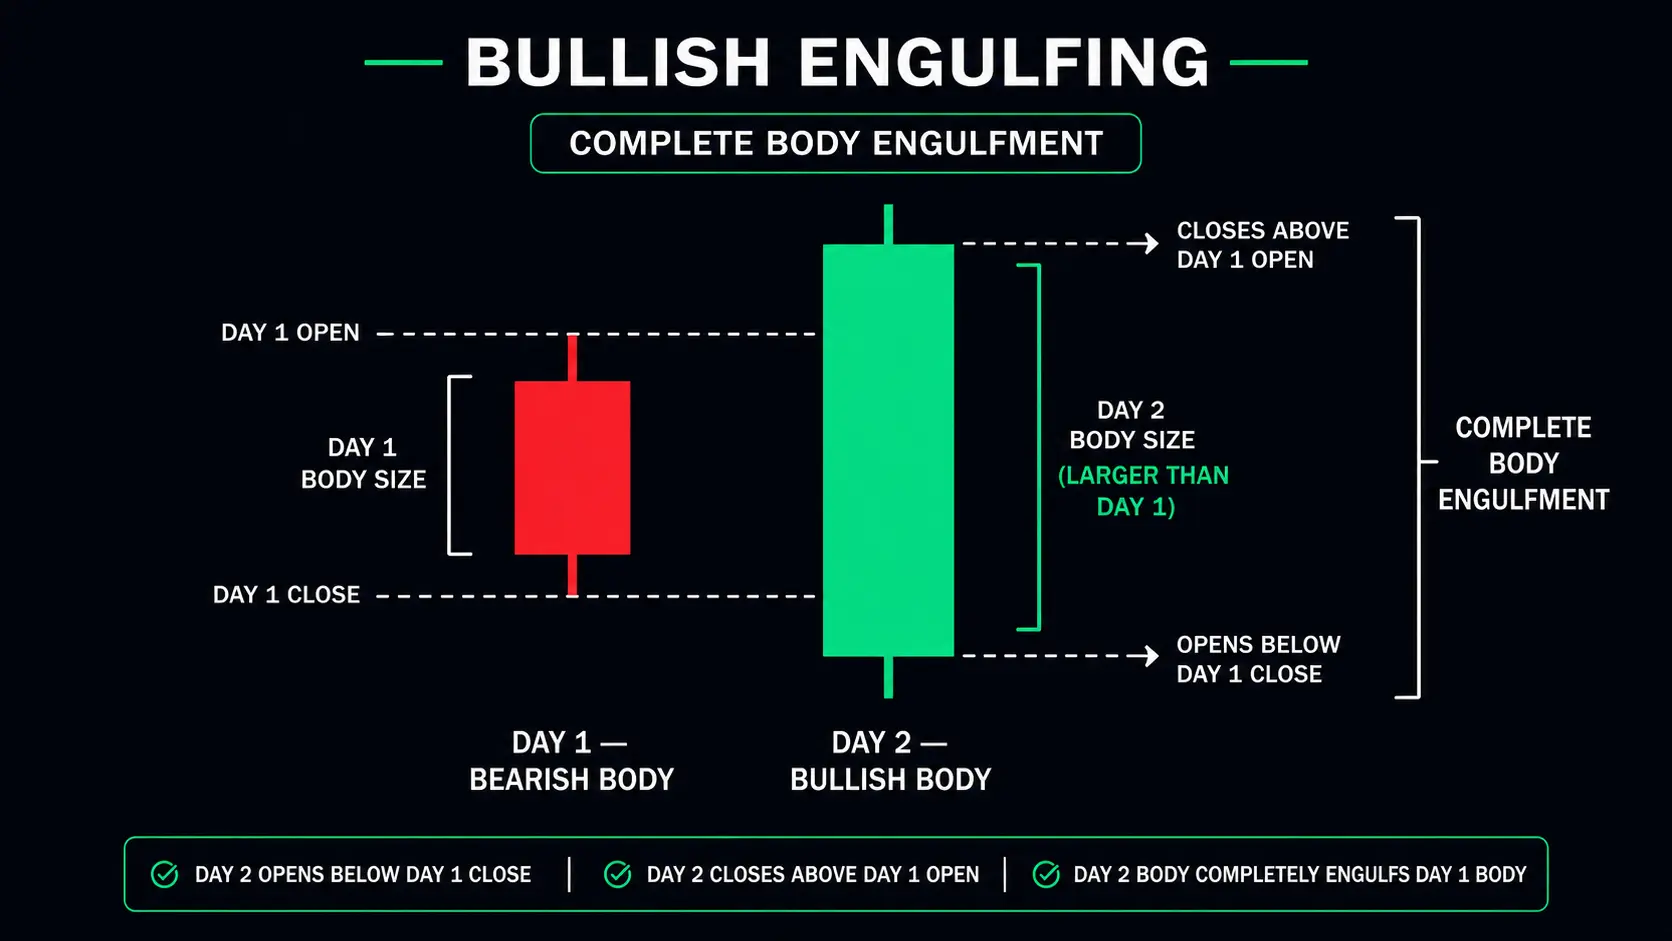
A Bullish Engulfing pattern is a two-candlestick bullish reversal formation that appears after a downtrend. It consists of:
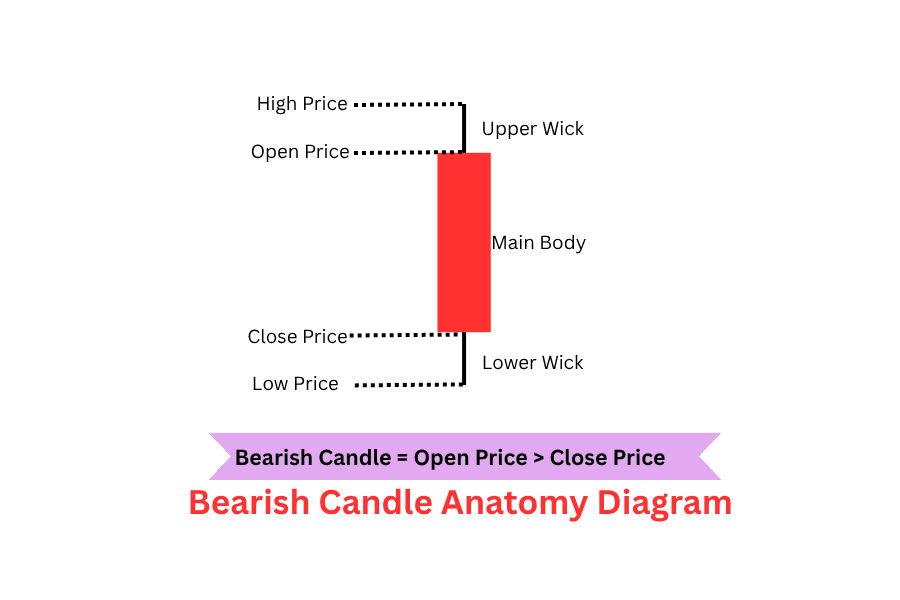
Candle 1 (Day 1): A bearish (red/dark) candle — confirming that sellers were in control during the prior session. The body can be large or small, but it must be clearly bearish (close below open).
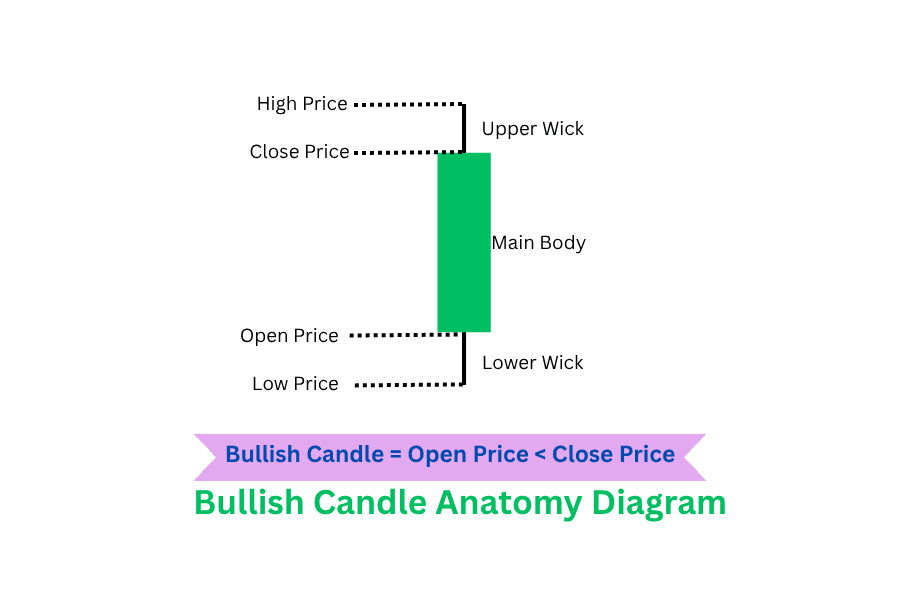
Candle 2 (Day 2 — the Engulfing Candle): A bullish (green/white) candle whose body completely engulfs the body of Candle 1. Specifically:
- Day 2 opens at or below Day 1's close
- Day 2 closes at or above Day 1's open
- Day 2's body (from its own open to its close) exceeds Day 1's body (from Day 1's open to close) in both directions
The word "engulf" is precise: the bullish candle doesn't merely exceed Day 1 — it swallows it completely, with Day 2's open starting below Day 1's body and Day 2's close finishing above it.
The OHLC Story — What Each Candle Is Saying
Day 1 (Bearish Candle):
- Opens at a price — sellers push it lower throughout the session
- Closes below the open — sellers win the session
- Message: "Sellers are still in control. The downtrend continues."
Day 2 (Engulfing Candle):
- Opens at or below Day 1's close — initially looks like more selling
- Buyers step in with overwhelming force and drive price sharply upward
- Closes above Day 1's open — buyers have erased the entire Day 1 decline and gone beyond it
- Message: "Buyers have completely taken over. Everything Day 1's sellers achieved has been reversed."
The psychological shift is total. Day 1 declared seller victory. Day 2 annulled that victory completely and issued a new declaration of buyer dominance.
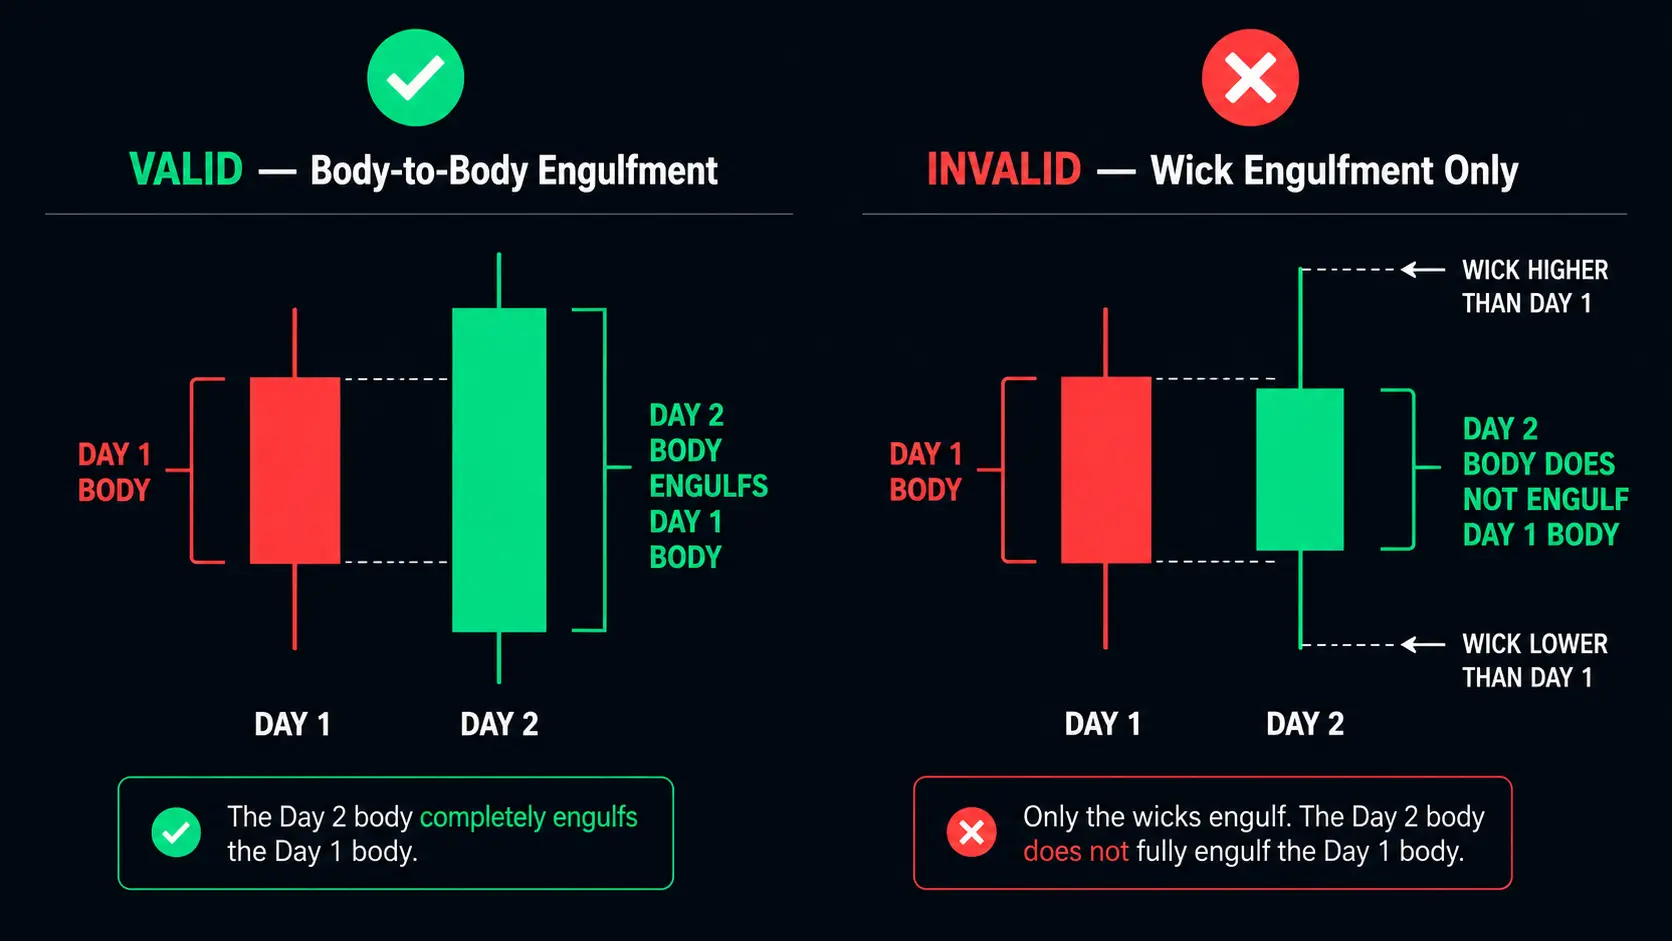
The Body-to-Body Engulfment Rule — The Most Important Distinction
The engulfment must be body to body, not wick to wick.
Day 2's candle body (open to close) must exceed Day 1's candle body (open to close). Day 2's wicks can extend further in both directions — those are irrelevant to the pattern's validity.
This distinction matters because the candle body represents the genuine buyer-seller battle of the session (open to close), while wicks represent brief excursions that were rejected. A wick-to-wick "engulfing" shows only that price temporarily touched extreme levels in both directions — not that buyers systematically overwhelmed sellers throughout the session.
Body engulfment = real buyer dominance Wick engulfment only = temporary excursion, not dominance
Pro Tip: When identifying Bullish Engulfing patterns on TradingView, check that the CLOSE of Day 2 is above the OPEN of Day 1, and the OPEN of Day 2 is below the CLOSE of Day 1. These two conditions confirm complete body engulfment without needing to eyeball the candle proportions.
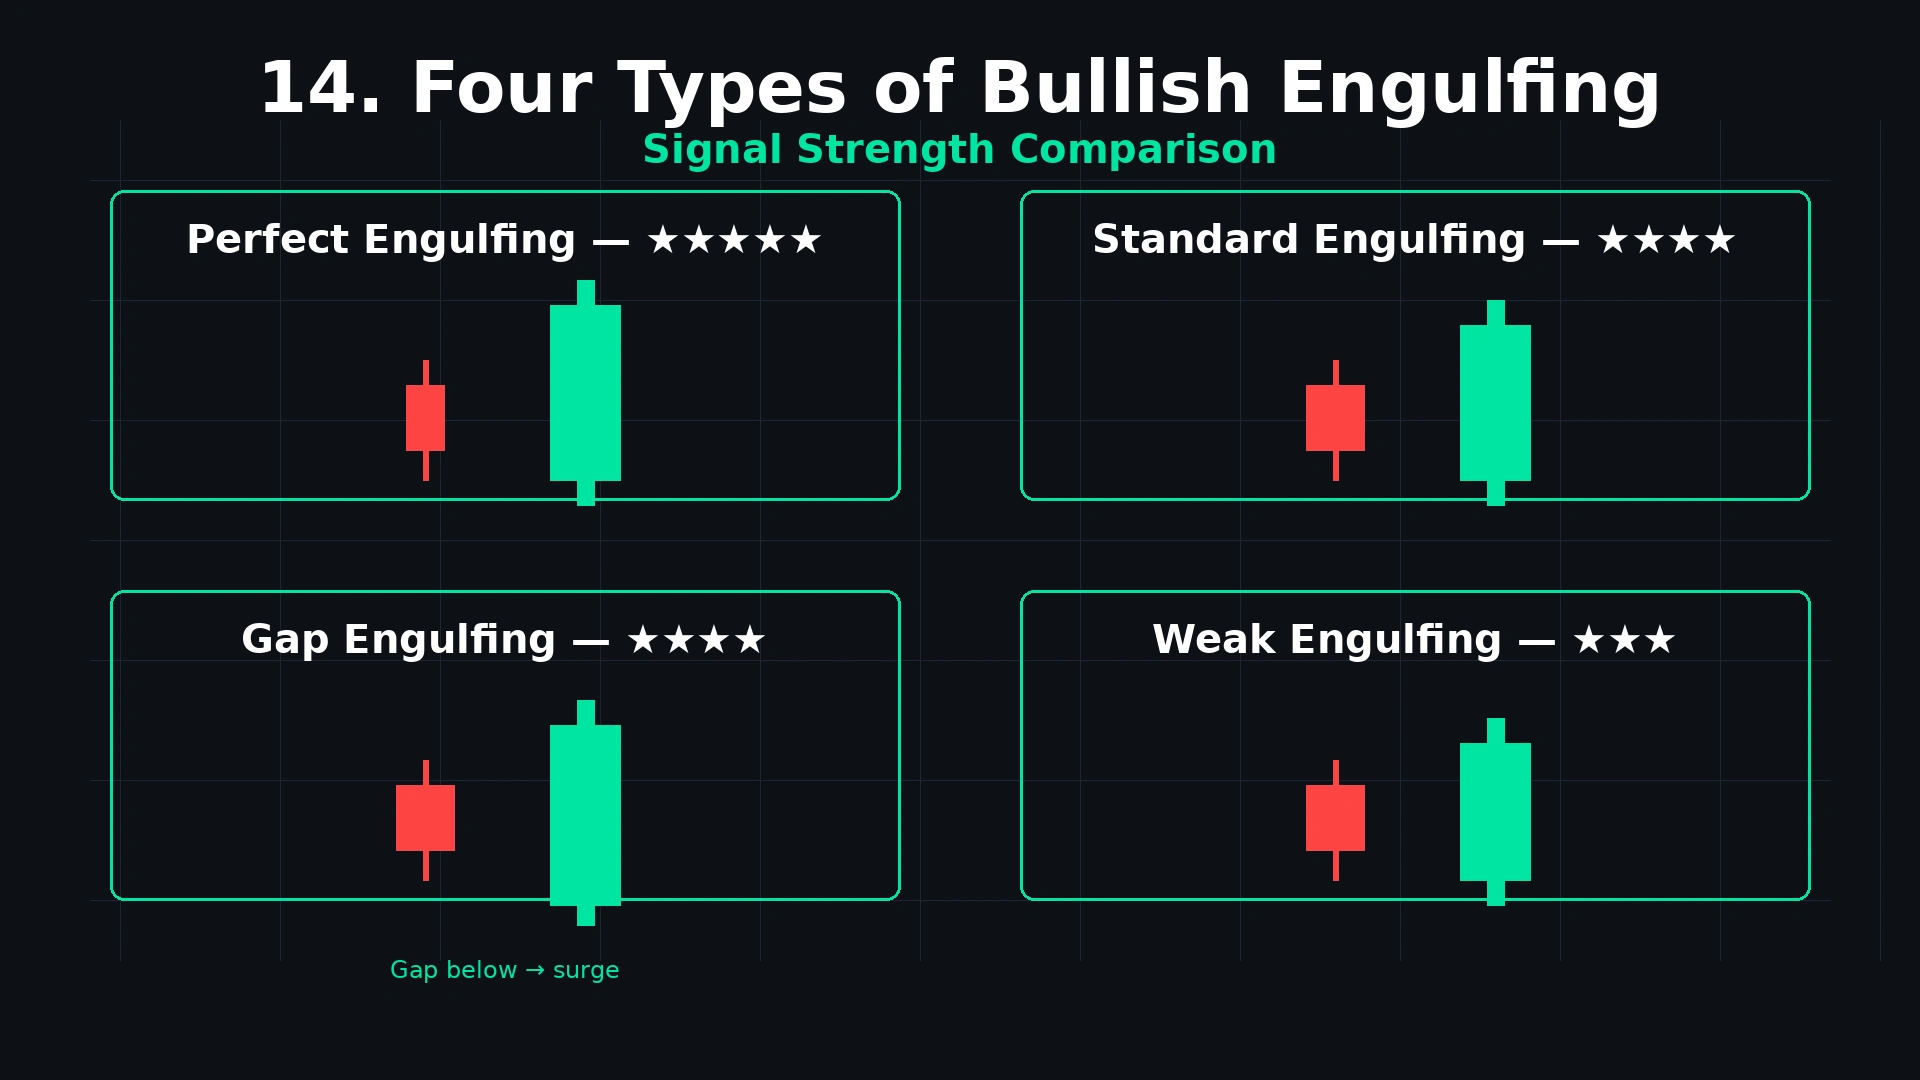
Part 2: Four Types of Bullish Engulfing Setups
Understanding the four distinct configurations of the Bullish Engulfing allows you to grade setup quality before entering.
Type 1 — Perfect Engulfing (Strongest)
Day 2's body far exceeds Day 1's body — the bullish candle is 1.5× to 2× or more the size of the bearish candle, opening significantly below Day 1's close and closing well above Day 1's open.
This is the clearest, most decisive version. The size differential emphasises the completeness of the buyer takeover — not a marginal win but a comprehensive one. A larger Day 2 candle relative to Day 1 indicates stronger buyer conviction.
Signal strength: Maximum. Enter at Day 2's close or Day 3's open with full position size.
Type 2 — Standard Engulfing (Reliable)
Day 2's body exceeds Day 1's body but only moderately — Day 2 is 1.0× to 1.5× the size of Day 1. The engulfment is complete but not dramatic.
This is the most common version and perfectly tradeable. The engulfment requirement is met; the buyer takeover is confirmed. Apply all standard confirmation filters and enter normally.
Signal strength: High. Standard position size, standard confirmation requirement.
Type 3 — Gap Engulfing (High Momentum)
Day 2 opens with a gap below Day 1's close — a visible opening price gap — then rallies strongly to engulf Day 1's body. The gap down initially suggests continued selling, making the subsequent reversal and engulfment even more powerful.
Why the gap version is particularly strong: the gap down triggered the stop losses of long traders and attracted short-sellers expecting breakdown continuation. Their subsequent covering (as price reverses upward past Day 1's open) adds fuel to the bullish move, creating a sharp, sustained upward move post-pattern.
In Indian markets, overnight gaps are common and frequently create this gap-engulfing setup on daily charts. When the morning pre-open shows a stock gapping below yesterday's close and then the day's trading closes above yesterday's open — that is a gap Bullish Engulfing with significant momentum.
Signal strength: Very High — particularly in Indian equity markets where overnight gaps are frequent.
Type 4 — Engulfing at Trend Exhaustion (Reversal Opportunity)
This version occurs after an extended, multi-session decline where price has reached an extreme — well below moving averages, with RSI deeply oversold, often at a significant support level. The engulfing here coincides with the technical exhaustion of the downtrend.
This configuration tends to mark meaningful bottoms — not just brief pullback entries — because the exhaustion of selling pressure is widespread and the snap-back has momentum behind it from short covering, value buyers, and momentum players all entering simultaneously.
Signal strength: High — but requires patience. The initial reversal may be sharp and fast.
Part 3: The Data — Bullish Engulfing Win Rate and Statistics
What the Research Shows
Research by Liberated Stock Trader puts the bullish engulfing pattern's win rate at approximately 53% on the daily timeframe when traded in isolation. That figure rises meaningfully when the pattern is combined with support zones, oversold indicators, and high volume confirmation.
Other tests show 60–70% success when confirmed with volume and context, while academic research has placed effectiveness closer to 65%. Overall, the pattern delivers between 55–65% effectiveness, improving with confirmation.
The key data point for traders: the Bullish Engulfing and Bearish Engulfing appear regularly across all markets and timeframes, have documented win rates of 57–65%, and are the first patterns most professional traders learn to trade at scale.
The Confluence Multiplier Effect
Every filter you add to a Bullish Engulfing setup increases the probability:
| Bullish Engulfing Configuration | Win Rate (Approximate) |
|---|---|
| Standalone (no context filters) | 53–55% |
| After confirmed downtrend (5+ bearish sessions) | 57–60% |
| At recognised support level | 62–65% |
| With above-average volume on Day 2 | 63–67% |
| With RSI below 40 (oversold zone) | 65–70% |
| All three: support + volume + oversold RSI | 68–73% |
| At SMC order block / FVG + volume + support | 72–78% |
The lesson is consistent across all research: the raw pattern has modest edge. The filtered, context-confirmed pattern has genuine, meaningful edge.
Frequency and Practicality
Bullish Engulfing patterns appear on actively traded stocks and indices with reliable frequency — several times per month on the daily chart of any liquid stock. This frequency, combined with their 57–65% win rate, makes them one of the most practically useful patterns for consistent trade generation.
Unlike rare patterns (Abandoned Baby, Three Stars) that occur only a few times per year, the Bullish Engulfing gives active traders multiple tradeable setups per month while maintaining statistical reliability. This frequency-reliability balance is precisely why it is considered the most practically scalable bullish pattern in technical analysis.
Part 4: How to Identify a Valid Bullish Engulfing — The Complete Checklist
The 7-Point Identification Checklist
Check 1 — Prior Downtrend: Price must have been declining meaningfully before the pattern forms. The most reliable setups occur after at least 5 consecutive bearish sessions. The Bullish Engulfing is a reversal signal — it needs something to reverse.
Check 2 — Day 1 Is a Clearly Bearish Candle: Day 1 must close below its open with a visible body. A very small Doji-like candle for Day 1 weakens the setup — a larger bearish body on Day 1 makes the subsequent engulfment more dramatic and significant.
Check 3 — Day 2 Opens at or Below Day 1's Close: Day 2 must open at or below where Day 1 closed — confirming that the initial direction appeared bearish before the reversal. Opening inside Day 1's body (rather than at or below it) is valid but slightly weaker.
Check 4 — Day 2 Closes at or Above Day 1's Open (Complete Engulfment): Day 2's body must fully engulf Day 1's body. Day 2's close must be at or above Day 1's open — the complete erasure of Day 1's decline and extension beyond it.
Check 5 — Day 2 Is Larger Than Day 1: The bullish candle (Day 2) must be larger than the bearish candle (Day 1). The larger the size difference, the more decisive the buyer victory.
Check 6 — Volume Confirmation: Day 2's volume must be above the recent average. The most reliable Bullish Engulfing signals occur when Day 2 volume is 1.5× or more above the 20-period average — confirming institutional participation in the reversal.
Check 7 — Key Level Proximity: The pattern should form at or near a significant technical level: prior support zone, round number, moving average, VWAP, or SMC order block. A Bullish Engulfing floating in mid-range without structural backing is significantly less reliable than one at a watched institutional level.
Minimum for trading: Checks 1, 4, and 6 are mandatory. With only these three, the setup is marginal. With all seven, the setup is Grade A.
Part 5: Five Complete Bullish Engulfing Trading Strategies
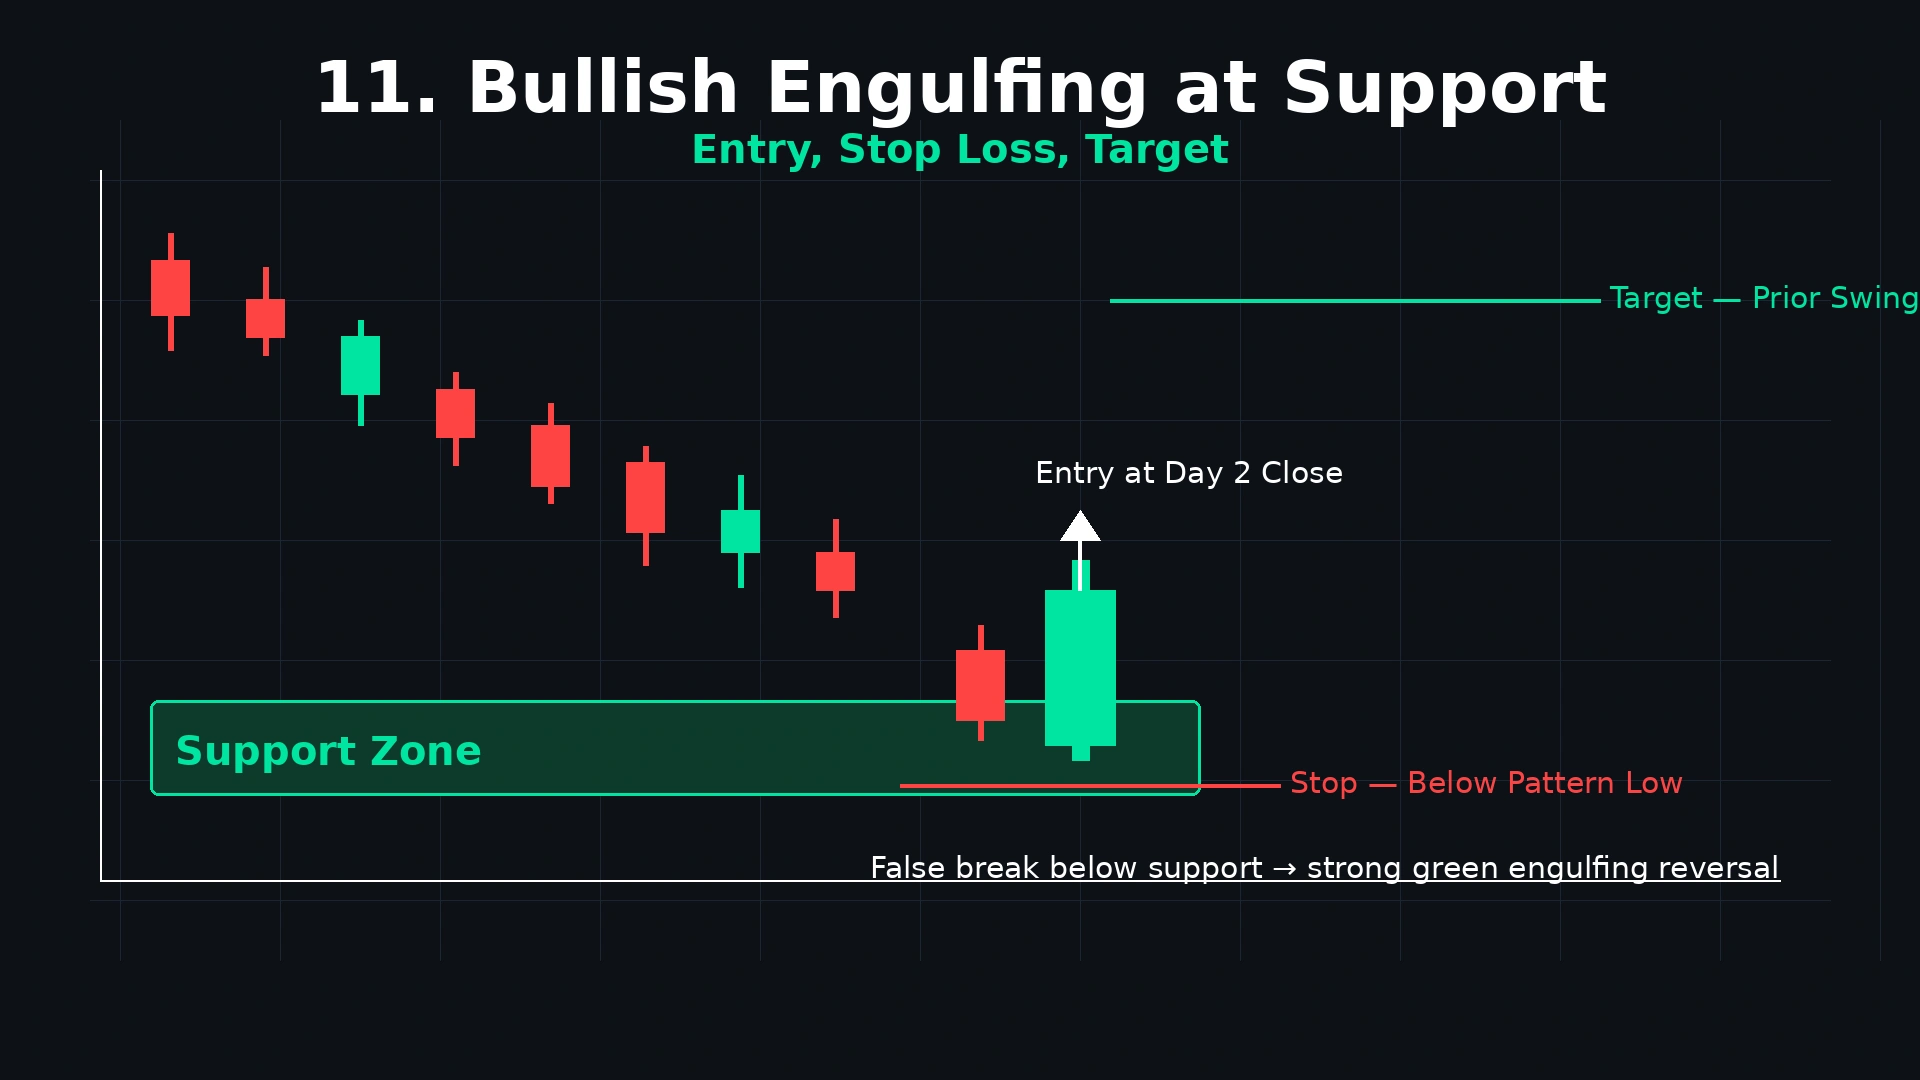
Strategy 1 — Bullish Engulfing at Support (The Foundation Strategy)
The most reliable and most widely taught Bullish Engulfing strategy. The support level provides the structural context; the Bullish Engulfing provides the timing signal.
Setup conditions:
- Identify a significant support level on the daily chart (prior swing low, horizontal support zone, round number)
- Price declines from above toward this support over 5+ sessions
- A Bullish Engulfing forms as price reaches the support zone
- Ideally, Day 1 briefly closes below the support (liquidity sweep) and Day 2's Engulfing candle closes decisively above it
Why this combination works: The support level provides the structural reason for buyers to step in. The Bullish Engulfing provides the visual confirmation that they have. A candlestick pattern at a key support level is far more reliable than a support level alone, and far more reliable than a candlestick pattern at a random location.
The surprise if you are a short seller: when a stock appears to confirm your downward thesis, only to completely reverse — such is the case with the Bullish Engulfing at support. The downtrend appears to be continuing. Shorts are comfortable. Then suddenly we get a complete retracement of the preceding bearish candle. Short sellers begin covering. This adds fuel to the buying pressure.
Entry:
- Standard: At the close of Day 2 (the engulfing candle)
- Conservative: At the open of Day 3 — confirms the reversal has held overnight
Stop Loss: Below the lowest point of the entire two-candle pattern — the lower of Day 1's low and Day 2's low — with a 0.2–0.3% buffer.
Target: The previous swing high above where the current decline began. Minimum 2:1 risk-reward before entering.
Real NSE example: Tata Steel has been declining for 6 sessions from ₹160 to ₹140 (major historical support). Day 1 closes at ₹139 (briefly below support). Day 2 opens at ₹137.50, surges all day, closes at ₹152.
- Entry: ₹152 (Day 2 close)
- Stop: ₹135.50 (below Day 2 low with buffer)
- Risk: ₹16.50 per share
- Target: ₹186 (prior swing high) — ₹34 above entry
- Risk-Reward: 2.06:1
Pro Tip: The most powerful Bullish Engulfing at support setups involve a false breakdown: Day 1 closes below the support level (appearing to confirm a breakdown, shaking out the last weak longs and triggering the stop loss traders who placed stops just below support), followed by Day 2 reclaiming support with an engulfing candle. This false breakdown liquidity sweep eliminates the overhead stop orders and creates fuel for the subsequent move. When you see this pattern — brief break below support, followed by full-body engulfing reclaim — treat it as high-priority.
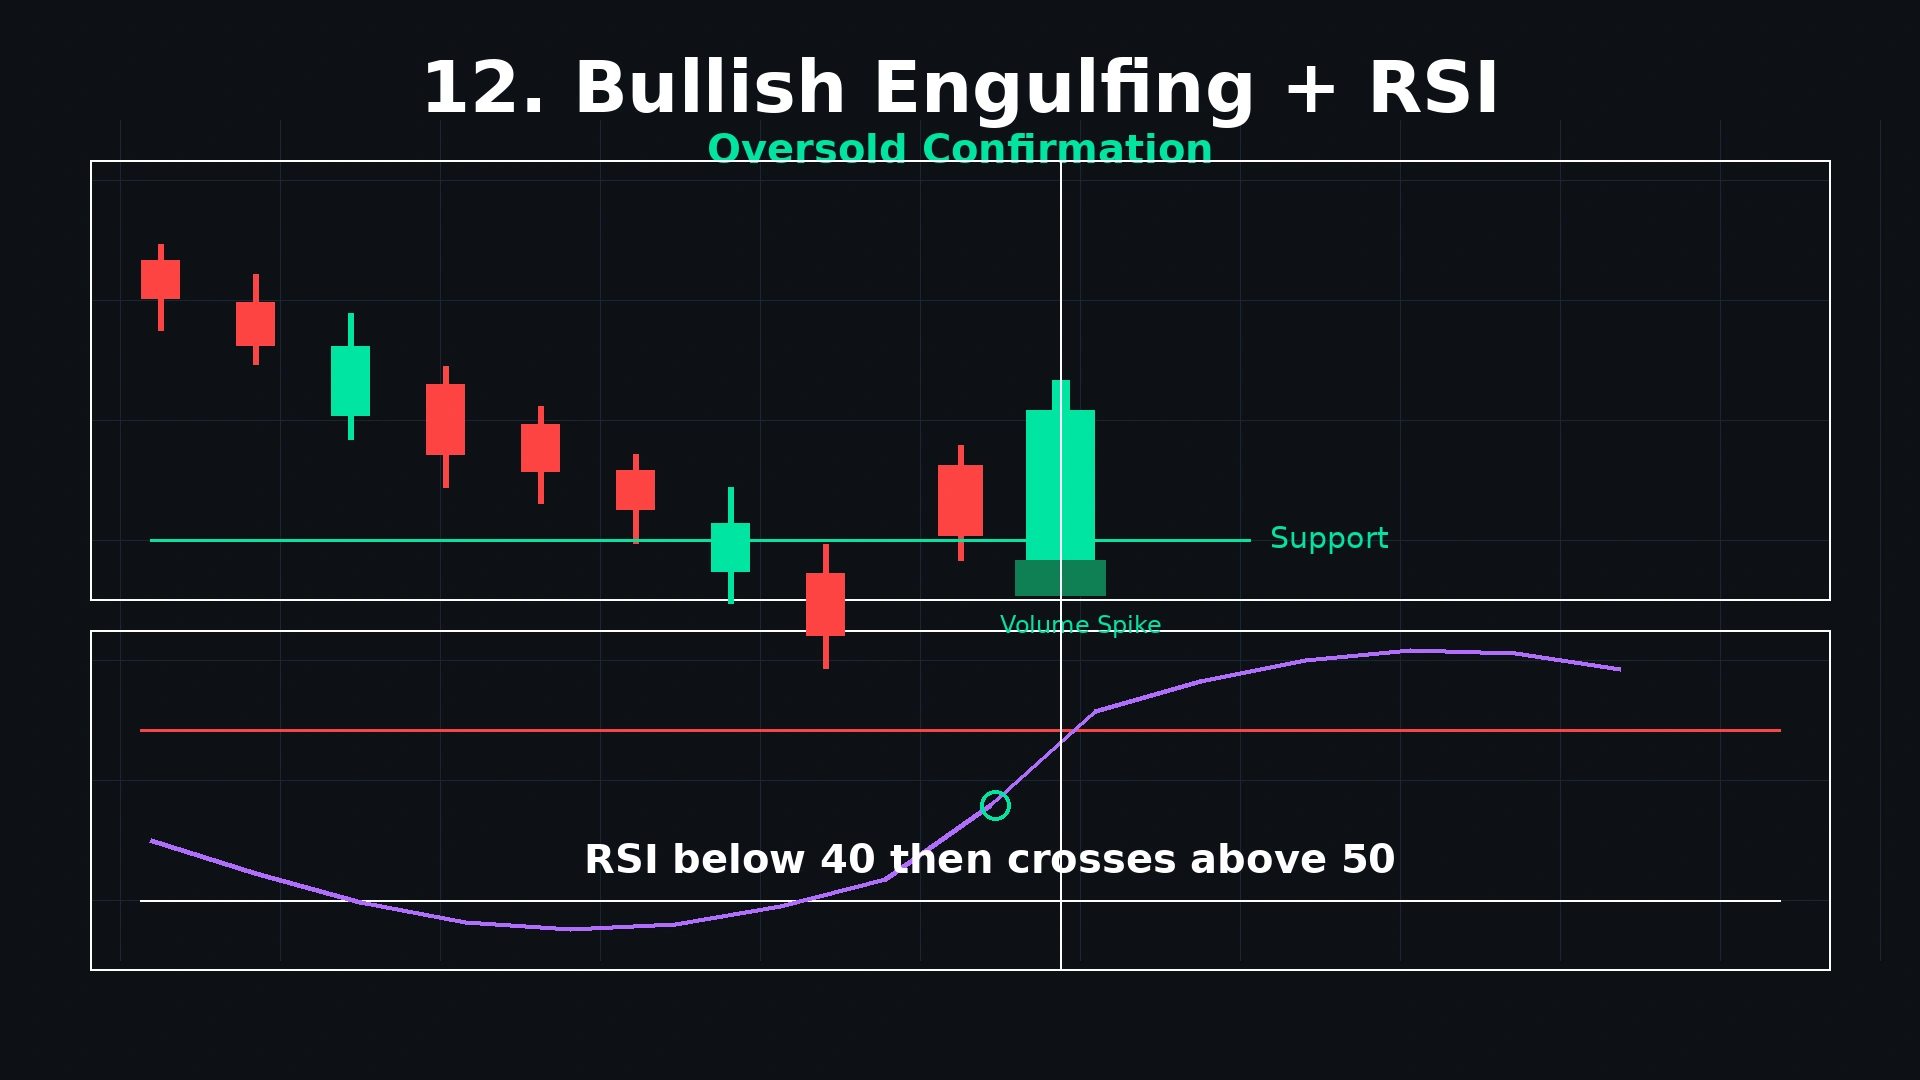
Strategy 2 — Bullish Engulfing + RSI (Oversold Confirmation)
Adding RSI to the Bullish Engulfing setup provides an independent momentum confirmation that selling pressure has genuinely exhausted — not just paused.
Setup conditions:
- Bullish Engulfing forms at a key support level (Strategy 1 base)
- RSI (14-period) is in oversold territory: below 40 at minimum, below 30 for stronger confirmation
- OR: RSI shows positive divergence — price makes a lower low but RSI makes a higher low, showing weakening selling momentum despite the lower price
RSI Oversold + Bullish Engulfing: When the RSI falls below 30–40, the market is telling you statistically that selling pressure has been sustained beyond normal equilibrium — a mean-reversion is more probable. When a Bullish Engulfing forms at this oversold reading, two independent signals confirm the same thing: excessive selling has exhausted itself and buyers are stepping in.
RSI Positive Divergence + Bullish Engulfing: The most reliable version. Price made a new low but RSI could not confirm a new low — the underlying selling momentum was weakening before the pattern formed. The Bullish Engulfing is the visual expression of what the divergence implied: sellers tried to continue but buyers won the Day 2 battle decisively.
Entry: At the close of the Engulfing candle
Stop: Below the pattern low (below Day 1's low or Day 2's low, whichever is lower)
Target: Use RSI returning to neutral (50) as a momentum target indicator. Look for the previous swing high as the price target.
Post-entry RSI management: Once in the trade, if RSI quickly crosses above 50, bullish momentum has firmly shifted. At this point, trail the stop behind each new swing low to protect profits on extended moves.
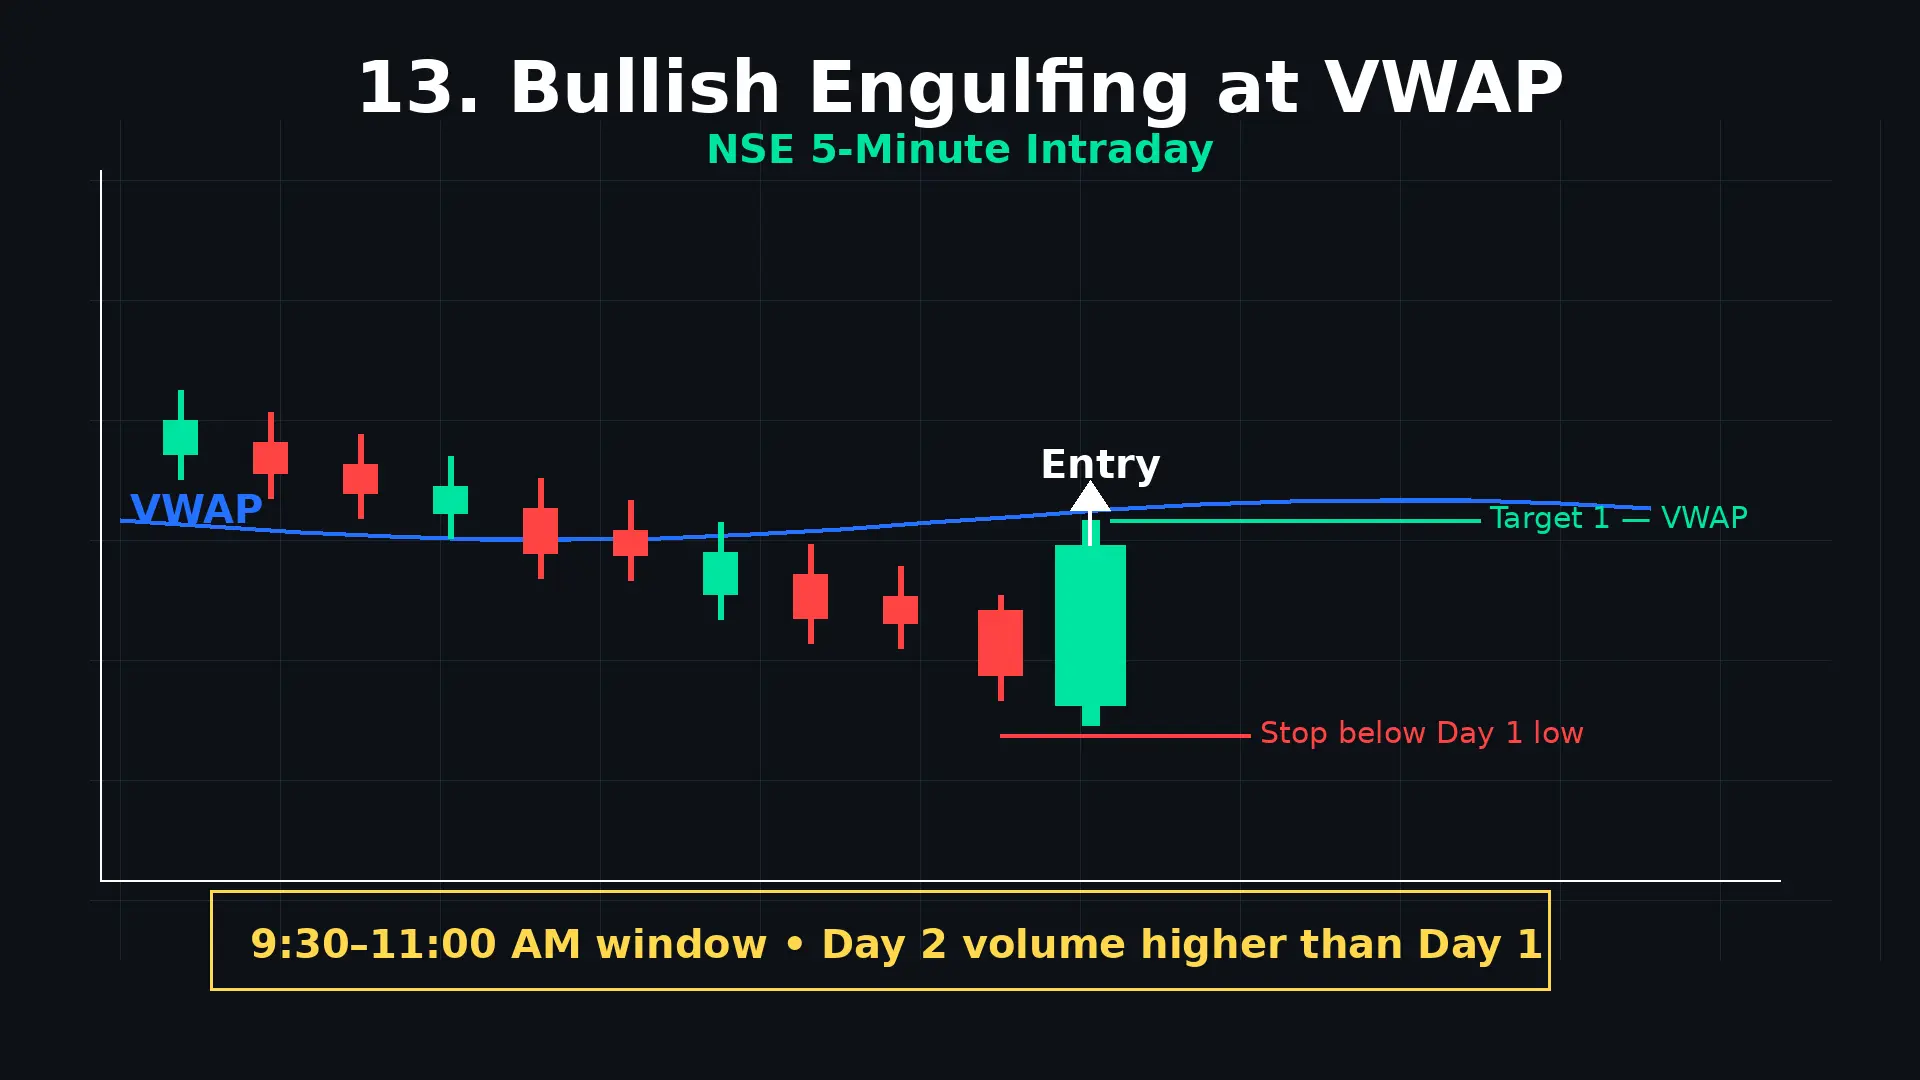
Strategy 3 — Bullish Engulfing + VWAP (Intraday NSE Strategy)
For Indian intraday traders, the Bullish Engulfing pattern below VWAP is one of the most precise entry signals available on NSE — and forms the third entry condition in the Dhanith Intraday Strategy.
Why Bullish Engulfing below VWAP is powerful: VWAP is the institutional fair value reference for the session. When price is below VWAP, the session bias is bearish — sellers control intraday fair value. A Bullish Engulfing pattern in this below-VWAP zone signals that buyers are fighting back with enough force to overwhelm sellers comprehensively — and the subsequent reclaim of VWAP becomes the measured target.
Setup conditions:
- Stock from the Dhanith Intraday Screener (high momentum, volume breakout confirmed)
- Price is below VWAP on the 5-minute chart (bearish session zone)
- A genuine two-candle Bullish Engulfing forms — Day 2 opens below Day 1's close and closes above Day 1's open
- Day 2's volume is clearly higher than Day 1's volume and above the session average
- RSI is below 50 but turning upward (from oversold toward neutral)
Timeframe: 5-minute chart exclusively
Entry: At the close of the Day 2 Engulfing candle
Stop: Below the low of Day 1 (the bearish candle) — the lowest point of the pattern — with a 0.3% buffer
Target: VWAP as the first target (mean reversion). If VWAP is 0.5% above entry and the stop is 0.5% below entry, that is a 1:1 trade — acceptable only if the VWAP is itself near a resistance level. For 2:1 minimum, look for the previous intraday swing high above as the target.
Time window: Only execute this setup between 9:30 AM and 11:00 AM IST during the New York-equivalent killzone on NSE. Bullish Engulfing patterns below VWAP formed during the 11:30 AM–1:30 PM lunch lull have significantly lower follow-through due to reduced institutional participation.
The Dhanith Intraday Screener pre-filters the NSE stocks where this exact setup forms with the highest frequency. Instead of scanning 2,000 stocks manually, you get a focused list of high-momentum candidates every session.
Strategy 4 — Bullish Engulfing at Moving Average Support (Swing Trading)
Moving averages provide dynamic, institutionally-watched support levels that align powerfully with Bullish Engulfing formations on daily and weekly charts.
The moving average hierarchy for Bullish Engulfing setups:
20 EMA — Short-term trend support: In an uptrend, the 20 EMA acts as dynamic support during pullbacks. A Bullish Engulfing at the 20 EMA signals the pullback is ending and the primary uptrend is resuming. This setup is best for momentum swing traders in strongly trending markets.
50 SMA — Intermediate trend support: A Bullish Engulfing at the 50 SMA signals that the medium-term uptrend is intact and buyers are defending a widely-watched institutional level. This setup is highly reliable in moderate uptrends.
200 SMA — Long-term trend support: The most powerful moving average setup. A Bullish Engulfing at the 200 SMA — with above-average volume — signals institutional defence of the long-term bull trend. These setups are rare (perhaps 2–4 times per year on a given stock) but produce some of the largest directional moves of any candlestick setup.
Setup conditions:
- Stock in an established uptrend (higher highs and higher lows on the daily chart)
- Price has corrected toward the 20 EMA, 50 SMA, or 200 SMA
- Price touches or briefly closes below the moving average (confirming the test)
- A Bullish Engulfing forms at the moving average
- Volume on Day 2 is above the 20-day average
- RSI has pulled back to 40–55 range (not oversold — suggests healthy correction, not breakdown)
Entry: At the close of Day 2 (the Engulfing candle)
Stop: Below the Day 1 low AND below the moving average. If price closes below the moving average support, the entire setup is invalidated — bulls have failed to defend the trend.
Target: Most recent swing high above. In strong trends, consider using the trend's extension as a secondary target.
| Moving Average | Best Trend Context | Frequency | Signal Weight |
|---|---|---|---|
| 20 EMA | Strong short-term uptrend | Very frequent | High |
| 50 SMA | Moderate medium-term uptrend | Moderate | Very High |
| 200 SMA | Intact long-term uptrend | Rare | Maximum |
Strategy 5 — Bullish Engulfing as Continuation Signal (Second-Chance Entry)
This is the most underused and often most profitable application of the Bullish Engulfing — using it within an existing uptrend, not as a reversal from a major downtrend, but as a re-entry signal after a brief pullback.
The problem this solves: Strong trends require a different entry approach. Instead of waiting for a deep retracement, you need to learn how to enter during momentum. Waiting for a perfect pullback can cause you to miss the entire move.
When a strong uptrend only gives brief, shallow pullbacks — falling just below the 20 EMA for 2–3 candles before resuming upward — a traditional support-bounce entry may not appear. But a Bullish Engulfing within the pullback provides a specific, definable re-entry signal.
Setup conditions:
- Primary trend is clearly bullish (daily chart in HH/HL uptrend)
- Stock is above its 50 SMA (intermediate uptrend confirmed)
- Price pulls back shallowly — 2–4 bearish sessions that retrace a modest portion of the prior leg
- A Bullish Engulfing forms within the pullback — Day 1 is one of the bearish pullback candles, Day 2 engulfs it completely with above-average volume
- RSI is between 40–55 during the pullback (not deeply oversold — confirming shallow, healthy correction)
Entry: At the close of Day 2 (the Engulfing continuation candle)
Stop: Below the Day 1 low of the Engulfing pattern — which is typically above the prior major support (since the pullback is shallow)
Target: The continuation of the primary trend — the next swing high above, or a measured move based on the prior leg's length
Why this is high probability: You are trading with the primary trend (not against it), entering at the most favorable pullback level where buyers have demonstrated control, and the setup has both the pattern confirmation (Engulfing) and the trend confirmation (primary uptrend intact). Trading the bullish engulfing pattern with the trend is more reliable and provides high-probability setups.
Part 6: Stop Loss and Target — The Complete Rules
Stop Loss Placement
The universal Bullish Engulfing stop loss rule: Place your stop below the lowest point of the entire two-candle pattern — specifically below the lower of Day 1's low and Day 2's low — with a 0.2–0.3% buffer.
Most commonly, Day 2's low is lower than Day 1's low (since Day 2 opens at or below Day 1's close and may wick lower briefly). In this case, the stop goes below Day 2's lowest wick.
Why below the pattern's lowest low: The entire Bullish Engulfing structure — both candles — represents the buyer takeover zone. If price drops below this entire zone, both the Engulfing candle and the preceding bearish candle have been violated. The buyer takeover has completely failed. There is no valid reason to remain in the trade.
Why not below just Day 1's low: Day 2 (the Engulfing candle) opens at or below Day 1's close and may wick briefly below Day 1's low before surging upward. A stop below only Day 1's low gets triggered by this normal Day 2 wick before the rally begins.
Buffer sizing for Indian stocks:
- Large-cap NSE stocks (₹500+ price): 0.2–0.3% below the pattern low
- Mid-cap stocks: 0.3–0.5% buffer
- 5-minute intraday chart: 0.3–0.5% of stock price
Target Setting Rules
Primary target: The previous swing high — the level from which the current downtrend began. This is where the first significant supply (sellers) exists and where you should book the first portion of profit.
Secondary target: Beyond the primary swing high, the next significant resistance or the beginning of the decline from which the most recent downtrend originated.
Minimum risk-reward: 2:1. If the distance from entry to stop is ₹20, the primary target must be at least ₹40 above entry. If this minimum is not achievable (if overhead resistance is too close), skip the trade. A correct pattern entry at bad risk-reward is not a good trade.
The scale-out approach:
- At 1:1 (risk covered): Close 25–30% of position, move stop to breakeven
- At 2:1 (primary target): Close another 40–50% of position
- Let the remaining 20–25% run with a trailing stop behind each new swing low
Before entering any Bullish Engulfing trade, calculate your exact position size. Use the Dhanith Risk Management Calculator — enter your stop distance and account size to get your exact share count and maximum loss instantly.
Part 7: Bullish Engulfing vs. Bearish Engulfing vs. Related Patterns
Bullish Engulfing vs. Bearish Engulfing
| Feature | Bullish Engulfing | Bearish Engulfing |
|---|---|---|
| Prior trend | Downtrend | Uptrend |
| Day 1 candle | Bearish (red) | Bullish (green) |
| Day 2 candle | Bullish (green) | Bearish (red) |
| Day 2 engulfs | Day 1's bearish body | Day 1's bullish body |
| Signal | Bullish reversal | Bearish reversal |
| Location | At support | At resistance |
| Psychology | Buyers overwhelm sellers | Sellers overwhelm buyers |
| Win rate | 53–65% with filters | 57–65% with filters |
Both patterns share the same structural logic — a complete single-session reversal of the prior session's direction — applied in opposite trend contexts.
Bullish Engulfing vs. Bullish Piercing Line
The Bullish Engulfing and Bullish Piercing Line are frequently confused. Both are two-candle bullish reversal patterns. The critical difference:
| Feature | Bullish Engulfing | Bullish Piercing Line |
|---|---|---|
| Day 2 close | Above Day 1's open (100% engulfment) | Above Day 1's midpoint (50% recovery) |
| Strength | Stronger — complete engulfment | Strong — more than 50% recovery |
| Reliability | High | Highest individual win rate of all 75 patterns |
The Bullish Piercing Line requires Day 2 to close above the midpoint of Day 1's body — at least 50% recovery — but not necessarily full engulfment. The Bullish Engulfing requires full engulfment (Day 2 close above Day 1's open). Both are bullish, but the Engulfing is more visually decisive.
Bullish Engulfing vs. Bullish Harami
| Feature | Bullish Engulfing | Bullish Harami |
|---|---|---|
| Relative size | Day 2 LARGER than Day 1 | Day 2 SMALLER than Day 1 |
| Engulfment | Day 2 engulfs Day 1 | Day 1 "contains" Day 2 |
| Signal strength | Strong — decisive buyer win | Weak — only a pause in selling |
| Confirmation needed | One candle | Requires Day 3 confirmation |
The Harami is the Engulfing's opposite in a sense — in the Harami, the bigger candle is Day 1 and Day 2 is contained inside it (indicating uncertainty). In the Engulfing, the bigger candle is Day 2 (indicating decisive buyer control).
Part 8: Bullish Engulfing on Different Timeframes
Daily Chart — The Most Reliable
The daily Bullish Engulfing is the single most reliable version. Each candle represents a full trading session — institutional traders, fund managers, and algorithmic systems all participate, and the body-to-body engulfment represents genuine single-session buyer takeover with real volume.
For NSE swing traders, a daily Bullish Engulfing at a key support level is a primary setup signal. The trade typically plays out over 3–10 sessions, offering clean entry, stop, and target levels.
Weekly Chart — Maximum Power
A weekly Bullish Engulfing represents five full days of buyer-seller battle. When the weekly candle opens lower than the prior week's close and closes above the prior week's open — erasing an entire week of selling in a single week — the reversal signal carries enormous institutional weight.
Weekly Bullish Engulfing patterns are rare (perhaps 4–8 times per year on a given stock) but extremely significant. They often mark multi-month bottoms, not just brief pullback entries.
5-Minute and 15-Minute Chart — Intraday NSE Application
Intraday Bullish Engulfing on 5-minute charts works best during the 9:30–11:00 AM NSE session — the primary institutional activity window. The three requirements remain identical (prior decline, complete body engulfment, volume confirmation) but the "prior decline" may be just 3–5 bearish candles.
The most reliable intraday Engulfing setups on NSE combine:
- Pattern below VWAP (bearish session zone — reversal is significant)
- Engulfing candle volume at least 1.5× the session average
- RSI below 50 but turning upward
- Entry: 5-minute chart close of the Engulfing candle
- Stop: Below Day 1's low of the Engulfing pattern
- Target: VWAP (first target) then previous intraday high
Part 9: Common Bullish Engulfing Mistakes and Exact Fixes
Mistake 1 — Trading Incomplete Engulfment
Entering on a "near-engulfing" where Day 2 closes slightly below Day 1's open — the engulfment is not complete. The "close enough" reasoning produces a lower-quality setup with measurably worse win rates.
The fix: The close of Day 2 must be at or above the open of Day 1. No exceptions. A partial engulfment (Bullish Piercing Line) is a different, valid pattern — trade it with its own rules, not with the Engulfing's rules.
Mistake 2 — Ignoring the Prior Trend
Entering a Bullish Engulfing in a sideways, choppy market or after only one or two bearish candles. Without a genuine prior downtrend to reverse, the "reversal" signal has no trend to reverse.
The fix: The most reliable setups occur after at least 5 consecutive bearish sessions. Less than 3 is insufficient. In sideways markets, skip Engulfing patterns entirely — they produce far more false signals without a clear prior trend.
Mistake 3 — Entering on Low Volume
A visually perfect Bullish Engulfing on below-average volume. The institutional participation that makes the reversal sustainable is absent.
The fix: Day 2 (the Engulfing candle) must have volume above the 20-period average — ideally 1.5× above. Below-average volume Engulfings produce measurably lower win rates. If the pattern's volume is below average, reduce position size significantly or skip entirely.
Mistake 4 — Wrong Stop Loss Placement
Stop placed at the bottom of Day 1's candle instead of below the complete pattern low. Day 2's wick briefly dips below Day 1's low and triggers the stop — then the reversal proceeds as expected without the trade.
The fix: Stop below the lowest point of the entire two-candle pattern (Day 1 and Day 2 combined), not just Day 1. The lowest wick of either candle marks the genuine invalidation level.
Mistake 5 — Trading Bullish Engulfing Against the Primary Trend
Finding a Bullish Engulfing on the 15-minute chart during a bearish daily downtrend and entering long. The intraday bullish signal is overwhelmed by the daily bearish institutional flow.
The fix: Apply the trend filter. Price above the 100 EMA? Only trade bullish patterns. Below it? Only bearish patterns. This single filter eliminates most counter-trend Engulfing losses. Daily chart structure overrides intraday Engulfing signals.
Mistake 6 — Setting Target Too Close
Setting a target of 1:1 (risk equals reward) on a Bullish Engulfing setup where the pattern identified a meaningful reversal with much larger potential.
The fix: Minimum 2:1. The Bullish Engulfing at the bottom of a multi-session decline targeting the prior swing high almost always provides 2:1+ risk-reward. If a specific setup does not offer 2:1 because overhead resistance is too close — skip the setup. A correct pattern at bad risk-reward is not a good trade.
FAQ
Q: What is a Bullish Engulfing pattern? A Bullish Engulfing pattern is a two-candle bullish reversal formation. Day 1 is a bearish candle confirming the downtrend. Day 2 is a larger bullish candle whose body completely engulfs Day 1's body — opening at or below Day 1's close and closing at or above Day 1's open. It signals that buyers have overwhelmed sellers so decisively in a single session that the entire prior session's decline has been erased and extended. It appears after downtrends and signals potential trend reversal.
Q: What is the win rate of the Bullish Engulfing pattern? Research by Liberated Stock Trader puts the win rate at approximately 53% on the daily timeframe when traded in isolation. With confluence filters applied — recognised support level, RSI below 40 (oversold), and above-average volume on Day 2 — the win rate rises to 60–70%. Intraday studies show 55–65% win rates when volume aligns. The base pattern alone is insufficient; context and confirmation are what create the edge.
Q: What is the difference between Bullish Engulfing and Bearish Engulfing? Both patterns involve a two-candle complete engulfment, but in opposite trend contexts. Bullish Engulfing appears after a downtrend — a small bearish candle (Day 1) is completely engulfed by a larger bullish candle (Day 2) — and signals a bullish reversal. Bearish Engulfing appears after an uptrend — a small bullish candle (Day 1) is completely engulfed by a larger bearish candle (Day 2) — and signals a bearish reversal. The direction and trend context are the complete differences.
Q: Where should I place the stop loss for a Bullish Engulfing trade? Below the lowest point of the entire two-candle pattern — below the lower of Day 1's low and Day 2's low — with a 0.2–0.3% buffer for large-cap NSE stocks. The pattern's lowest wick represents the absolute price level at which the buyer takeover has completely failed. If price closes below this level, exit the trade. Never place the stop inside the pattern (between the two candles) as normal price movement within the pattern would trigger it prematurely.
Q: Do I need a confirmation candle for the Bullish Engulfing? The Bullish Engulfing itself provides two-candle confirmation — Day 2 completing the engulfment is the confirmation of Day 1's reversal signal. Some traders enter at Day 2's close without an additional Day 3 confirmation candle. For maximum reliability, entering at Day 3's open (after Day 2 has fully closed) adds confirmation that the reversal has held. The trade-off: slightly worse entry price in exchange for a confirmed pattern. Both approaches are valid; Day 3 entry is recommended for beginners and on ambiguous setups.
Q: What is the best timeframe for the Bullish Engulfing pattern? Daily and weekly charts produce the most reliable Bullish Engulfing signals due to complete institutional participation over a full session or full week. For NSE intraday traders, the 5-minute chart during the 9:30–11:00 AM session produces actionable setups — particularly when the pattern forms below VWAP with volume confirmation. The pattern works on all timeframes but requires stronger volume confirmation on lower timeframes where random noise is higher.
Conclusion
The Bullish Engulfing pattern has been used by professional traders across centuries and markets for a simple reason: the complete single-session buyer takeover it represents is one of the most unambiguous signals of power shift available on a price chart.
Day 1 told you sellers were winning. Day 2 proved they lost — comprehensively, in a single session, with the entire evidence visible in the size and completeness of the bullish body.
Three principles to carry into every Bullish Engulfing trade:
1. Location is everything. A Bullish Engulfing at a recognised support level, at a moving average, or at VWAP is a fundamentally different proposition from the same pattern floating in mid-range. The structural level is the reason buyers are there. The Engulfing is the evidence that they've arrived.
2. Day 2 volume validates the signal. Below-average volume on the engulfing candle reduces a high-probability setup to a coin flip. Above-average volume — particularly 1.5× or more — confirms institutional participation and raises win rate meaningfully. Check it every time.
3. Trade with the primary trend whenever possible. Bullish Engulfing as a continuation signal (Strategy 5) within an established uptrend produces higher win rates than Bullish Engulfing fighting a bearish primary trend. When the pattern and the primary direction align, the probability compounds.
Master these three principles first. Apply them consistently before adding the indicator combinations and advanced setups. And track every Bullish Engulfing trade in your journal — after 30 trades, your data will show which configuration works best for your execution style and your chosen markets.
Further reading: Bullish Candle Anatomy: How to Read a Bullish Candlestick | Bearish Candle Anatomy: How to Read a Bearish Candlestick | Important Candlestick Patterns: The Complete Guide | Hammer Candlestick Pattern: Complete Trading Guide | RSI Trading Strategy: Complete Guide | Support and Resistance: The Complete Trading Guide | Volume Analysis Trading Strategy | Bollinger Bands Trading Strategy | Morning Star Candlestick Pattern: Complete Trading Guide | Shooting Star Candlestick Pattern: Complete Trading Guide | Bearish Engulfing Pattern: Complete Trading Guide | How to Trade Intraday Stocks in India | Technical Analysis Mastery: The Complete Guide | Smart Money Concepts: The Complete Mastery Guide | 5 Best Intraday Trading Strategies for NSE India
Ready to Trade the Bullish Engulfing on Real Stocks?
→ Open the Dhanith Intraday Screener — find today's NSE stocks where Bullish Engulfing setups are forming below VWAP on above-average volume
→ Calculate Your Position Size Before Every Trade — know your exact share count, stop distance, and maximum loss before entering
→ Log Every Engulfing Trade in the Dhanith Journal — track which configurations produce the best results for your execution style
Disclaimer: This article is for educational purposes only and does not constitute financial or investment advice. Trading in stocks and financial markets involves significant risk of capital loss. Past performance of any pattern does not guarantee future results. Always use proper risk management and stop losses.
Have a question about this article?
Comment on our latest Instagram post or send us a DM — we reply to every one.
@dhanith_officialWas this article helpful?
Click to rate
Founder, Dhanith Trading
7+ years trading Nifty, Bank Nifty, NSE stocks, and commodities — specializing in Smart Money Concepts (SMC) and ICT price action. Founder of Dhanith — a trading journal, intraday screener, and risk tools platform built for retail traders.
Dhanith Newsletter
Enjoyed this article? Get more like it.
New trading guides, candlestick patterns, SMC strategies, and tool updates — straight to your inbox. Free, for Indian traders.
No spam. Unsubscribe anytime.
Continue Reading