
9 Best Stocks for Short Term Investment in India: Technical Structure Breakdown (July 2026)
Most articles about the best stocks for short term investment in India give you a list of company names with no context, no levels, and no honest explanation of what "short term" actually means from a chart perspective. You get the name, a vague reason like "strong fundamentals" or "bullish momentum," and nothing specific enough to actually use.
This article is different.
What follows is a technical structure read on nine NSE stocks that have recently made strong impulsive advances and pulled back into identifiable reaction zones — specifically the Fibonacci Golden Ratio retracement zone (the price band between the 50% and 61.8% retracement of the prior move). Several of these stocks are also showing additional confluence signals at the same level: a close below the lower Bollinger Band, a reversal candlestick (harami, hammer, or doji), an unfilled Fair Value Gap (FVG), or a classic cup and handle pattern on the daily chart.
This is a chart-pattern breakdown for educational purposes. It is not a buy list, not a recommendation, and not a prediction of what these stocks will do next. What it is: an honest mapping of where each stock currently sits relative to its own structure — and why those specific levels are worth watching.
SEBI Disclaimer: This article is for educational purposes only and does not constitute investment advice or a recommendation to buy or sell any security. Dhanith Trading is not a SEBI-registered Research Analyst or Investment Adviser. Trading and investing in securities involves substantial risk, and small/mid-cap stocks in particular can be highly volatile. Please consult a SEBI-registered advisor before making any investment decisions.
How to Read This Analysis
Before the individual stocks, here is the framework being applied across all nine:
Fibonacci Retracement Zone (50%–61.8%): When a stock makes a strong impulsive advance, it frequently pulls back before continuing. The most commonly watched retracement zone is the 50% to 61.8% level of the prior move — often called the Golden Ratio zone in technical analysis. This is not a guarantee that price will bounce here. It is simply the zone where the prior trend statistically shows the most frequent reactions — either a reversal or, if the level breaks, an acceleration downward through it.
Bollinger Band Lower Band: When price closes below the lower Bollinger Band (set at 2 standard deviations below the 20-day moving average), it signals that price has extended significantly below its recent average. This is sometimes read as a short-term "oversold stretch" — not a buy signal by itself, but worth noting when it coincides with a structural level.
Candlestick Patterns (Hammer, Harami, Doji): Reversal candlestick patterns at structural levels add another layer of confluence. A hammer at a Fibonacci zone that is also below the Bollinger Band creates three independent technical signals at the same price — structurally more significant than any of them alone.
Fair Value Gap (FVG): An unfilled price imbalance created during the original impulsive move. Per SMC/ICT methodology, price tends to return to fill these gaps. When a stock sits inside an FVG at the same level as a Fibonacci reaction zone, the confluence is high.
The key principle: confluence of multiple independent signals at the same level is what makes a zone worth watching. It does not tell you which way price resolves. A pullback into a confluence zone can result in a bounce or a breakdown — the zone defines the "decision point," not the outcome.
To find these kinds of setups consistently before they develop, see How to Find the Best Intraday Stocks Using a Screener — the same screening logic applies to surfacing swing setups at structural levels, so you're watching the right stocks before the move, not after.
1. Data Patterns — Triple Confluence at Channel Support
Data Patterns has been in a rising parallel channel since February 2026, with a sharp approximately 22% advance to a swing high of ₹5,319.80. Price has since pulled back, reaching ₹4,343 — a level that lines up with three independent structural references simultaneously:
The lower trendline of the rising parallel channel (the same structural boundary that has held multiple prior pullbacks), the Fibonacci Golden Ratio zone (approximately ₹4,343–4,349), and a hammer candlestick that formed on the same daily candle that closed below the lower Bollinger Band.
Three separate technical frameworks converging at the same price zone is exactly what makes a level structurally significant.
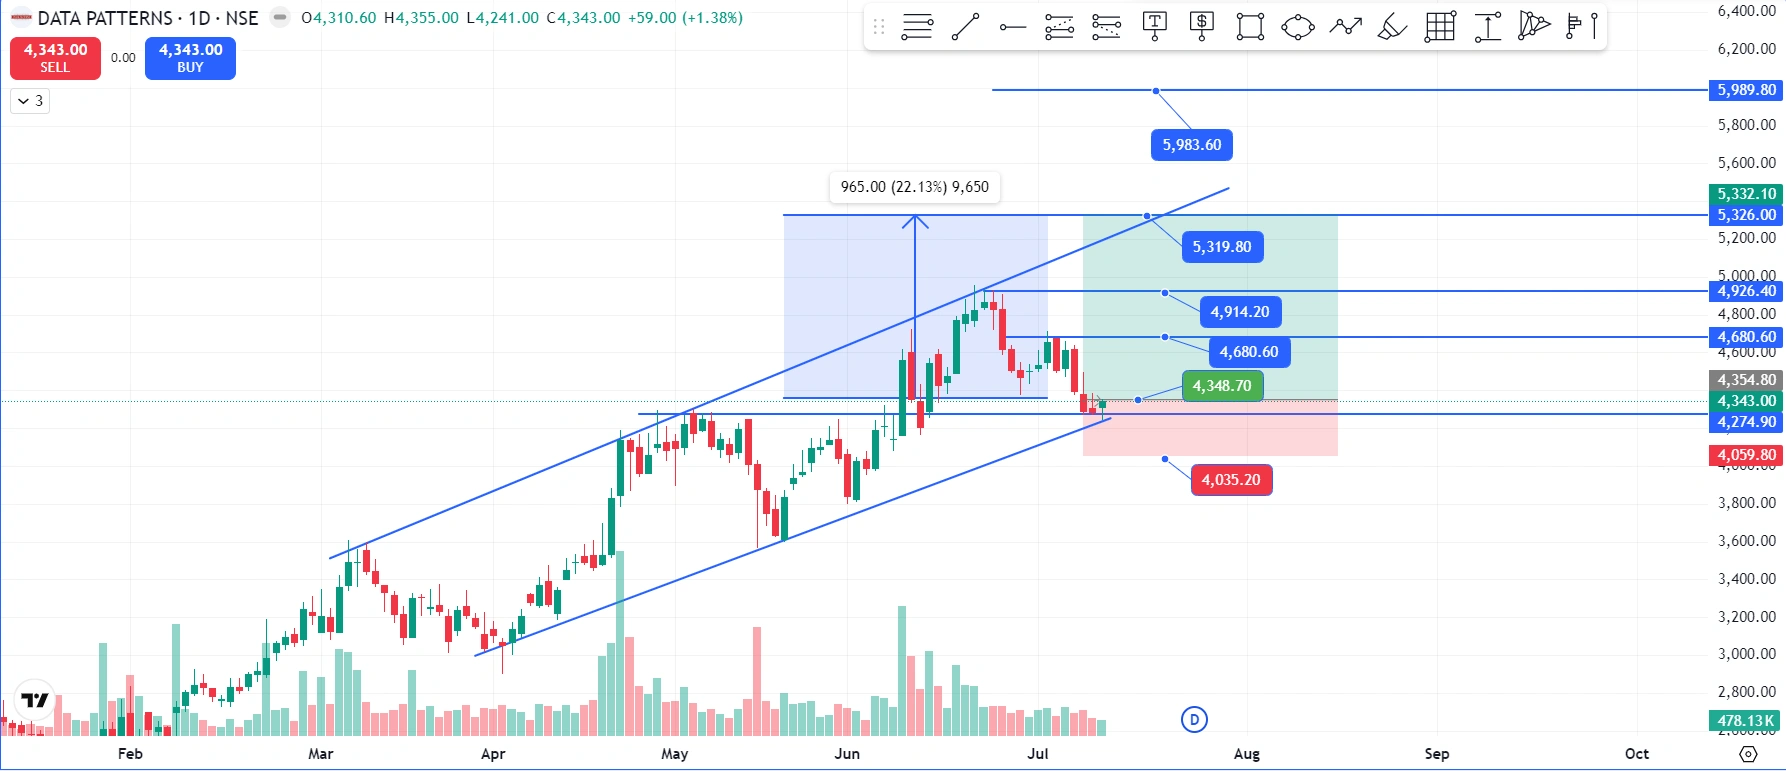
| Level Type | Price |
|---|---|
| Prior swing high | ₹5,319.80 |
| 50% retracement | ₹4,914.20 |
| 61.8% (Golden Ratio) | ₹4,680.60 |
| Channel support / reaction zone | ₹4,343 – ₹4,349 |
| Structural support below | ₹4,035.20 |
What to watch: Whether the hammer candle at ₹4,343 holds and price reclaims the channel interior, or whether the level breaks and price accelerates toward ₹4,035 as the next structural reference.
2. Hind Rectifiers — Cup and Handle + Hammer at Fibonacci
Hind Rectifiers is the standout structural setup on this list — primarily because the daily chart shows a textbook cup and handle pattern that formed over nearly a year (mid-2025 through mid-2026), followed by a sharp approximately 45% breakout advance to ₹1,538.70. That is not a minor move. A 45% advance after a year-long cup and handle breakout carries substantial momentum.
Price has since pulled back to ₹1,055.10, printing a hammer candlestick that also closed below the lower Bollinger Band on the same candle. The hammer sits directly inside the Fibonacci Golden Ratio zone of the prior impulsive move.
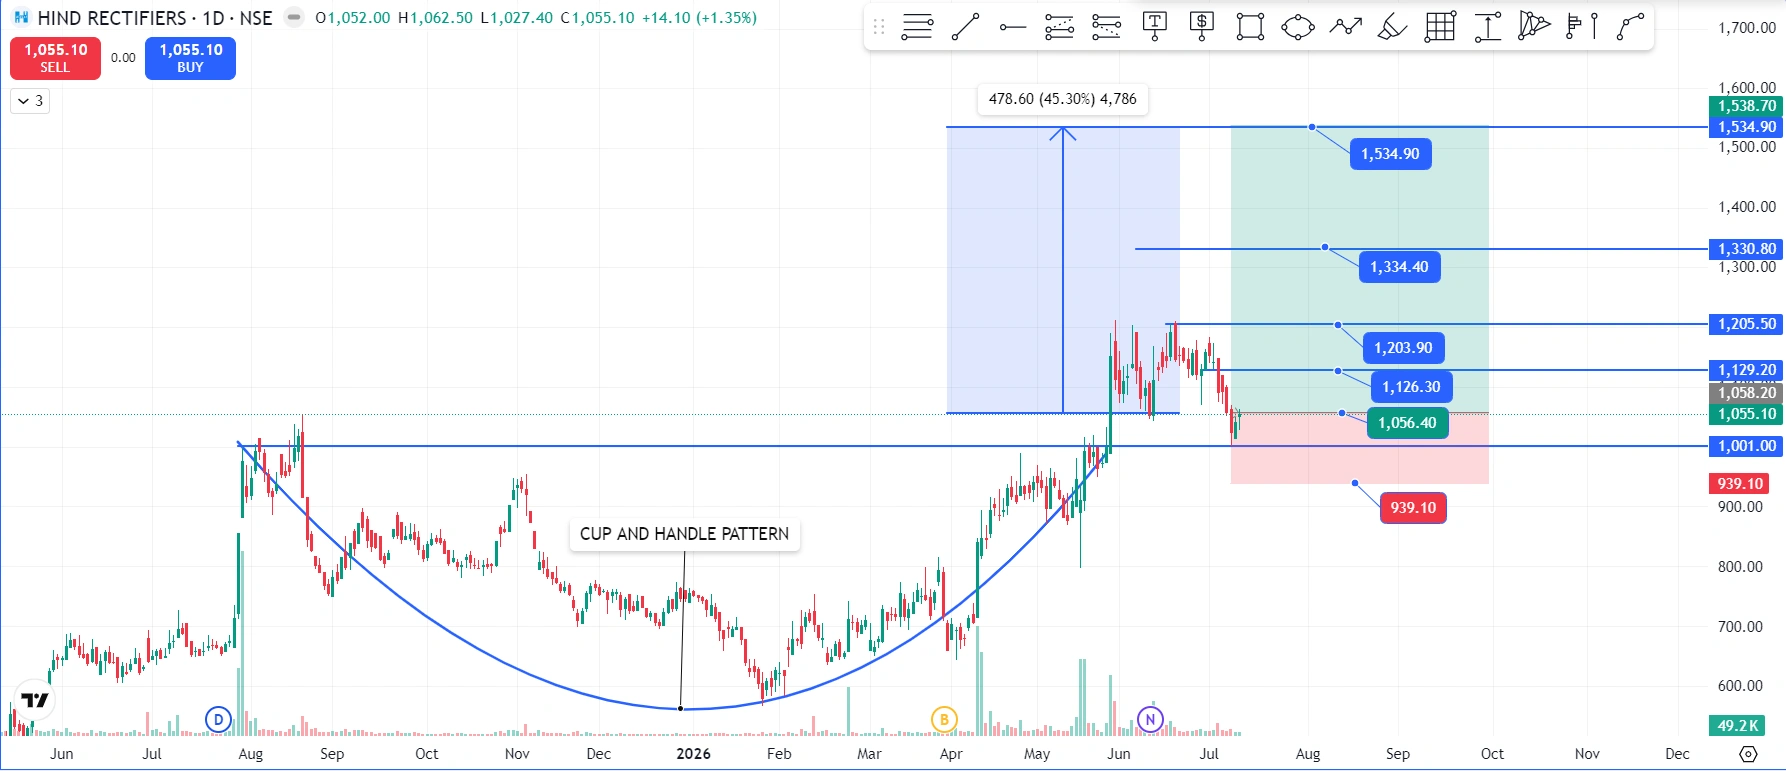
| Level Type | Price |
|---|---|
| Prior swing high | ₹1,538.70 |
| 50% retracement | ₹1,334.40 |
| 61.8% (Golden Ratio) | ₹1,203.90 |
| Hammer candle / reaction zone | ₹1,056 – ₹1,129 |
| Structural support below | ₹939.10 |
What makes this setup notable: The cup and handle pattern's measured-move target (the cup's depth projected from the breakout) points well above the prior swing high at ₹1,538. If the retracement holds at this zone, the prior pattern's target remains in play. If ₹939 is broken on volume, the setup is invalidated.
3. Sammaan Capital — Cup and Handle + Bollinger Band Below
Sammaan Capital rallied approximately 27% to ₹211.74, and has since pulled back to ₹166.46. The stock is currently trading below the lower Bollinger Band and is being rejected from its Golden Ratio zone. The daily chart also shows a cup and handle structure on a longer timeframe, adding a pattern-level reference to the shorter-term Fibonacci signals.
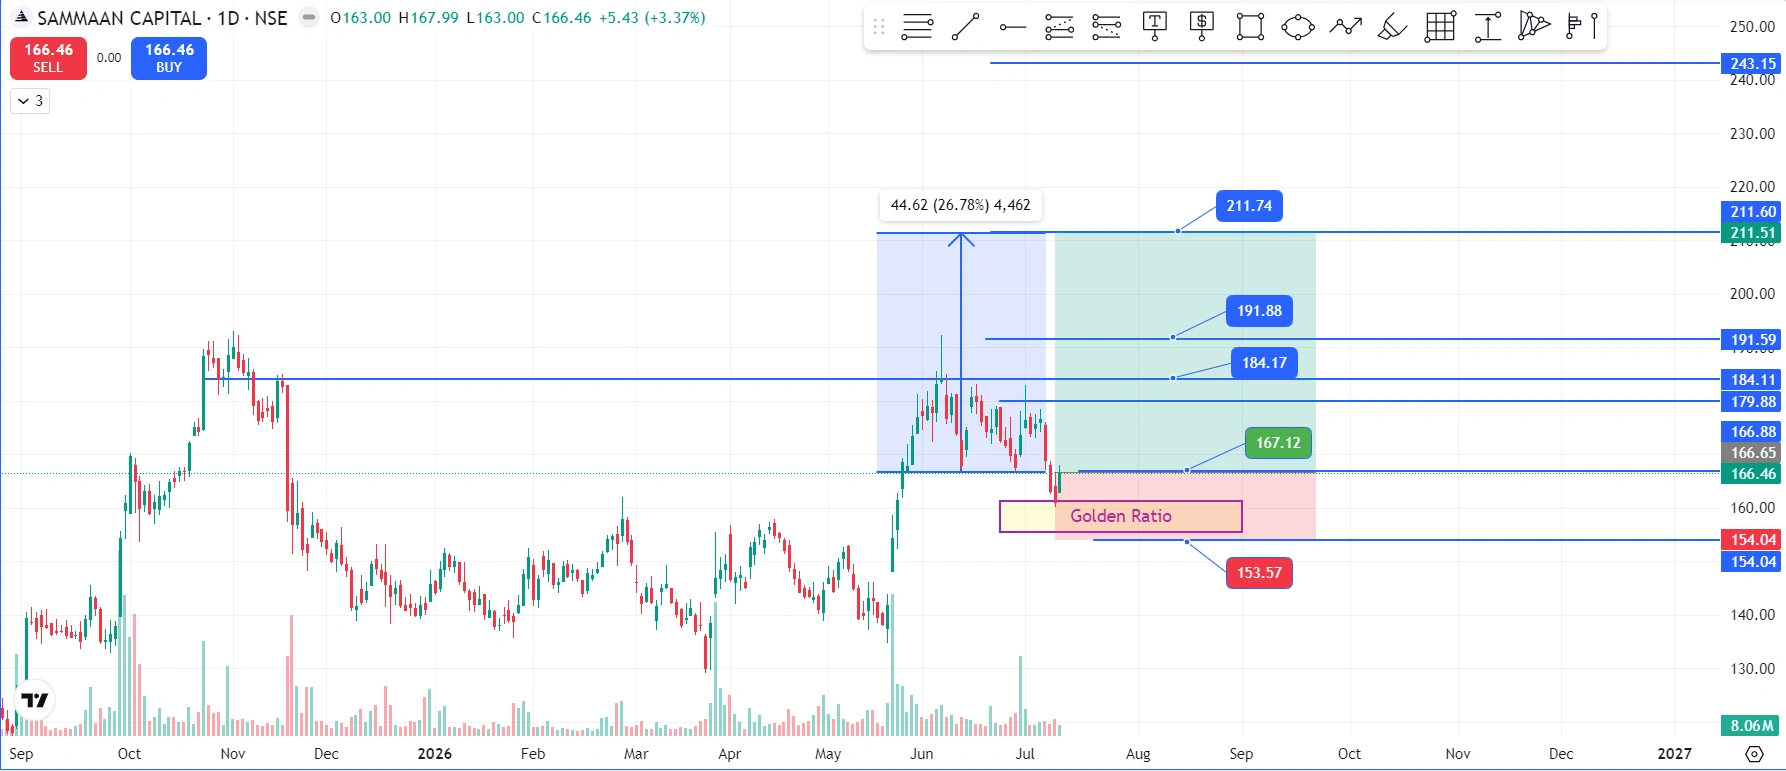
| Level Type | Price |
|---|---|
| Prior swing high | ₹211.74 |
| 50% retracement | ₹191.88 |
| 61.8% (Golden Ratio) | ₹184.17 |
| Current reaction zone | ₹167 – ₹180 |
| Structural support below | ₹153.57 |
What to watch: The ₹167–₹180 zone represents multiple levels of Fibonacci confluence. A sustained close below ₹153.57 would shift the structure to bearish at the daily timeframe.
4. Wheels India — Fair Value Gap Confluence at Pullback Low
Wheels India advanced over 33% to ₹2,037.10 before retracing. Price is now at ₹1,513.10 — sitting directly inside an unfilled Fair Value Gap left behind during the original impulsive move upward. The same daily candle closed below the lower Bollinger Band.
This is a different type of confluence than the other stocks on this list: instead of a Fibonacci reaction zone, the primary reference here is the FVG — the price imbalance created when Wheels India's impulsive advance moved too quickly for two-sided trading to occur. Per SMC methodology, price frequently returns to fill this imbalance before resuming.
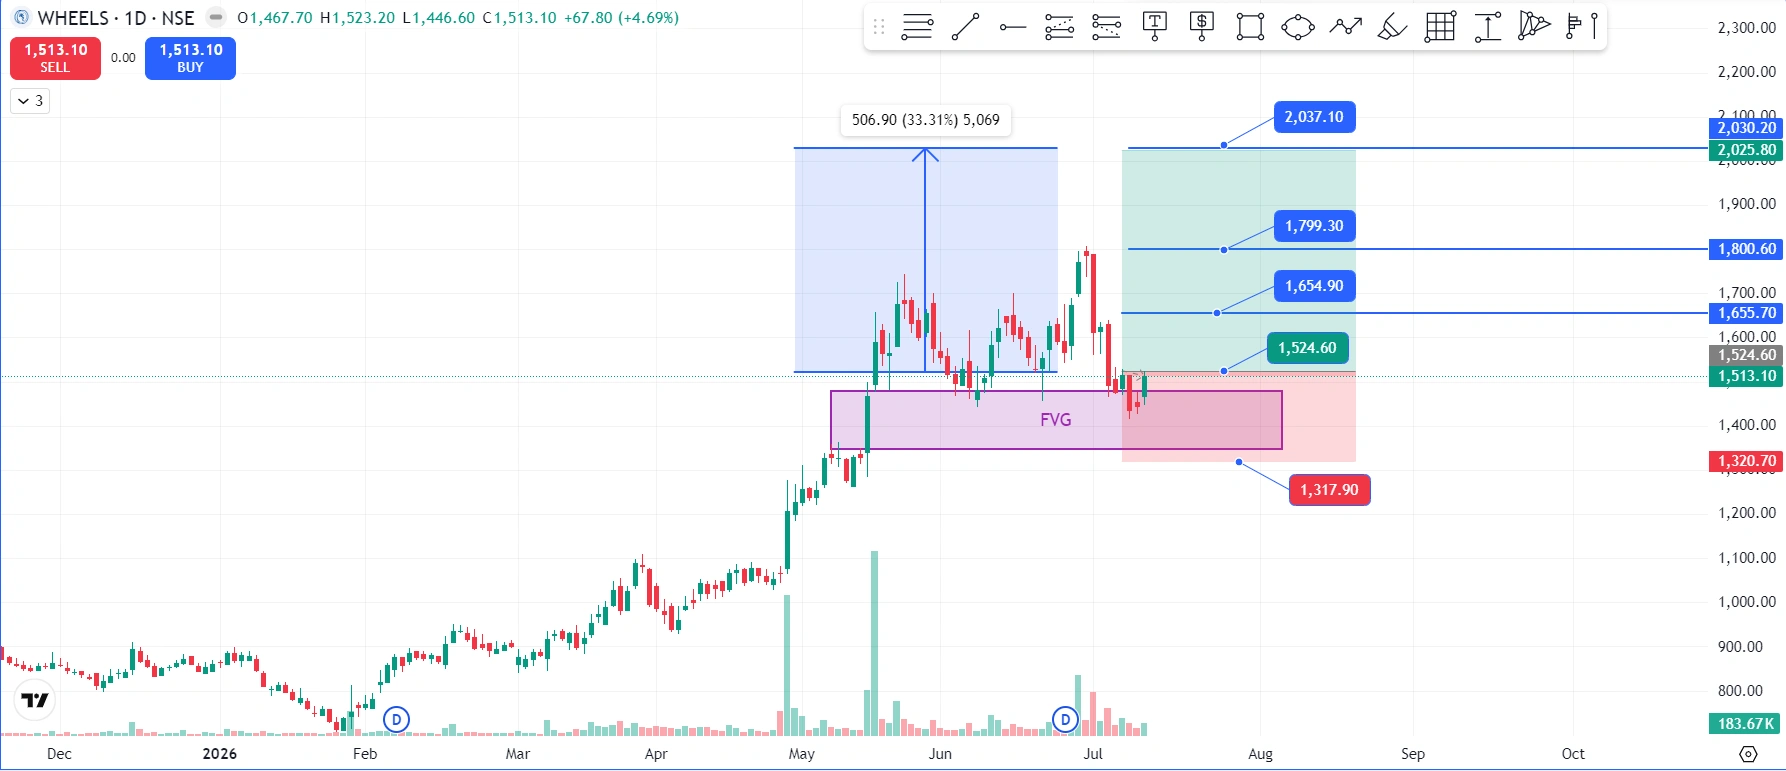
| Level Type | Price |
|---|---|
| Prior swing high | ₹2,037.10 |
| 50% retracement | ₹1,799.30 |
| 61.8% (Golden Ratio) | ₹1,654.90 |
| FVG / reaction zone | ₹1,513 – ₹1,525 |
| Structural support below | ₹1,317.90 |
What to watch: Whether the FVG at ₹1,513–₹1,525 acts as support (price reacts and recovers), or whether price closes below ₹1,513 decisively, suggesting the FVG is being filled completely before any recovery attempt.
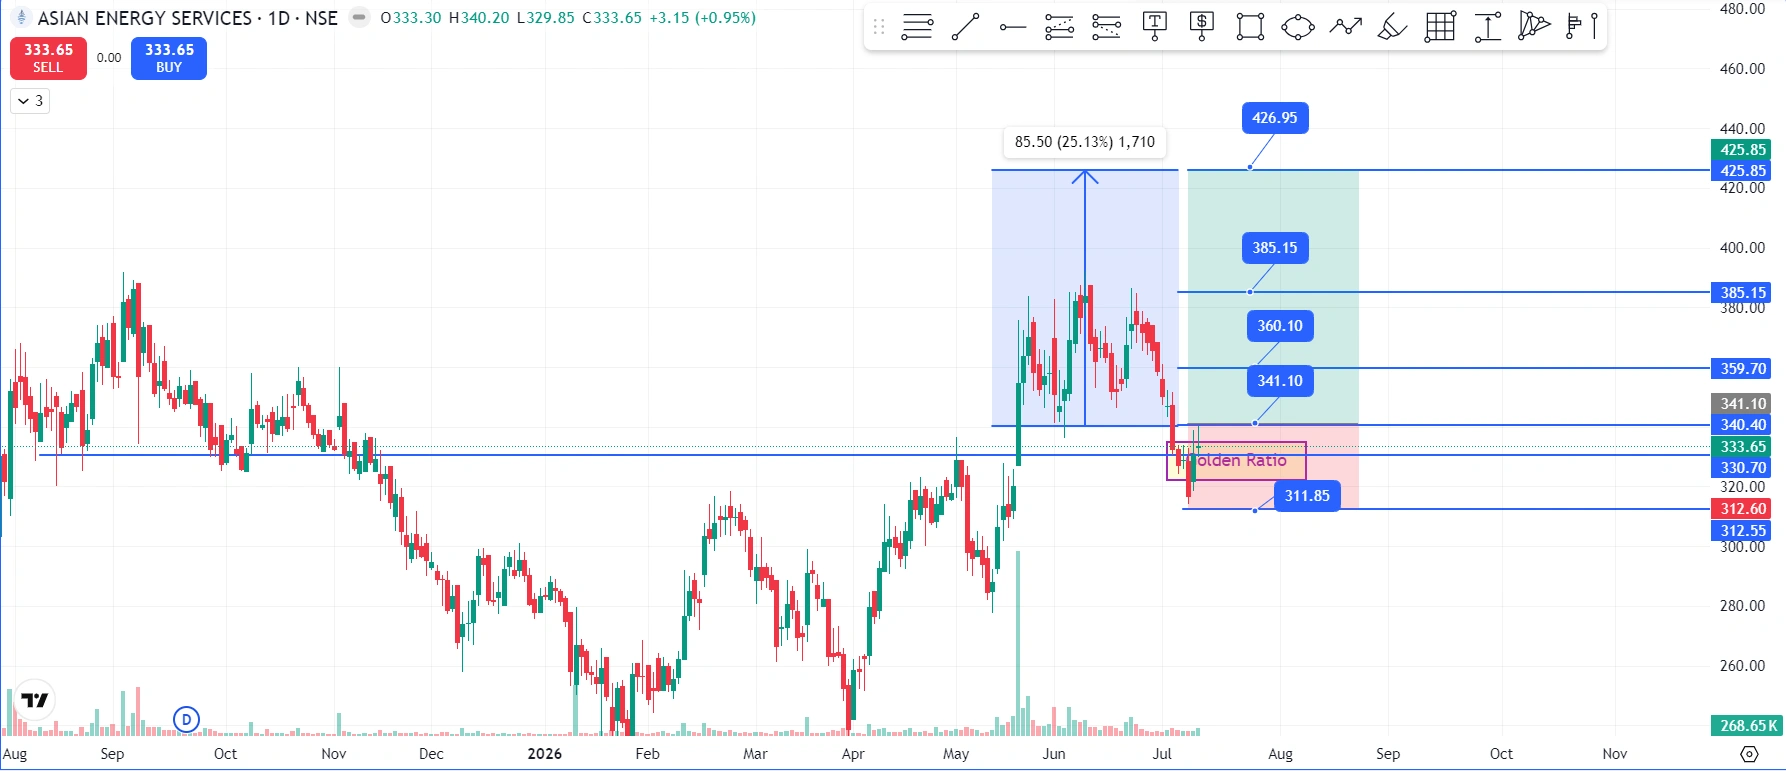
5. Asian Energy Services — Inside Golden Ratio with Bollinger Band Signal
Asian Energy Services rallied approximately 25% from its base before pulling back. It is now trading around ₹333.65 — right inside the Golden Ratio retracement zone of approximately ₹331–₹341. The most recent daily candle also closed below the lower Bollinger Band.
| Level Type | Price |
|---|---|
| Prior swing high | ₹426.95 |
| 50% retracement | ₹385.15 |
| 61.8% (Golden Ratio) | ₹331 – ₹341 |
| Structural support below | ₹311.85 |
What to watch: Price is currently inside the Golden Ratio zone. The resolution — hold and reverse, or break through toward ₹311.85 — is the structural question this zone poses. The Bollinger Band signal adds a short-term "oversold stretch" reading to the Fibonacci level.
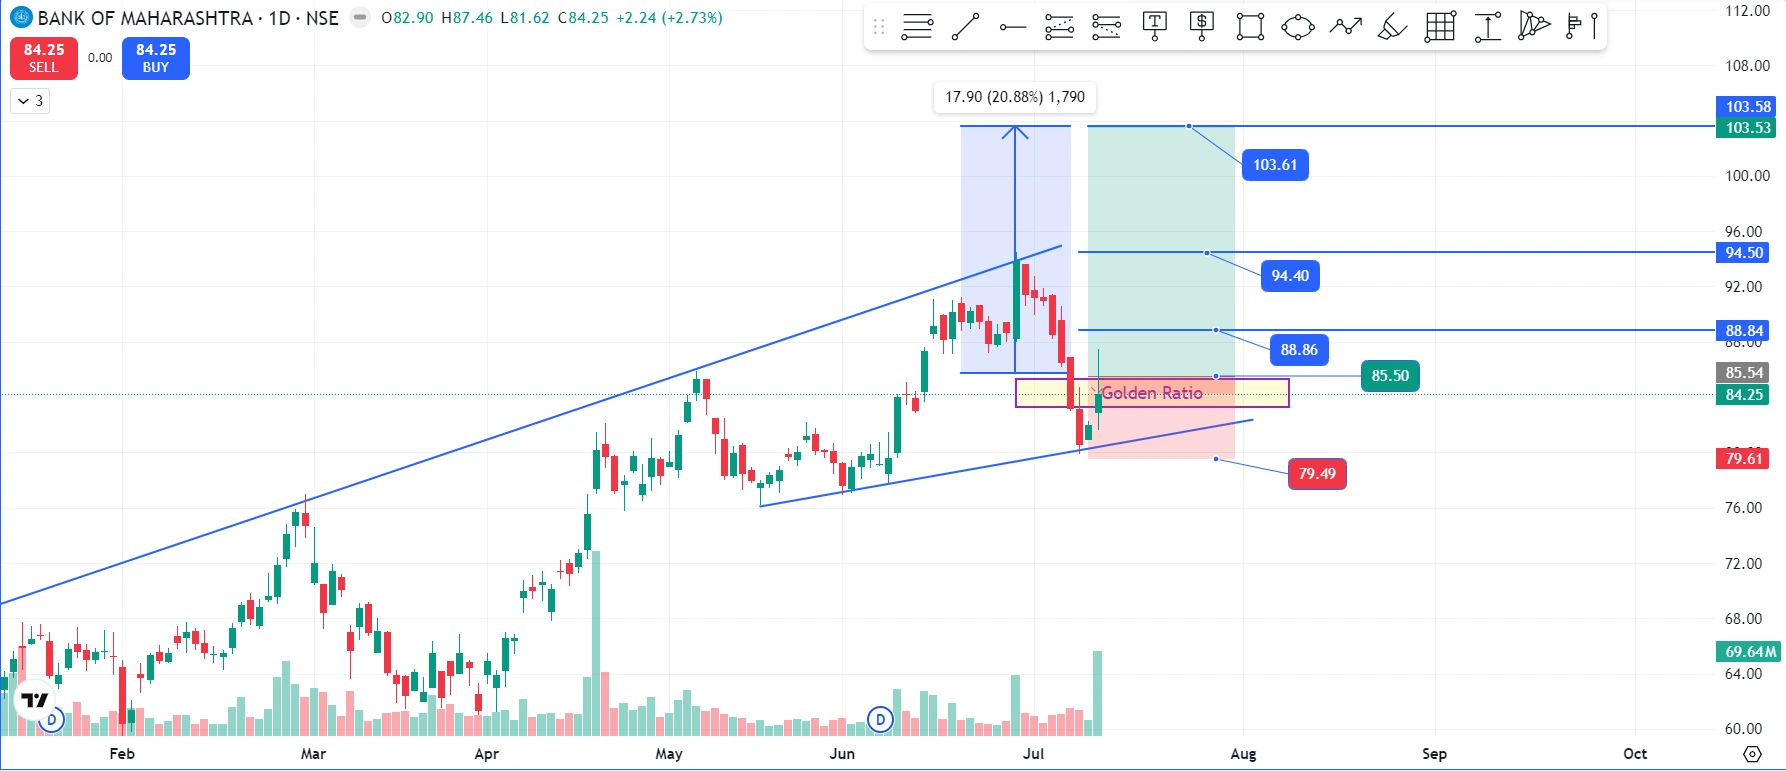
6. Bank of Maharashtra — Ascending Channel + Bullish Harami
Bank of Maharashtra has been in a well-defined ascending parallel channel since early 2026. After an approximately 21% advance to ₹103.61, price pulled back to ₹84.25 — directly on the channel's lower trendline — and formed a bullish harami candlestick pattern at that rejection.
A bullish harami is a two-candle reversal pattern where a large bearish candle is followed by a smaller candle whose range sits inside the prior candle's body — interpreted by some traders as a potential pause in downward momentum.
| Level Type | Price |
|---|---|
| Prior swing high | ₹103.61 |
| 50% retracement | ₹94.40 |
| 61.8% (Golden Ratio) | ₹88.86 |
| Channel support / harami zone | ₹84 – ₹85.50 |
| Structural support below | ₹79.49 |
What to watch: Whether the channel's lower trendline continues to hold as structural support. A daily close below ₹79.49 would break the ascending channel structure at the daily timeframe.
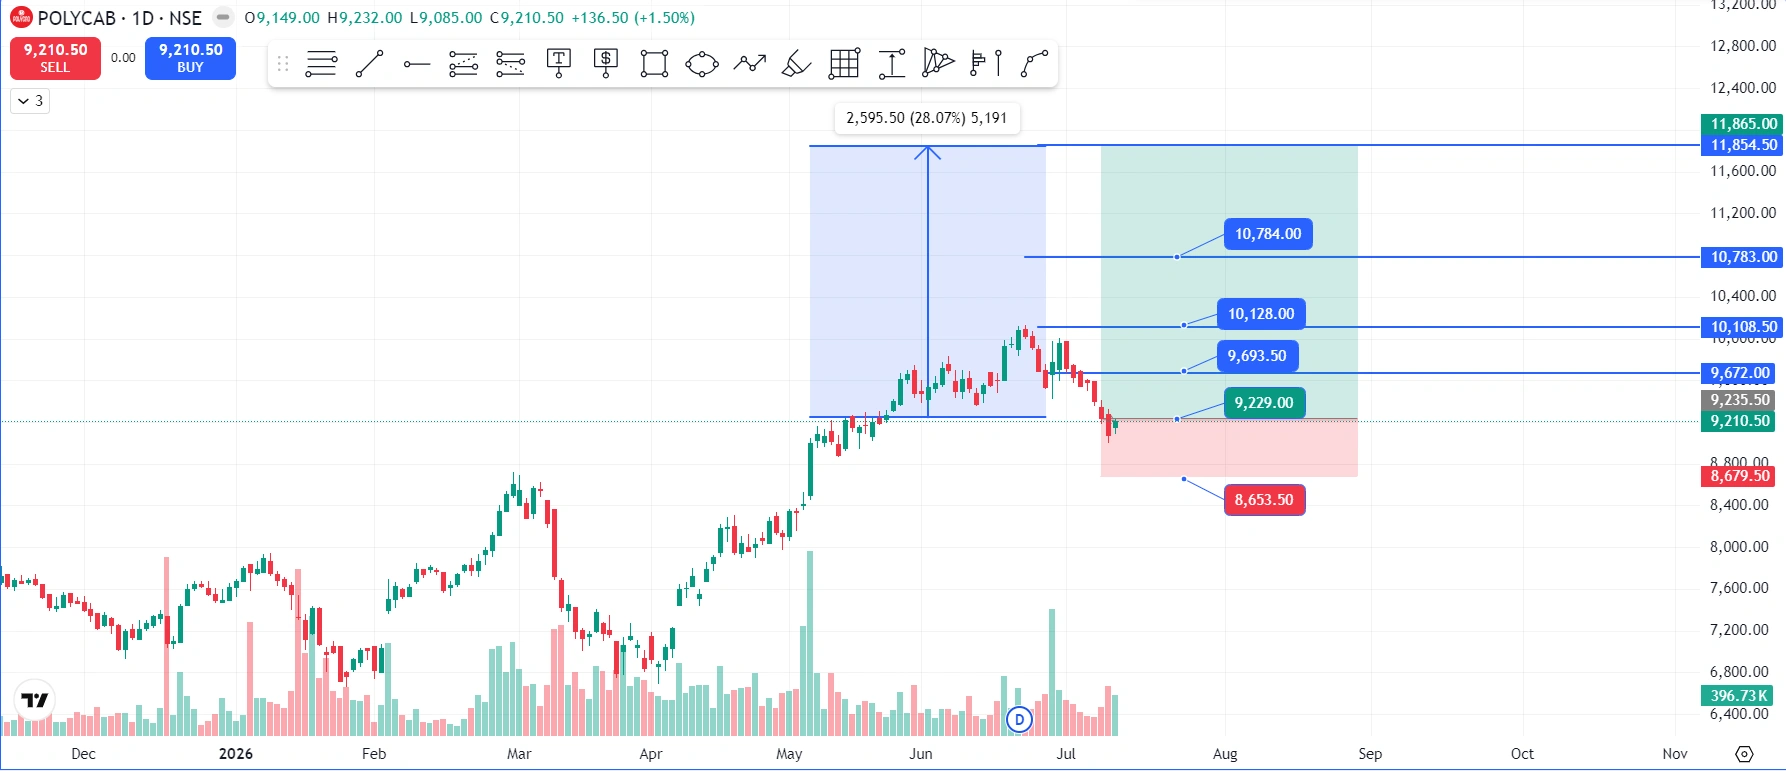
7. Polycab — Bullish Harami Below Bollinger Band
Polycab advanced roughly 28% to ₹11,865 — a significant advance for a large-cap electrical and cable company. It is now at ₹9,210.50, forming a bullish harami pattern on the daily chart with the same candle closing below the lower Bollinger Band.
| Level Type | Price |
|---|---|
| Prior swing high | ₹11,865.00 |
| 50% retracement | ₹10,784.00 |
| 61.8% (Golden Ratio) | ₹10,128.00 |
| Harami / Bollinger Band zone | ₹9,210 – ₹9,672 |
| Structural support below | ₹8,653.50 |
What to watch: Price is currently at the lower end of the Golden Ratio zone. The harami pattern and Bollinger Band signal both sit at ₹9,210 — the structural question is whether this level produces a meaningful reaction or whether price continues toward ₹8,653.50.
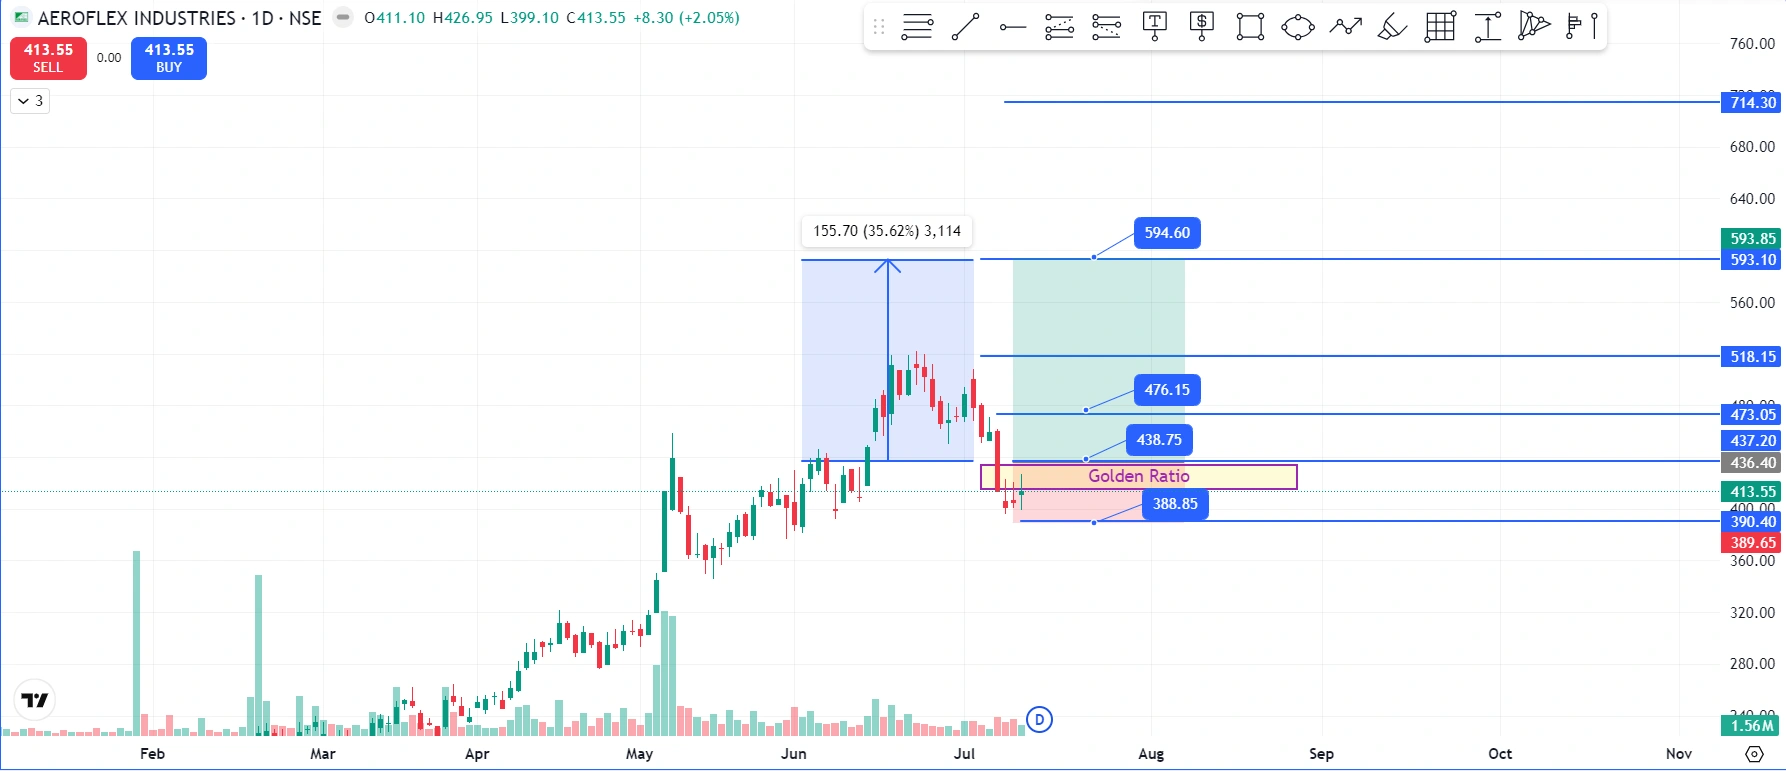
8. Aeroflex Industries — Doji at Golden Ratio
Aeroflex Industries rallied nearly 36% to a swing high of ₹593.85 before pulling back sharply to ₹413.55. The latest daily candle is a doji — a candlestick where the open and close are approximately equal, creating a narrow body with wicks extending in both directions — that also closed below the lower Bollinger Band.
A doji at a Fibonacci reaction zone is often read as market indecision after a stretch move: buyers and sellers are in equilibrium at this specific price, and the next candle's direction typically provides the resolution signal.
| Level Type | Price |
|---|---|
| Prior swing high | ₹593.85 |
| 50% retracement | ₹476.15 |
| 61.8% (Golden Ratio) | ₹413 – ₹438 |
| Doji / reaction zone | ₹413 – ₹438 |
| Structural support below | ₹388.85 |
What to watch: The doji candle itself is the indecision signal. The candle that follows it provides directional clarity — a bullish close above the doji high suggests holding, a bearish close below the doji low suggests continued weakness toward ₹388.85.
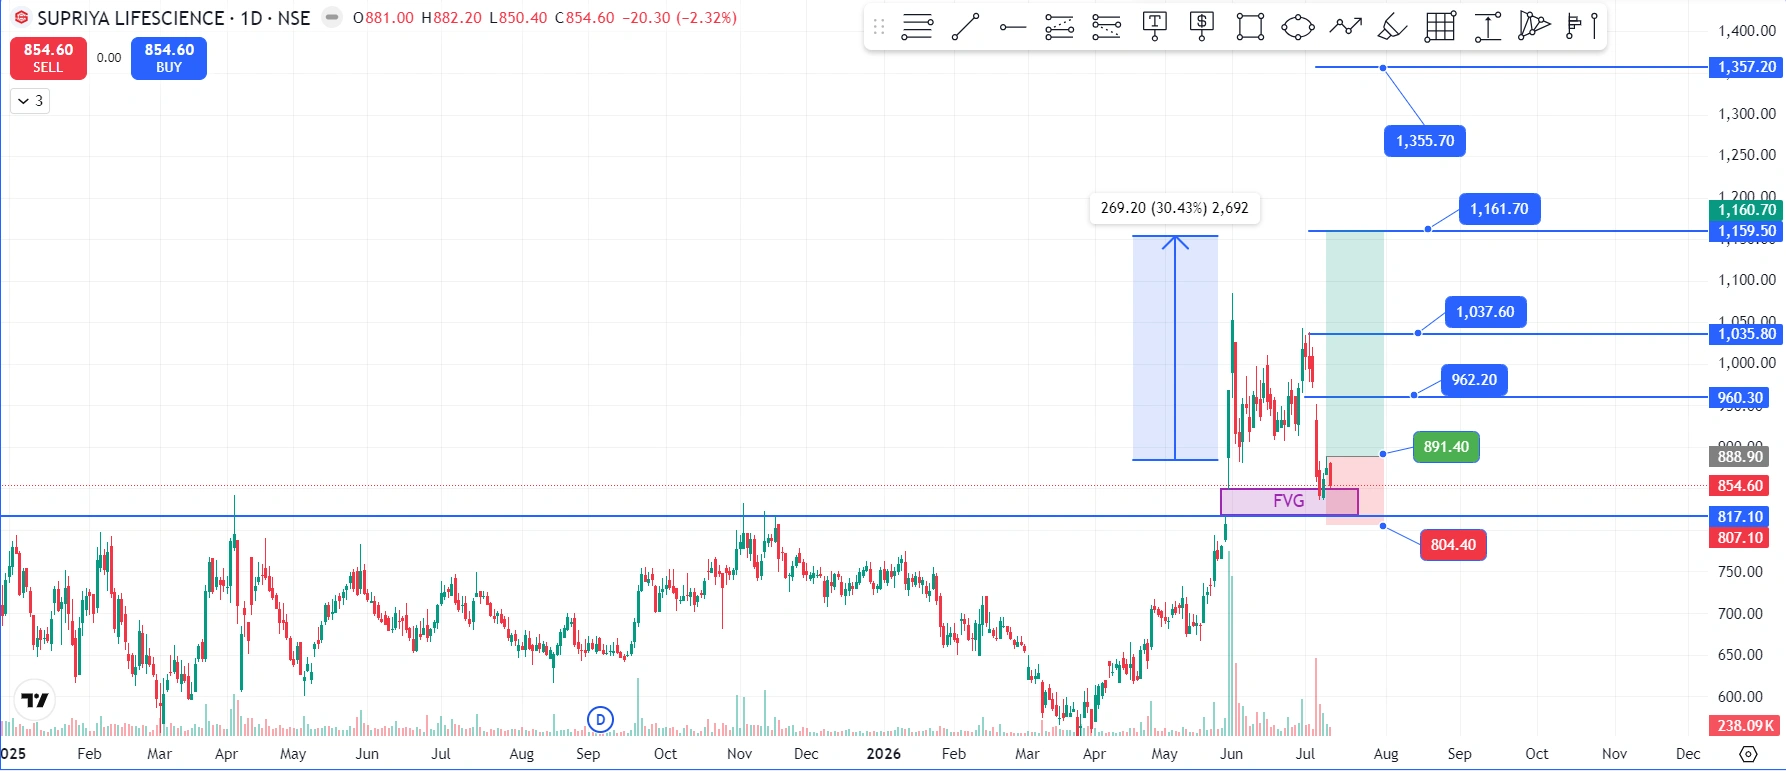
9. Supriya Lifescience — Largest Move, FVG Rejection at Bollinger Band
Supriya Lifescience made the largest percentage advance on this list — over 30% to ₹1,357.20 — before a significant retracement. It closed down 2.32% at ₹854.60, trading above its previous breakout zone but currently rejected from an unfilled Fair Value Gap, with the candle also closing below the lower Bollinger Band.
| Level Type | Price |
|---|---|
| Prior swing high | ₹1,357.20 |
| 50% retracement | ₹1,161.70 |
| 61.8% (Golden Ratio) | ₹1,037.60 |
| FVG / reaction zone | ₹855 – ₹891 |
| Structural support below | ₹804.40 |
What to watch: The FVG at ₹855–₹891 is the primary level. Price is currently at the bottom of this zone. A daily close below ₹804.40 would shift the structure from "pullback within uptrend" to "potential trend reversal" at the daily timeframe.
The Confluence Summary — All 9 Stocks at a Glance
| Stock | Current Price | Reaction Zone | Additional Signal |
|---|---|---|---|
| Data Patterns | ₹4,343 | ₹4,343 – ₹4,349 | Channel support + Hammer + Bollinger Band |
| Hind Rectifiers | ₹1,055 | ₹1,056 – ₹1,129 | Cup & Handle + Hammer + Bollinger Band |
| Sammaan Capital | ₹166.46 | ₹167 – ₹180 | Cup & Handle + Bollinger Band |
| Wheels India | ₹1,513 | ₹1,513 – ₹1,525 | Fair Value Gap + Bollinger Band |
| Asian Energy | ₹333.65 | ₹331 – ₹341 | Bollinger Band |
| Bank of Maharashtra | ₹84.25 | ₹84 – ₹85.50 | Channel support + Bullish Harami |
| Polycab | ₹9,210 | ₹9,210 – ₹9,672 | Bullish Harami + Bollinger Band |
| Aeroflex Industries | ₹413.55 | ₹413 – ₹438 | Doji + Bollinger Band |
| Supriya Lifescience | ₹854.60 | ₹855 – ₹891 | Fair Value Gap + Bollinger Band |
How to Use This Analysis Properly
These nine stocks share one structural trait: each made a strong impulsive advance and has pulled back into a reaction zone. That convergence of multiple independent technical signals at the same price is what makes a level structurally interesting to watch.
What this analysis cannot tell you — and what no analysis can tell you — is which way each stock resolves at these levels. A pullback into a Fibonacci zone with a hammer candle below the Bollinger Band can result in:
Scenario A: Price holds the zone, buyers overwhelm sellers, and the prior uptrend resumes — the most structurally expected outcome given the signals.
Scenario B: Price briefly holds, shows some recovery, then breaks down through the zone on volume — signaling that the retracement has become a reversal.
Scenario C: Price continues straight through the zone without pausing — signaling that the level failed entirely and the next structural reference (the "Structural support below" in each table) becomes the new decision zone.
The zone defines where the decision happens. Your trading plan and risk management define what you do when price gets there.
Want to find setups like these consistently, before they reach decision zones? See How to Find the Best Intraday Stocks Using a Screener — the same screening discipline applies to building a swing watchlist on technical structure, not tips or guesswork. Run it every morning as part of your pre-market routine.
Understanding the Technical Concepts Used in This Analysis
What Is the Fibonacci Golden Ratio Zone?
The Fibonacci retracement tool maps percentage pullbacks from a prior swing move. The 50% and 61.8% levels are the most widely watched — the range between them is commonly called the Golden Ratio zone or the OTE (Optimal Trade Entry) zone in ICT/SMC methodology. Short-term price action matters, but the broader market context and structural levels are what separate disciplined analysis from speculation.
What Does a Close Below the Lower Bollinger Band Mean?
The lower Bollinger Band sits 2 standard deviations below the 20-day moving average. A close below it means price has moved significantly further from its recent average than it does approximately 95% of the time. This does not predict a bounce — but it does indicate that price has stretched beyond its typical range, which is one reason some traders watch these closes for potential mean reversion setups at structural levels.
What Is a Fair Value Gap (FVG)?
A Fair Value Gap is a price imbalance created when an impulsive move occurs so quickly that no two-sided trading takes place in a specific price range. In Smart Money Concepts and ICT methodology, price frequently returns to these imbalances before continuing in the original direction. When a stock sits inside an FVG while also being below the Bollinger Band, two independent frameworks are pointing to the same price zone.
What Is a Cup and Handle Pattern?
A cup and handle is a bullish continuation pattern characterized by a rounded base (the cup) followed by a smaller, brief pullback (the handle) before a breakout to new highs. When a stock has just broken out of a cup and handle pattern and is pulling back toward the pattern's prior structure, the retracement is often watched as a potential continuation entry rather than a reversal.
Final Thoughts
The best stocks for short term investment in India are not found by reading a generic "Top 10 stocks to buy" article written without reference to price levels, technical structure, or risk management. They are found by understanding where structurally significant levels are, watching how price behaves when it reaches those levels, and having a defined plan for what you do in each outcome.
These nine stocks are at structurally interesting levels right now — defined by their own prior moves, their own Fibonacci zones, their own candlestick signals. Whether they represent opportunities depends entirely on how each one behaves at these levels over the coming sessions, and on your own trading plan, timeframe, and risk tolerance.
Watch the levels. Let price give you the signal. Manage risk on whatever setup you decide to act on.
Disclaimer: This article is for educational purposes only and does not constitute investment advice, a buy or sell recommendation, or a research report. Dhanith Trading is not a SEBI-registered Research Analyst or Investment Adviser. All price levels and technical analysis presented here are for educational illustration only. Small and mid-cap stocks can be highly volatile and can result in significant capital loss. Please conduct your own research and consult a SEBI-registered advisor before making any investment decisions. Past technical patterns do not guarantee future price performance.
FAQ
Q: What is the Fibonacci Golden Ratio zone in stock analysis? The Fibonacci Golden Ratio zone refers to the price range between the 50% and 61.8% retracement levels of a prior impulsive move. These levels are widely watched in technical analysis because pullbacks into this range frequently pause or produce reactions before the original trend resumes. In ICT and SMC methodology, this zone is called the Optimal Trade Entry (OTE) zone.
Q: What does it mean when a stock closes below the lower Bollinger Band? When a stock closes below the lower Bollinger Band (set at 2 standard deviations from the 20-day average), it indicates price has extended significantly beyond its typical range. Some traders read this as a short-term oversold condition — worth watching, particularly when it coincides with a Fibonacci reaction zone or a reversal candlestick pattern, but not a buy signal by itself.
Q: What is a Fair Value Gap and why does it matter for short term stocks? A Fair Value Gap is a price imbalance left behind when an impulsive move occurred too quickly for two-sided trading. In SMC/ICT analysis, price tends to return to fill these gaps before continuing in the original direction. When a stock sits inside an unfilled FVG at the same level as a Fibonacci reaction zone, the confluence of two independent frameworks at the same price creates a structurally significant level to watch.
Q: How is this analysis different from typical stock tips? This analysis maps specific price levels — Fibonacci zones, FVG zones, structural support levels — derived from each stock's own chart structure. It explicitly states that confluence signals define decision zones, not outcomes, and includes downside scenarios (what happens if the level breaks) alongside bullish scenarios. It does not tell you to buy these stocks. It tells you where the structurally interesting levels are and how to think about what might happen when price reaches them.
Q: What should I do if a stock breaks below the reaction zone? If price closes decisively below the reaction zone (the Fibonacci zone or FVG) on above-average volume, the structural support has failed. The next reference becomes the "Structural support below" level listed in each stock's table. A break of both levels would shift the daily structure from "pullback within uptrend" to a more bearish configuration. Always define in advance what break of the zone means for your specific trade plan before price gets there.
Related Articles
- Nifty 50 Prediction for Tomorrow — Daily index-level support, resistance, and market view, published every trading session
- Cup and Handle Pattern: How to Identify and Trade It — Hind Rectifiers and Sammaan Capital both show cup and handle structures
- Order Blocks: The Complete Mastery Guide — The institutional zones that often overlap with these Fibonacci and FVG reaction zones
- Fair Value Gaps: The Complete Mastery Guide — FVG confluence used in the Wheels India and Supriya Lifescience setups
- Support and Resistance: The Complete Trading Guide — The channel-trendline structure behind the Data Patterns and Bank of Maharashtra setups
- Best Risk Reward Ratio for Day Trading — How to calculate R:R when acting on any of these reaction zones
- How to Become a Disciplined Trader — The process framework for acting on technical setups with defined risk
- Best Online Trading Journal — Track every trade taken from these setups to measure your actual edge
Founder, Dhanith Trading
7+ years trading Nifty, Bank Nifty, NSE stocks, and commodities — specializing in Smart Money Concepts (SMC) and ICT price action. Founder of Dhanith — a trading journal, intraday screener, and risk tools platform built for retail traders.