On this page
- Introduction
- Part 1: What Is the Shooting Star Candlestick Pattern?
- The Formal Definition
- The OHLC Story — The Failed Attempt
- Why the Upper Wick Must Be at Least 2× the Body
- Part 2: Three Types of Shooting Star Patterns
- Type 1 — Red (Bearish Body) Shooting Star
- Type 2 — Green (Bullish Body) Shooting Star
- Type 3 — Gravestone Doji (The Ultimate Shooting Star)
- Part 3: The Data — Shooting Star Win Rate and Statistics
- Bulkowski's Research
- Volume's Impact on Reliability
- The Confluence Effect
- The Most Common Failure Mode
- Part 4: How to Identify a Valid Shooting Star — The Complete Checklist
- The 7-Point Checklist
- Part 5: Five Complete Shooting Star Trading Strategies
- Strategy 1 — Shooting Star at Resistance (The Foundation Strategy)
- Strategy 2 — Shooting Star + RSI Overbought (Momentum Exhaustion)
- Strategy 3 — Shooting Star + MACD (Trend and Momentum Alignment)
- Strategy 4 — Shooting Star in a Range (Range Resistance Entry)
- Strategy 5 — Shooting Star at Moving Average Resistance (Downtrend Pullback)
- Part 6: Stop Loss and Target — The Complete Rules
- Stop Loss Placement
- Target Setting Rules
- Part 7: Shooting Star vs. Related Patterns
- Shooting Star vs. Inverted Hammer
- Shooting Star vs. Hammer
- Shooting Star vs. Hanging Man
- The Four-Pattern Quick Reference
- Part 8: Shooting Star on Different Timeframes
- Daily Chart — Primary Application
- Weekly Chart — Highest Power
- 5-Minute and 15-Minute Chart — Intraday NSE Application
- Part 9: Common Shooting Star Mistakes and Exact Fixes
- Mistake 1 — Acting Without Confirmation
- Mistake 2 — Trading in Strong Uptrends Without Other Confirmation
- Mistake 3 — Ignoring Volume
- Mistake 4 — Stop Loss Below the Wick High
- Mistake 5 — Confusing Shooting Star with Inverted Hammer
- Mistake 6 — Not Checking the Pattern's Location
- FAQ
- Conclusion
- Ready to Trade the Shooting Star on Real Stocks?
Shooting Star Candlestick Pattern: Complete Trading Guide (2026)
Master the Shooting Star candlestick pattern in 2026. Learn exact identification rules, 5 proven strategies, RSI + MACD + resistance combinations, stop loss placement, targets, and key differences from the Inverted Hammer — with real NSE stock examples.
Introduction
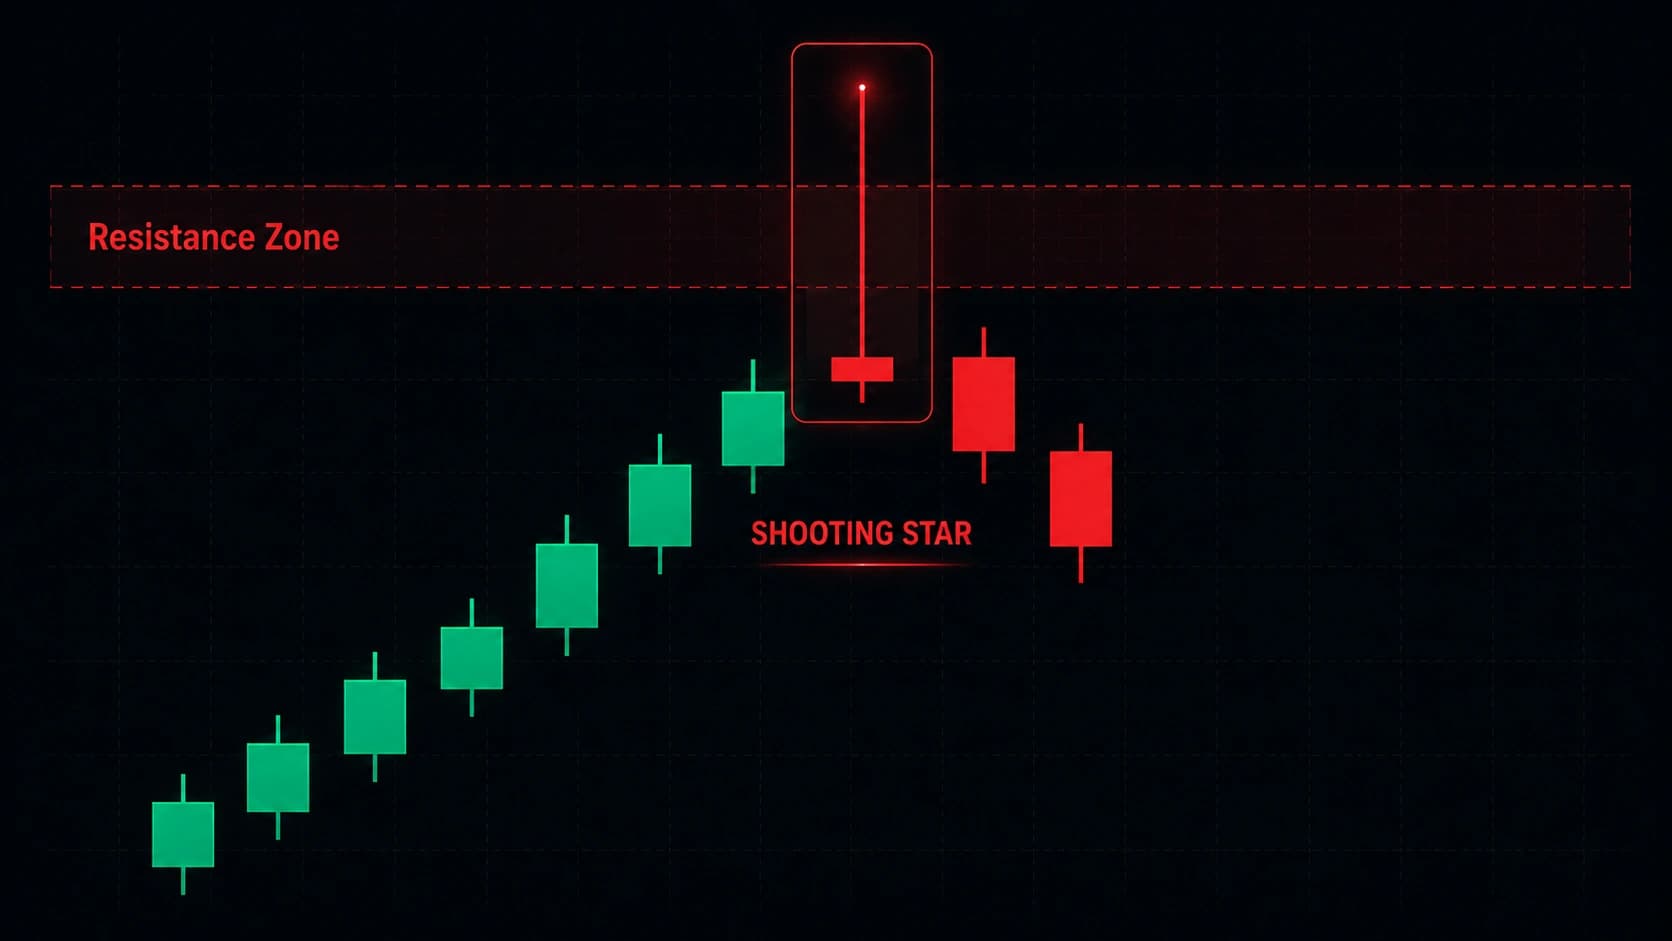
You are watching a stock rally. It has been climbing steadily for days. The uptrend looks healthy, the fundamentals are positive, and you are long the stock with a comfortable profit. Then in a single session, something unusual happens.
The session opens near yesterday's close — confirming momentum. Then buyers push it significantly higher, creating excitement that the rally is accelerating. But in the final hours of the session, sellers materialise out of nowhere and drive price all the way back down — closing the candle near where it opened, leaving a dramatic long upper wick as the only evidence of the intraday high.
The chart now shows a single candle that looks like a falling star — a tiny body at the bottom with a long streak of failed buying effort pointing upward. That is a Shooting Star.
And if you know what it means, it is one of the clearest warnings that the rally is about to end.
The Shooting Star is a single-candle bearish reversal pattern that forms after an uptrend when buyers push price higher but fail to hold the move, leaving a long upper wick and a weak close near the low. The long upper wick tells the story precisely: buyers had the power to push price significantly higher during the session — but sellers overwhelmed them before the close, driving price back to earth. The buyers' attempt to fly higher was shot down.
According to Thomas Bulkowski's comprehensive candlestick research, shooting star patterns have a success rate of more than 60%. However, this success rate dropped to 53% when traded randomly without the confirmation or context typically required in sound technical analysis.
This guide covers the complete Shooting Star framework — from precise identification rules to five complete trading strategies with exact entry, stop, and target rules — along with the all-important comparison with the Inverted Hammer, and every common mistake with exact fixes.
TL;DR — Key Takeaways
- A Shooting Star is a single-candle bearish reversal pattern with a small body at the bottom of the range, a long upper wick at least 2× the body, and minimal or no lower wick
- It appears after an uptrend and signals that buyers tried to push price higher but sellers overwhelmed them before the close
- According to Thomas Bulkowski's research, the pattern has 60%+ success rate with context and confirmation — dropping to 53% without them
- Historical data suggests that shooting stars with volume exceeding the 10-day average show approximately 15–20% higher reliability
- The Shooting Star and Inverted Hammer are visually identical — the prior trend determines which pattern is in play
- Five strategies: Shooting Star at Resistance, Shooting Star + RSI Overbought, Shooting Star + MACD, Shooting Star in a Range, Shooting Star at Moving Average Resistance
- Stop loss: above the Shooting Star's highest wick point — the absolute invalidation level
- Target: previous swing low below, minimum 2:1 risk-reward
Part 1: What Is the Shooting Star Candlestick Pattern?
The Formal Definition
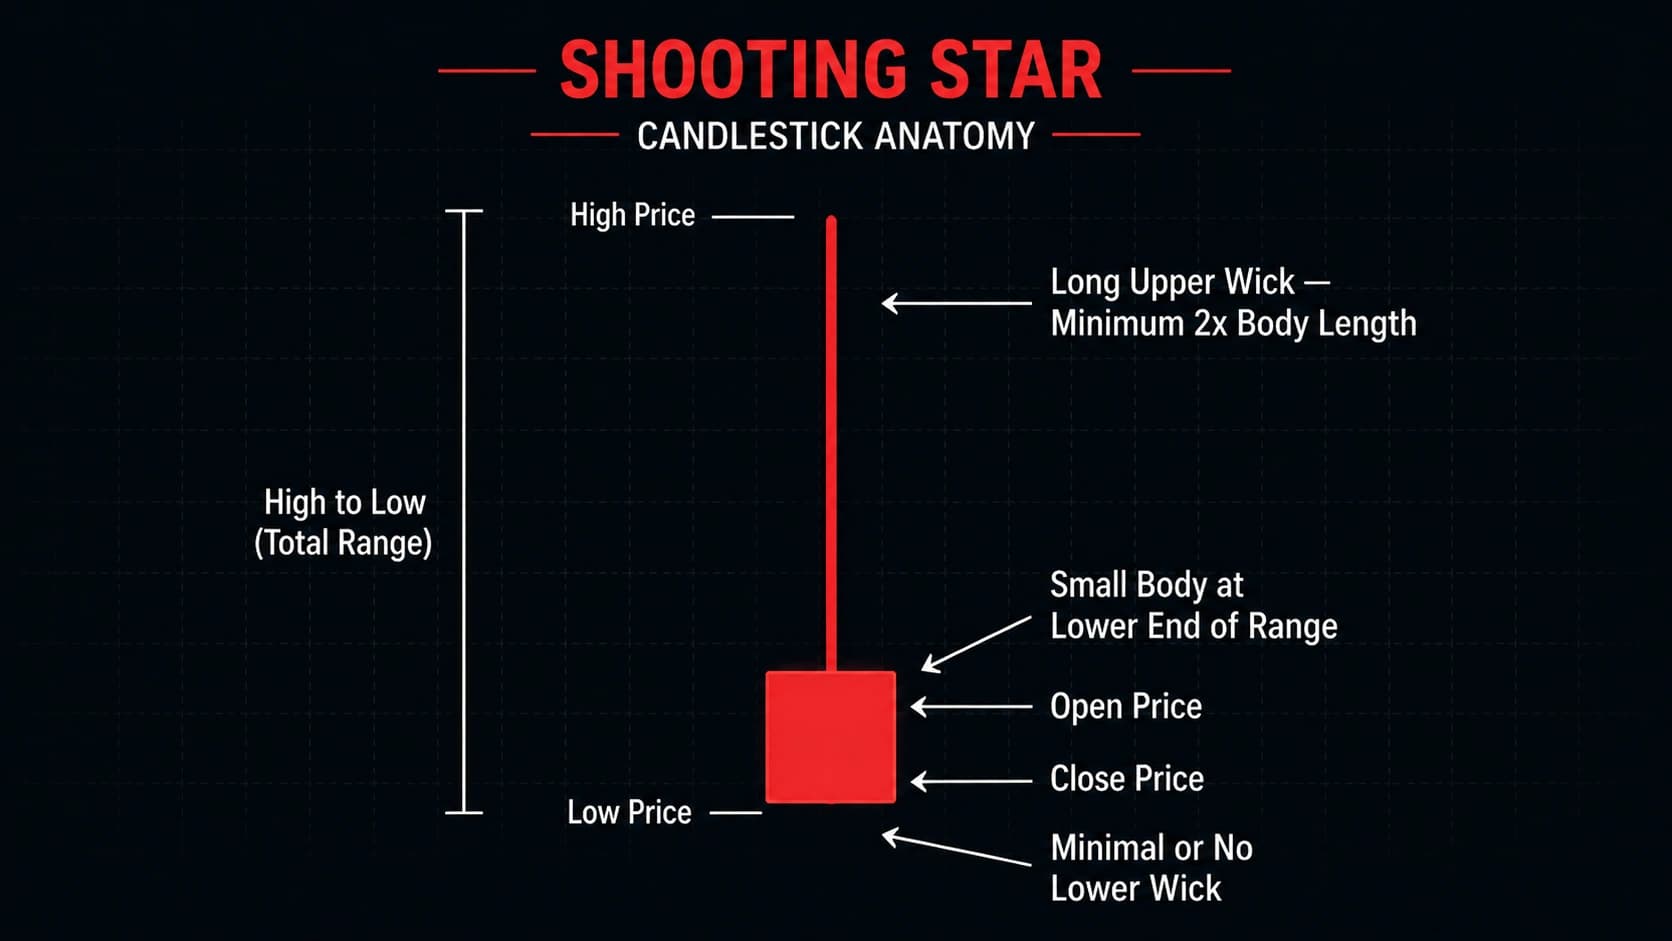
A shooting star is a single-candle formation signalling a possible bearish reversal after an upward price move. It has a small body near the bottom of its range, no or very little lower wick, and a long upper shadow that indicates buyers drove the market higher but were eventually overpowered by sellers.
The four structural requirements:
- Small body at the lower end of the candle's range — the Open and Close are near each other, occupying the bottom 30–40% of the total candle height (from Low to High)
- Long upper wick — at least 2× the body length — the shadow pointing upward representing the rejected buying surge
- Minimal or no lower wick — the close is already near the session's low; sellers dominated from the wick high all the way to the close
- Appears after a prior uptrend — this is the non-negotiable context requirement
The Shooting Star formation is created when the open, low, and close are roughly the same price. Also, there is a long upper shadow, generally defined as at least twice the length of the real body.
The OHLC Story — The Failed Attempt
Open: Price opens near yesterday's close or slightly higher — buyers appear in control
High: Buyers surge aggressively upward during the session, reaching a significantly higher price level — the long upper wick represents this intraday journey upward
Close: Sellers overwhelm buyers completely before the session ends — price falls all the way back to near the open, closing at the bottom of the candle's range
Low: The session's low is near the close — sellers pushed price not just back to the open but briefly below it in some cases
The message is unambiguous: buyers had a genuine opportunity to push this market higher. They had the momentum, they had the volume, and they drove price significantly above the opening level. But sellers stepped in with overwhelming force, completely negating the buying effort and closing the session near its low. The attempt to fly higher was shot down. The long upper wick is the evidence of the shooting trajectory. The close near the low is evidence of the crash landing.
Why the Upper Wick Must Be at Least 2× the Body
The 2× minimum is not arbitrary. It ensures that the intraday high represents a genuine and significant rejection — not just minor noise above the body.
A wick that is 1.2× the body shows some rejection. A wick that is 3× the body shows dramatic, overwhelming seller response to the buying surge. The greater the ratio, the more decisive the seller rejection of higher prices.
In practice: Aim for a wick of 2×–3× the body for minimum reliability. A 3× or greater wick with no lower shadow and a small body near the session low is the ideal Shooting Star.
Pro Tip: The most powerful Shooting Stars have upper wicks that reach — and briefly penetrate — a significant resistance level before sellers drive price back below it. The wick represents a liquidity sweep of the stop losses and breakout buy orders clustered above the resistance. When price spikes through resistance and closes below it in a single session, the failed breakout + Shooting Star combination is one of the highest-conviction bearish setups available.
Part 2: Three Types of Shooting Star Patterns
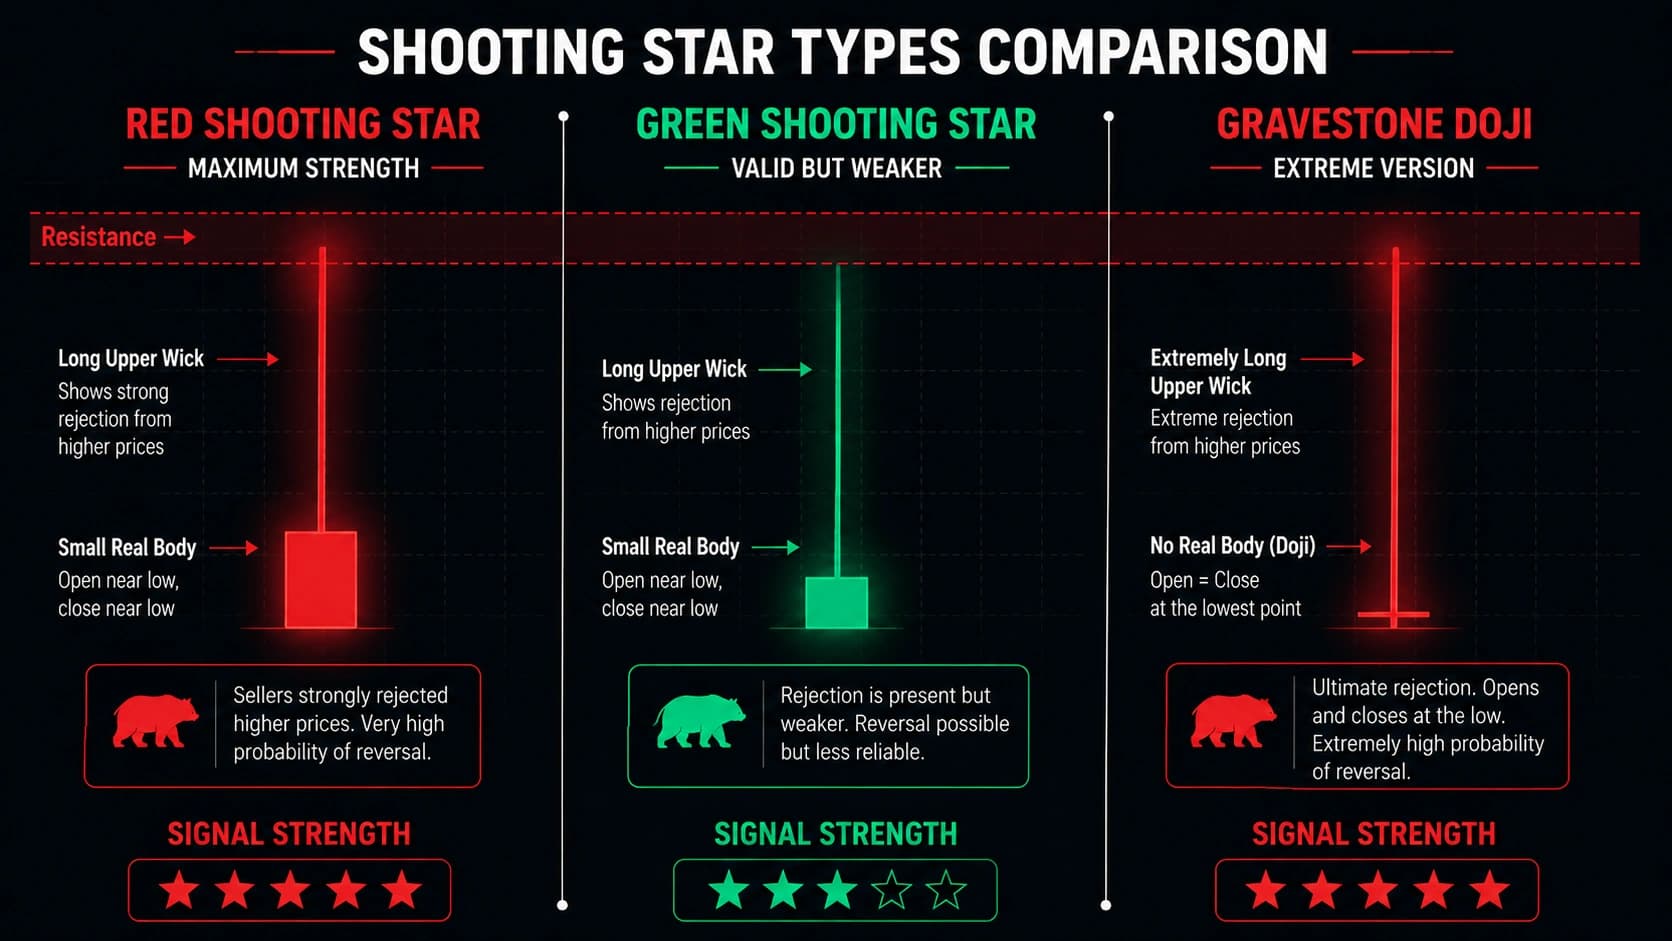
Type 1 — Red (Bearish Body) Shooting Star
The most common and most straightforward version. The candle's body is red/bearish — the close is below the open. Combined with the long upper wick, this version makes the bearish narrative completely unambiguous:
- Buyers pushed significantly above the open (creating the wick)
- Sellers not only reversed the gain but pushed below the open as well (creating the bearish body)
- The session was a comprehensive buyer failure
Signal strength: Maximum — both the body direction (bearish) and the wick (seller rejection of highs) confirm the same bearish message.
Type 2 — Green (Bullish Body) Shooting Star
The candle's body is green/bullish — the close is above the open — but the long upper wick still dominates the visual. The close is higher than the open but both are near the session's low, far below the intraday high.
This version is slightly weaker than the Red Shooting Star because the close above the open shows buyers retained a marginal edge at the session end. However, the long upper wick still demonstrates strong selling rejection of higher prices — and in the context of a prior uptrend at resistance, the Green Shooting Star is a valid bearish reversal signal.
Signal strength: Moderate-High — valid pattern but requires stronger confirmation than the Red version.
Type 3 — Gravestone Doji (The Ultimate Shooting Star)
When the Shooting Star's Open and Close are at precisely the same price — the body becomes zero, creating a cross or plus-sign at the bottom of the range with a long upper wick — the pattern becomes a Gravestone Doji.
The Gravestone Doji is the extreme version of the Shooting Star signal: buyers drove price significantly higher during the session, but sellers drove it all the way back to the opening price exactly. Not just close to the open — exactly at it. The perfect recovery of the entire intraday move by sellers is the most decisive rejection possible.
At market tops, at resistance levels, after extended rallies, a Gravestone Doji is a maximum-strength bearish reversal signal. It is rarer than a standard Shooting Star but produces sharper and more sustained reversals.
Signal strength: Maximum — the extreme version; treat it as a high-priority bearish signal.
Part 3: The Data — Shooting Star Win Rate and Statistics
Bulkowski's Research
According to Thomas Bulkowski's comprehensive candlestick research, which is highly regarded in the field of Technical Analysis, shooting star patterns have a success rate of more than 60%. However, this success rate dropped to 53% when traded randomly without the confirmation or context typically required in sound Technical Analysis.
The 60% vs. 53% gap is telling: the 7-percentage-point improvement from adding proper context (prior uptrend, resistance level, confirmation) is the difference between a barely-above-random pattern and a genuinely edge-providing signal.
Volume's Impact on Reliability
Historical data suggests that shooting stars with volume exceeding the 10-day average show approximately 15–20% higher reliability. Conversely, a shooting star forming on low volume suggests limited conviction and increases the likelihood of a false signal.
A 15–20% reliability improvement from a single filter (above-average volume) is substantial. This data point alone justifies making volume confirmation a mandatory check before every Shooting Star trade.
The Confluence Effect
| Shooting Star Configuration | Win Rate (Approximate) |
|---|---|
| Standalone (no context filters) | 53–55% |
| After confirmed uptrend (5+ bullish sessions) | 57–60% |
| At recognised resistance level | 62–65% |
| With above-average volume | 65–70% |
| With RSI above 70 (overbought) | 66–70% |
| All filters: uptrend + resistance + volume + RSI overbought | 68–73% |
The Most Common Failure Mode
The Shooting Star most commonly fails when it appears within a strong institutional uptrend where selling volume is insufficient to sustain a reversal. In these environments, the long upper wick represents a brief intraday pause — not a genuine institutional reversal. The next session's buying resumes the uptrend as if the Shooting Star never appeared.
The lesson: in a strongly uptrending market (above 200 SMA, making new all-time highs, strong FII buying data), Shooting Star patterns produce far more false signals than the same pattern in an extended, mature uptrend showing signs of buying exhaustion. Context about the maturity and health of the uptrend is as important as the pattern itself.
Part 4: How to Identify a Valid Shooting Star — The Complete Checklist
The 7-Point Checklist
Check 1 — Prior Uptrend: Price must have been rising for at least 3–5 sessions before the Shooting Star forms. The more established the prior uptrend (7–10+ sessions), the more meaningful the reversal signal. A Shooting Star after only one or two green candles is not a reversal signal — there is nothing to reverse.
Check 2 — Small Body in the Lower Portion of the Range: The body (Open to Close) must occupy the lower 30–40% of the candle's total range (from Low to High). The body should be visibly small — not a medium-sized body with a slightly longer wick.
Check 3 — Upper Wick at Least 2× the Body Length: Measure the upper wick (from body top to candle High) and the body (from Open to Close). The wick must be at least twice the body. A ratio of 2.5× to 4× indicates a high-quality Shooting Star.
Check 4 — Minimal or No Lower Wick: The lower shadow should be either absent or very short — no longer than the body length. A significant lower wick weakens the pattern because it shows buyers fought back near the close, reducing the completeness of the seller victory.
Check 5 — Volume Confirmation: The Shooting Star's volume should be above the 10–20 period average. This confirms that the session had genuine institutional participation — both buyers pushing the intraday high and sellers driving price back to the close. Low-volume Shooting Stars produce significantly more false signals.
Check 6 — Key Level Proximity: The Shooting Star forms at or near a significant resistance level: prior swing high, round number, Fibonacci resistance, moving average resistance, or an SMC order block/FVG in premium territory. The structural level provides the reason for sellers to appear; the Shooting Star provides the timing evidence that they did.
Check 7 — Confirmation Candle: The candle following the Shooting Star should close below the Shooting Star's body (or below its low). To confirm the shooting star, wait for the next candlestick to close below the pattern's low. This subsequent price action validates that sellers have gained control.
Minimum for a tradeable setup: Checks 1, 3, and 7 are mandatory. With all seven, the setup is Grade A.
Part 5: Five Complete Shooting Star Trading Strategies
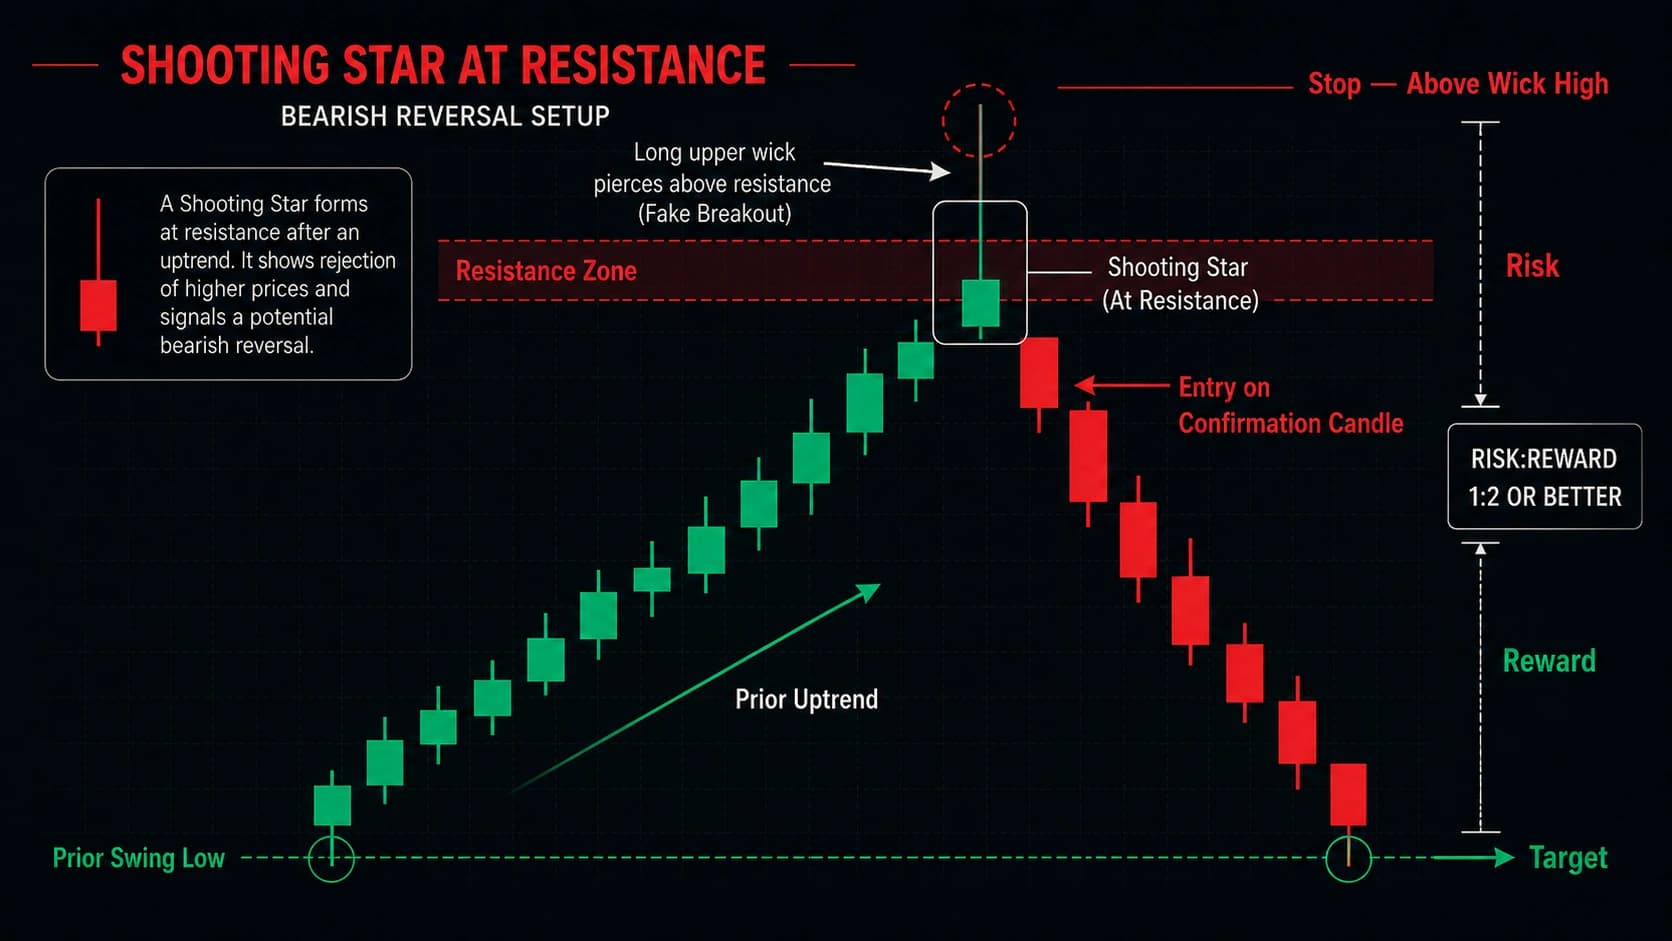
Strategy 1 — Shooting Star at Resistance (The Foundation Strategy)
The most reliable and most widely traded Shooting Star strategy. A shooting star at resistance is far more reliable than a shooting star in the middle of a range — the resistance level provides the structural reason for a reversal, and the Shooting Star provides the timing evidence.
Setup conditions:
- Identify a significant resistance level (prior swing high, round number, horizontal resistance zone)
- Price rallies toward this resistance over 5+ sessions
- A Shooting Star forms with its upper wick reaching into or above the resistance zone
- The wick briefly penetrates resistance (liquidity sweep of breakout buy orders above the level) before closing below it
- Volume on the Shooting Star is above average
Why the wick through resistance is powerful: When the upper wick breaks above resistance, it triggers two groups of orders: the buy stop orders of breakout traders (who entered long expecting a genuine breakout) and the stop loss orders of short sellers (who were short and placed stops above the resistance). With both groups' orders triggered — providing selling pressure from stop-hunt exits and buying pressure from breakout entries — the reversal back below resistance, closing with a Shooting Star body, means sellers overwhelmed even this surge of trapped buyers. The failed breakout is the decisive seller victory.
Entry:
- Aggressive: At the close of the Shooting Star candle
- Conservative: Enter when the confirmation candle breaks below the Shooting Star's low (body low or full candle low)
Stop Loss: Above the Shooting Star's highest wick point — the intraday high — with a 0.2–0.3% buffer. The reversal setup is confirmed when price breaks below the shooting star low, with the stop loss placed above the wick high because a move back above that level would invalidate the bearish reversal.
Target:
- Take Profit 1: Previous swing low (the level from which the current rally began)
- Take Profit 2: The next significant support below
Minimum risk-reward: 2:1. If the stop distance (entry to wick high) is ₹20, the target must be at least ₹40 below entry.
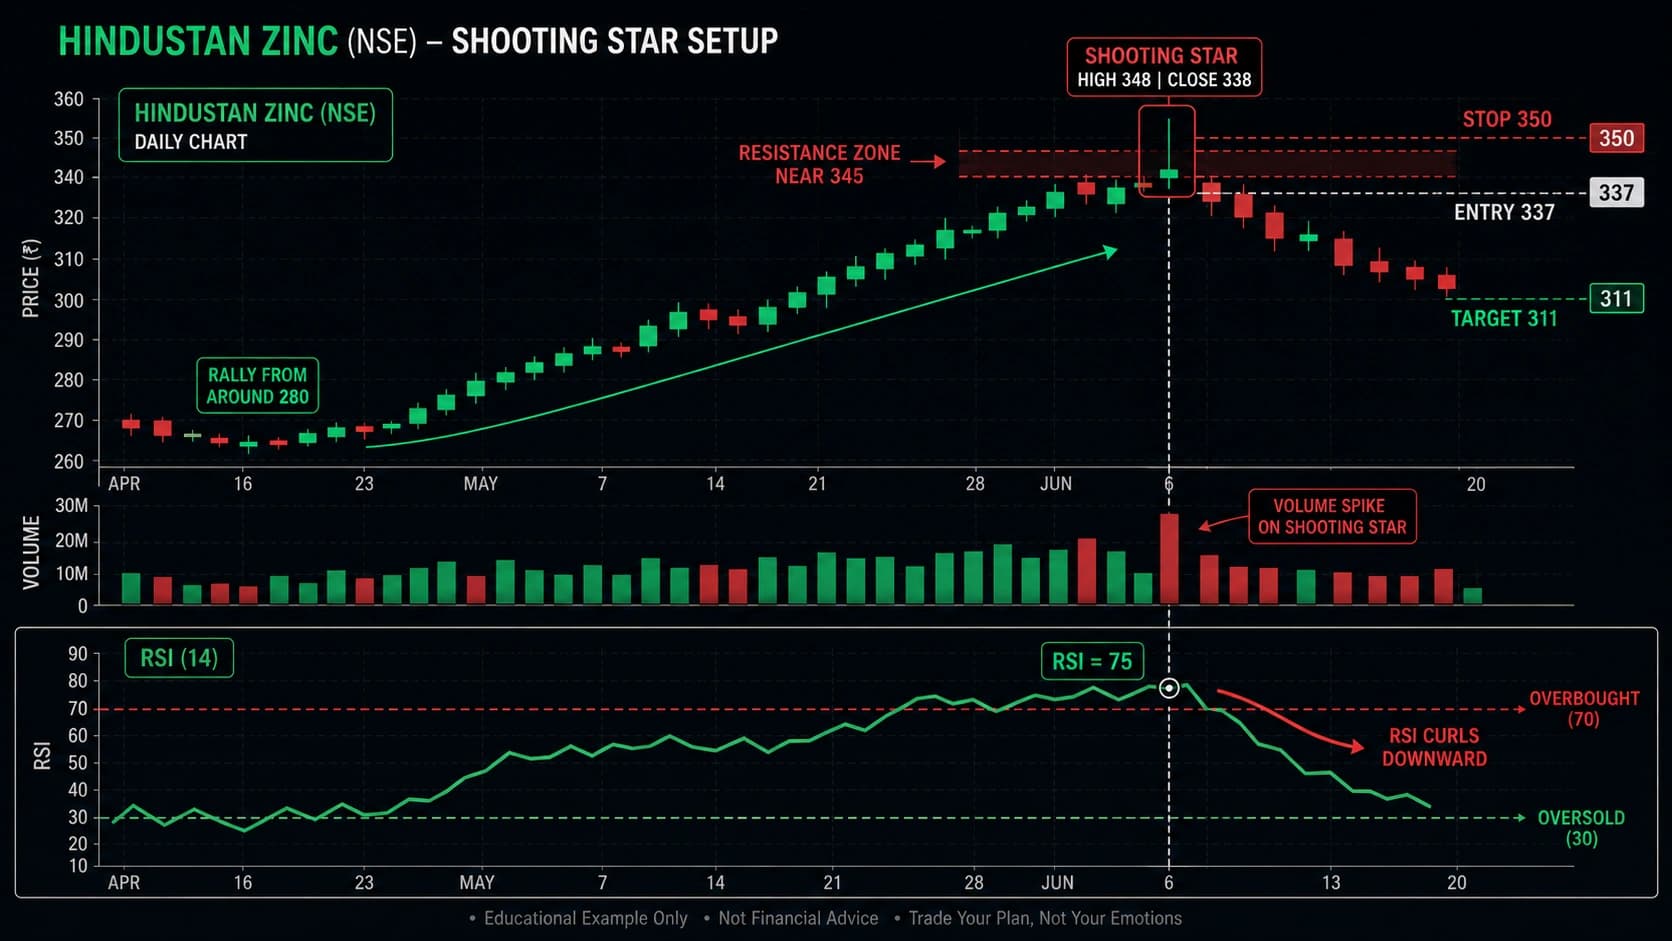
Real NSE example (Hindustan Zinc): Hindustan Zinc rallied from ₹280 to ₹340 over 12 sessions. RSI reached 75 (overbought). A Shooting Star formed with the wick pushing to ₹348 (above prior resistance at ₹345) before closing at ₹338. Volume was 1.8× the 20-day average.
- Entry: ₹337 (Shooting Star close — aggressive entry)
- Stop: ₹350 (above wick high with buffer)
- Risk: ₹13 per share
- Target: ₹311 (prior swing low — ₹26 below entry)
- Risk-Reward: 2:1
Pro Tip: A Shooting Star whose upper wick briefly penetrates a resistance level before closing back below it is the most powerful version of this setup. The spike above resistance sweeps the breakout buy orders and the stop losses of trapped shorts — and the subsequent Shooting Star close below resistance means sellers overwhelmed all of that additional buying pressure. The failed breakout adds fuel to the decline that follows.
Strategy 2 — Shooting Star + RSI Overbought (Momentum Exhaustion)
Adding RSI to the Shooting Star setup provides an independent momentum confirmation that the buying pressure has reached a statistically extreme level — making a reversal more probable regardless of the candle pattern.
Price pushes into resistance on a weak move, RSI prints above 70, and price closes back below resistance with a strong red candle. Often that closing candle is itself a bearish reversal pattern like a bearish engulfing or a shooting star. Now you have three pieces of evidence lining up: price is at range resistance, RSI is overbought, and the closing candle confirms rejection. That stack is what you want before entering a short.
Two RSI configurations:
Configuration A — RSI Overbought (Above 70): When the RSI is above 70 at the time the Shooting Star forms, selling pressure at a statistically extreme level compounds the pattern's bearish signal. Two independent measurements — price structure (Shooting Star) and momentum (RSI > 70) — both point to the same conclusion.
Configuration B — RSI Bearish Divergence: Price makes a higher high in the current session (Shooting Star's intraday high creates a new price extreme). But RSI makes a lower high than the previous swing's RSI peak. The divergence shows that buying momentum has been weakening even as price reached a new extreme. The Shooting Star is the visual confirmation — buyers reached a higher price but with less conviction, and sellers immediately reversed the move.
Entry rules:
- Aggressive: At the close of the Shooting Star when both RSI overbought and pattern are confirmed
- Conservative: Wait for confirmation candle close below Shooting Star's body
Stop: Above Shooting Star's wick high
Target: Use RSI returning to 50 as a momentum reference. The price target remains the previous swing low.
Post-entry management: Once in the trade, if RSI crosses below 50, bearish momentum has shifted. Consider trailing the stop behind each new lower high to capture extended moves when the pattern is followed by a sustained downtrend.
Strategy 3 — Shooting Star + MACD (Trend and Momentum Alignment)
MACD adds trend-momentum context — confirming whether the Shooting Star marks a genuine trend reversal or merely a brief pause within a continuing uptrend.
Three MACD configurations:
MACD Bearish Crossover: When the MACD line crosses below the signal line on or around the same session as the Shooting Star, two independent momentum tools simultaneously signal bearish pressure. This convergence makes the short trade significantly more reliable.
MACD Histogram Shrinking: If MACD histogram bars have been decreasing in size for 3–5 sessions before the Shooting Star forms, bullish momentum has been progressively weakening. The Shooting Star caps this declining momentum pattern. The histogram was warning of the reversal; the Shooting Star confirms it visually.
MACD Bearish Divergence: Price makes a higher high. MACD makes a lower high. The divergence warns that the uptrend is losing institutional backing. The Shooting Star at the divergence point is the price action confirmation that sellers are stepping in precisely where MACD signalled weakness.
Entry and Stop: Identical to Strategy 1 — close of Shooting Star, stop above wick high
Target: Previous swing low. If MACD has crossed below zero, the bearish trend may be more sustained — consider trailing the stop for the full downtrend move.
Pro Tip: For NSE swing traders, check the weekly MACD before acting on a daily Shooting Star. If the weekly MACD is crossing bearish (MACD line below signal line on the weekly chart) AND a daily Shooting Star appears at resistance, you have weekly momentum confirming the daily pattern. This top-down MACD alignment is one of the strongest multi-timeframe confirmation setups available to Indian equity traders.
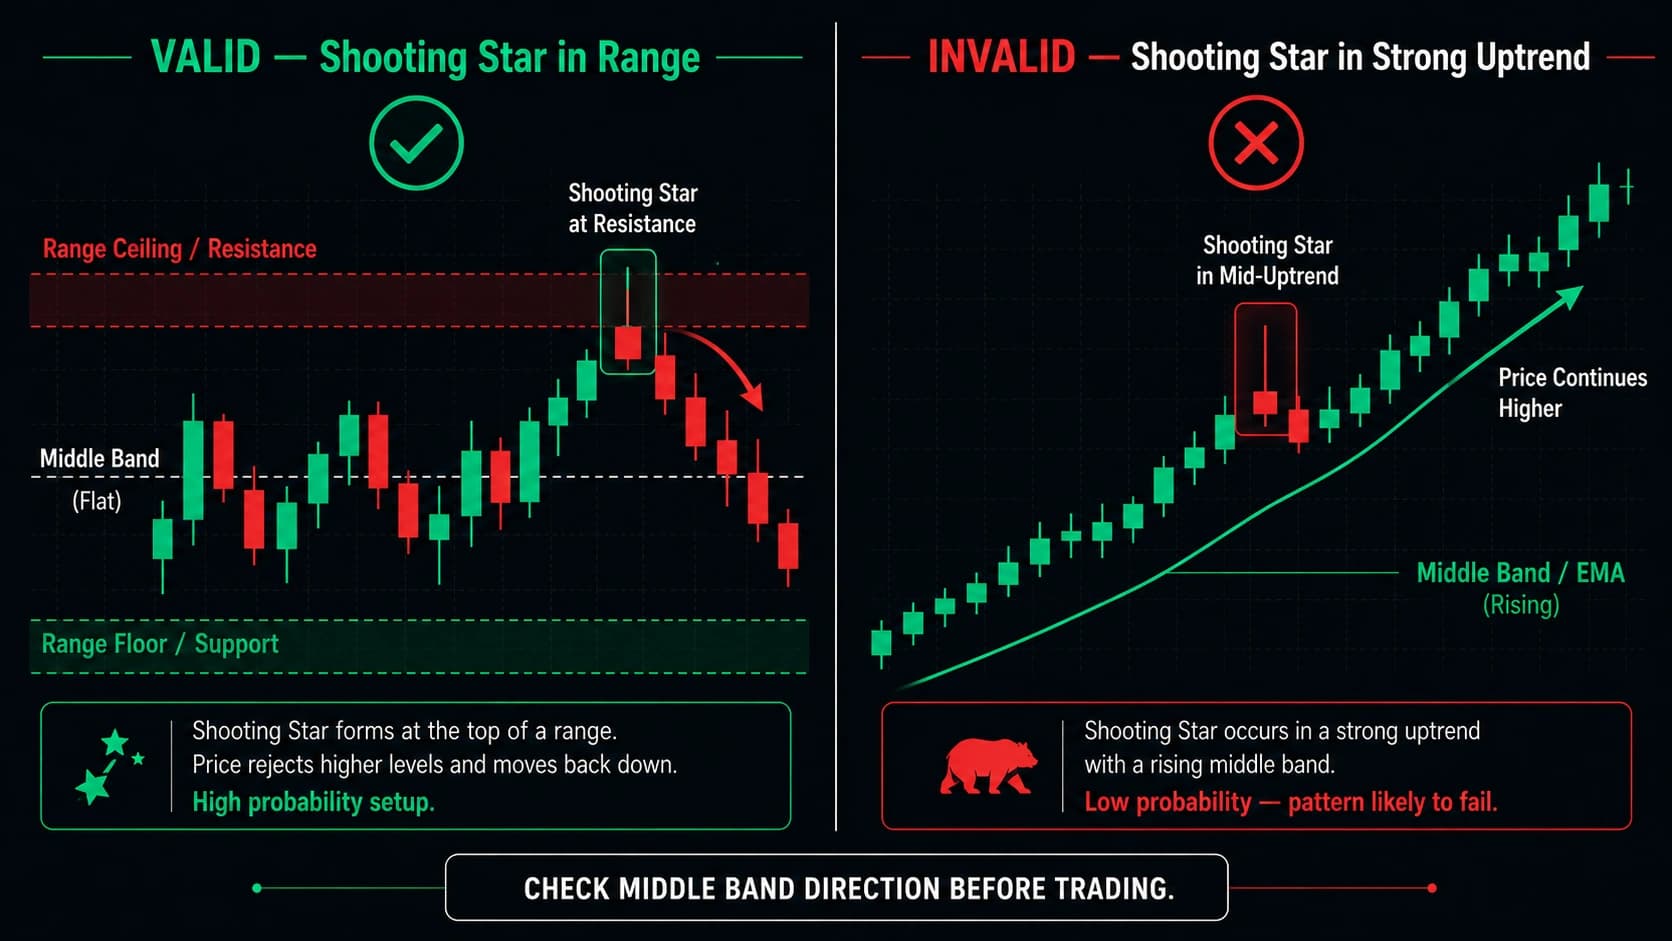
Strategy 4 — Shooting Star in a Range (Range Resistance Entry)
Markets spend a large portion of their time moving sideways rather than trending. Many analysts estimate that financial markets trend only about 25–30% of the time, while the remaining time they move in range-bound conditions. In a defined horizontal range, the Shooting Star at the range's resistance ceiling is a high-probability short setup for capturing the next decline to range support.
Setup conditions:
- Identify a clear horizontal range: two or more rejections from the same resistance ceiling AND two or more bounces from the same support floor
- Price rallies from the range floor toward the resistance ceiling
- A Shooting Star forms at or near the resistance ceiling
- Volume is above average on the Shooting Star
Why range-trading Shooting Stars are reliable: In a range, the market has "voted" on fair value multiple times — the resistance ceiling is where sellers consistently overwhelm buyers, and the support floor is where buyers consistently overwhelm sellers. A Shooting Star at the resistance ceiling is not predicting a new behaviour — it is confirming the continuation of already-established behaviour. This makes the probability higher than a Shooting Star at a first-touch resistance level.
Entry:
- Conservative: Enter when price breaks below the Shooting Star's low (body low), confirming the rejection of the ceiling
- Can also enter on the close of the Shooting Star in a clearly established range with multiple prior rejections at the same level
Stop: Above the Shooting Star's wick high (and above the range resistance ceiling)
Target: The range support floor below. This provides the cleanest risk-reward for range-trading Shooting Stars because the target is predefined and has been tested multiple times.
Risk-reward calculation: The range width determines risk-reward. If the range is 100 points wide (from ₹300 support to ₹400 resistance) and your stop is 15 points above the resistance (₹415), the target at ₹300 provides a 6.7:1 risk-reward on an aggressive entry at ₹400. Even on a conservative entry at ₹390 with a stop at ₹415, the target at ₹300 provides 3.6:1 — well above the 2:1 minimum.
Strategy 5 — Shooting Star at Moving Average Resistance (Downtrend Pullback)
In established downtrends, price frequently rallies back to a moving average before sellers reassert control. A Shooting Star at these key moving average resistance levels provides a trend-aligned short entry — the highest-probability configuration for the pattern.
The moving average context:
20 EMA as resistance (Strong downtrend): In a steep downtrend, price often rallies only as far as the 20 EMA before sellers take over again. A Shooting Star at the 20 EMA during a downtrend pullback is a clean, high-probability short entry: the moving average provides the structural resistance, and the Shooting Star confirms sellers are defending it.
50 SMA as resistance (Moderate downtrend): In a moderate downtrend where price occasionally makes deeper pullbacks, the 50 SMA provides intermediate resistance. A Shooting Star here signals the pullback is complete and the downtrend is resuming.
200 SMA as resistance (Major bear market rally): The most powerful moving average setup. When a stock has broken decisively below the 200 SMA (entering a bear market structure) and then stages a sharp counter-trend rally back toward the 200 SMA, a Shooting Star at the 200 SMA is a high-conviction short — the most important long-term moving average has held as resistance. These setups are rare but produce the largest downward moves.
Setup conditions:
- Stock in a downtrend (lower highs and lower lows on the daily chart)
- Price stages a corrective rally (counter-trend bounce) toward the 20 EMA, 50 SMA, or 200 SMA
- A Shooting Star forms at the moving average
- Volume above average on the Shooting Star
- RSI has risen to 50–60 during the pullback (not overbought — confirming this is a correction within a downtrend, not a reversal)
Entry: At the close of the Shooting Star
Stop: Above the Shooting Star's wick high AND above the moving average. If price closes above the moving average, the short thesis is invalidated.
Target: The most recent swing low below — and for strongly trending downtrends, consider trailing the stop behind each new lower high for extended moves.
| Moving Average | Best Context | Signal Power | Frequency |
|---|---|---|---|
| 20 EMA | Steep short-term downtrend | High | Very frequent |
| 50 SMA | Moderate medium-term downtrend | Very High | Moderate |
| 200 SMA | Long-term bear trend rally | Maximum | Rare but powerful |
Part 6: Stop Loss and Target — The Complete Rules
Stop Loss Placement
The universal Shooting Star stop loss rule: Place your stop loss above the Shooting Star's highest wick point — the intraday High of the pattern — with a small buffer.
Most discretionary traders place a stop a few cents above the shooting star's upper wick and target a measured move of three times the candle's high-to-low range. That structure produces a 3:1 reward-to-risk profile on confirmed entries.
Why above the wick high specifically:
The Shooting Star's upper wick represents the maximum price buyers reached during the session before sellers overwhelmed them. The wick high is the exact level where sellers proved dominant. If price subsequently rises back above the wick high — above even the session's maximum buyer surge — sellers have been completely overwhelmed. The entire Shooting Star narrative has been invalidated. There is no valid reason to remain short.
Buffer sizing for NSE stocks:
- Large-cap NSE stocks (₹500+ price): 0.2–0.3% above the wick high
- Mid-cap stocks: 0.3–0.5% buffer
- Intraday 5-minute chart: 0.3–0.5% of stock price above the wick high
Never place the stop:
- At the Shooting Star's body (too tight — normal upward retracement triggers it)
- At a round number below the wick high (psychologically comfortable but technically incorrect)
- Based on "a comfortable loss amount" rather than the pattern's invalidation logic
Target Setting Rules
Primary target (Take Profit 1): The previous swing low — the level from which the current rally that produced the Shooting Star began. This is the first significant support where buyers are likely to step in.
Secondary target (Take Profit 2): Beyond the primary swing low, the next significant support or the origin of the entire rally. For stocks in established downtrends, the secondary target may be a significant lower support zone.
The 3:1 measured move approach: Most discretionary traders target a measured move of three times the candle's high-to-low range. Calculate the Shooting Star's total range (from Low to High of the candle). Multiply by 3. The target is that distance below the Shooting Star's close. This approach provides a mechanical target level regardless of where the next support sits.
Scale-out approach:
- At 1:1 (risk covered): Close 25–30% of position, move stop to breakeven
- At 2:1 (primary target): Close another 40–50%
- Let remaining 20–25% run with trailing stop above each new lower high
Before entering any Shooting Star short trade, calculate your exact position size. Use the Dhanith Risk Management Calculator — enter your stop distance and account size to get your exact share count and maximum loss instantly.
Part 7: Shooting Star vs. Related Patterns
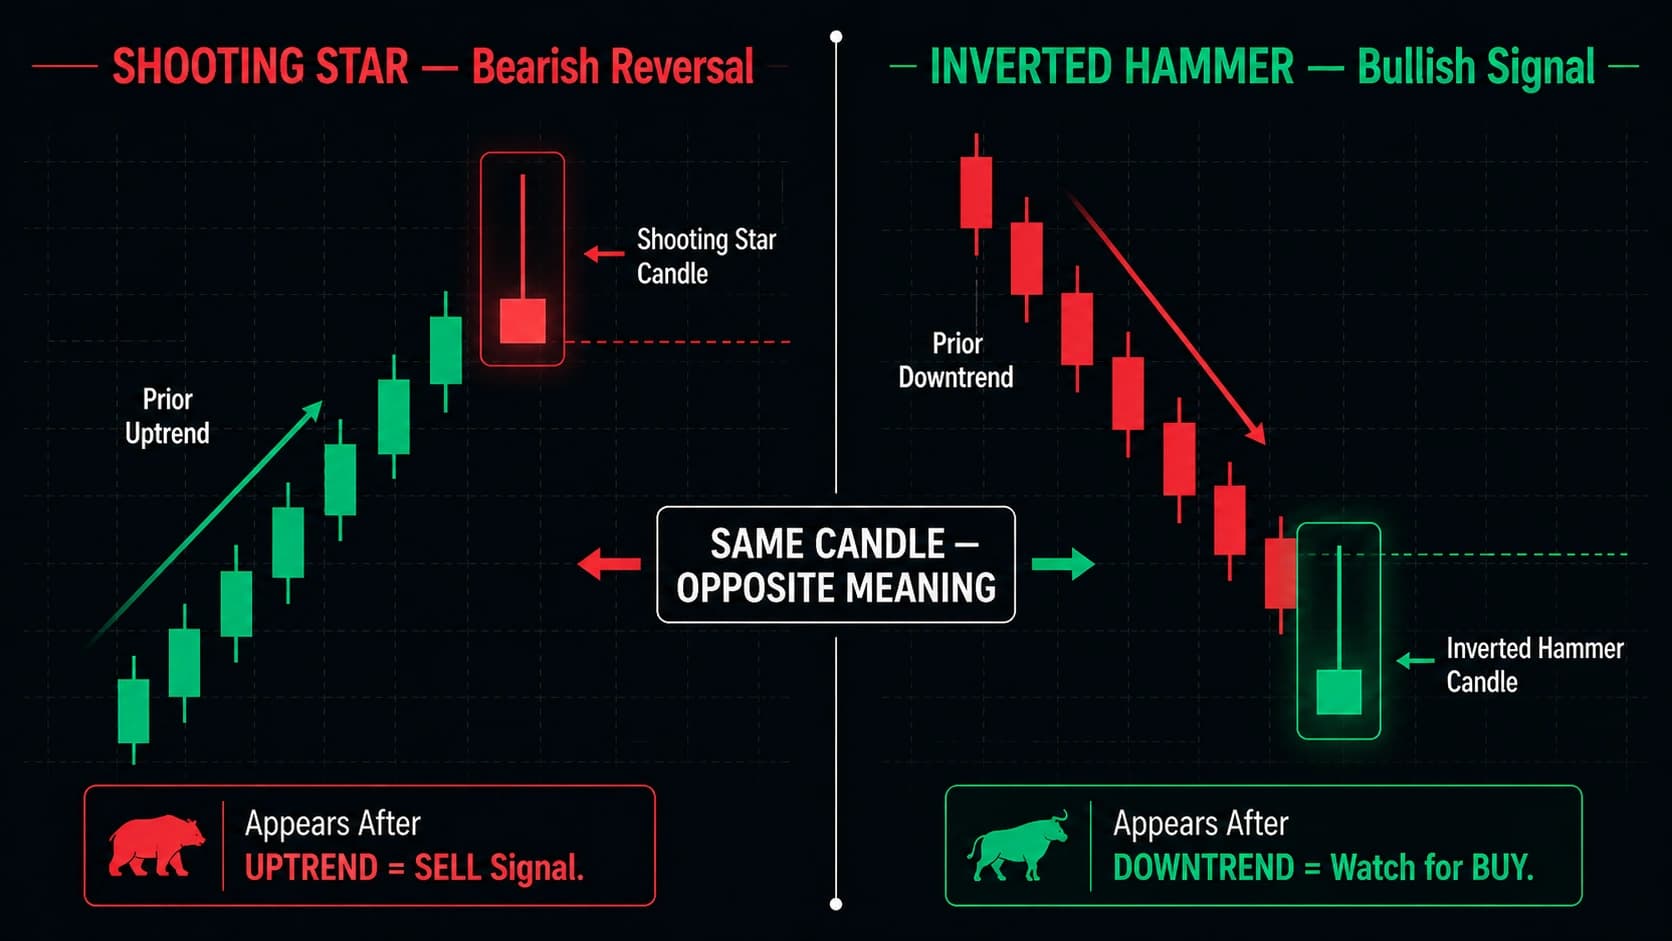
Shooting Star vs. Inverted Hammer
A shooting star and an inverted hammer share a similar shape, but context differs. A shooting star appears after an uptrend and suggests potential weakness. An inverted hammer appears after a downtrend and suggests potential stabilization.
This is the most commonly confused comparison in single-candle pattern analysis. The visual structure is identical — both have a small body at the lower end of the range, a long upper wick, and minimal lower wick. Only the prior trend context determines which pattern is in play.
| Feature | Shooting Star | Inverted Hammer |
|---|---|---|
| Visual appearance | Identical | Identical |
| Prior trend | Uptrend | Downtrend |
| Signal | Bearish reversal | Bullish warning |
| Body colour | Red or green | Red or green |
| Long wick | Upper | Upper |
| Body position | Lower end of range | Lower end of range |
| Strength | Moderate-High | Weak (needs strong confirmation) |
| Confirmation | Next candle closes below body | Next candle closes above wick high |
The one-line rule: If the long wick points up AND there was an uptrend before it — Shooting Star (bearish). If the long wick points up AND there was a downtrend before it — Inverted Hammer (bullish warning). Same candle. Opposite meanings. Context wins every time.
Shooting Star vs. Hammer
| Feature | Shooting Star | Hammer |
|---|---|---|
| Prior trend | Uptrend | Downtrend |
| Long wick | Upper wick | Lower wick |
| Small body position | Lower end of range | Upper end of range |
| Signal | Bearish reversal | Bullish reversal |
| Psychology | Buyers failed at the highs | Sellers failed at the lows |
The Hammer and Shooting Star are perfect opposites — both single-candle reversal signals, both with long wicks and small bodies, both requiring prior trends, but with the wick direction and trend direction reversed. A Hammer is the bullish version at market bottoms; the Shooting Star is the bearish version at market tops.
Shooting Star vs. Hanging Man
Both are bearish reversal patterns appearing after uptrends. The difference is the wick direction:
| Feature | Shooting Star | Hanging Man |
|---|---|---|
| Long wick direction | Upper | Lower |
| Body position | Lower end of range | Upper end of range |
| Intraday narrative | Buyers surged, sellers rejected | Sellers pushed down, buyers recovered |
| Visual | Small body low, wick pointing up | Small body high, wick pointing down |
Both signal bearish reversals after uptrends, but through opposite intraday narratives. The Shooting Star shows failed buying surge. The Hanging Man shows warning seller strength despite buyer recovery.
The Four-Pattern Quick Reference
| Pattern | Trend | Long Wick | Signal |
|---|---|---|---|
| Hammer | Downtrend | Lower | Bullish reversal |
| Inverted Hammer | Downtrend | Upper | Weak bullish warning |
| Shooting Star | Uptrend | Upper | Bearish reversal |
| Hanging Man | Uptrend | Lower | Bearish warning |
Part 8: Shooting Star on Different Timeframes
Daily Chart — Primary Application
A hammer candlestick pattern can appear on any timeframe, but it is generally more reliable when it appears at a significant support level on higher timeframes like a daily chart or weekly chart. Multi-timeframe analysis can improve the effectiveness of patterns by confirming overarching trends. The same principle applies directly to the Shooting Star — the daily chart is where the pattern carries the most consistent institutional weight.
For NSE swing traders, a daily Shooting Star at a key resistance level with RSI above 65 and above-average volume is a primary signal to exit long positions or initiate short trades. The trade typically plays out over 3–10 sessions.
Weekly Chart — Highest Power
A weekly Shooting Star represents five full trading days of the same narrative: buyers drove price to intra-week highs, but sellers drove it back to the low by the weekly close. When the entire week's worth of buying effort ends in a long upper wick and a close near the week's low, the bearish signal carries multi-session institutional weight.
Weekly Shooting Stars at prior resistance zones or all-time highs often mark the beginning of multi-week corrections or major trend reversals. These are rare (appearing perhaps 4–8 times per year on a given stock) but carry maximum significance.
5-Minute and 15-Minute Chart — Intraday NSE Application
For Indian intraday traders, the Shooting Star on the 5-minute chart provides bearish short entry signals — particularly during two key windows:
9:30–11:00 AM (Post-AMD manipulation): After the morning Judas Swing completes on a bearish session day, a Shooting Star at VWAP resistance provides the short entry for the AMD distribution phase. Price rallies from below VWAP back to VWAP, forms a Shooting Star at the VWAP level (wick pushing above VWAP, body closing below), and then resumes the bearish daily AMD move.
2:30–3:15 PM (Closing session resistance): In the afternoon session, a Shooting Star at the day's established intraday resistance or at VWAP provides a short entry for closing-hour positioning.
Intraday specifics: Require volume at least 1.5× the 5-minute session average. Apply RSI above 60 on the 5-minute chart as confirmation. Only trade within the relevant killzones (9:30–11:00 AM and 2:30–3:15 PM).
The Dhanith Intraday Screener identifies the high-momentum NSE stocks where VWAP Shooting Star setups form with the highest clarity and follow-through. Pre-filtered candidates mean you spend your time watching the setup — not scanning 2,000 stocks.
Part 9: Common Shooting Star Mistakes and Exact Fixes
Mistake 1 — Acting Without Confirmation
Entering short the moment the Shooting Star candle closes without waiting for the confirmation candle to close below the pattern's low. The next session opens higher and immediately continues upward, stopping out the short position.
The fix: Wait for the next candlestick to close below the pattern's low. This subsequent price action validates that sellers have gained control. Additional confirmation comes from high trading volume during the pattern's formation, overbought technical indicators like RSI above 70, or bearish MACD crossovers. Never enter positions based solely on the pattern's appearance.
Mistake 2 — Trading in Strong Uptrends Without Other Confirmation
Shorting every Shooting Star in a strongly trending bull market — in uptrends where every pullback candle including Shooting Stars is quickly erased by the next buying surge.
The fix: In a strong bull market (above 200 SMA, strong institutional buying, new highs regularly), apply extra filters before shorting a Shooting Star. Require RSI above 75 (extreme overbought), specific resistance zone proximity, and a prior decline in the MACD histogram. In the strongest uptrends, the Shooting Star is more reliable as an "exit longs here" signal than as an "enter short here" trigger.
Mistake 3 — Ignoring Volume
A visually perfect Shooting Star on below-average volume. The institutional selling conviction is absent.
The fix: Higher volume during or after a shooting star adds weight to the pattern. It suggests broader participation in selling pressure. Low volume reduces reliability. Make volume above the 10-day average a hard requirement. Below-average volume Shooting Stars produce significantly more false signals — skip them or treat them as B-grade setups requiring additional confirmation.
Mistake 4 — Stop Loss Below the Wick High
Stop placed at the top of the Shooting Star's body instead of above the wick high. Normal upward oscillation wicks above the body and triggers the stop before the anticipated decline begins.
The fix: Stop above the Shooting Star's full wick high — the actual intraday maximum — with a small buffer. The wick high is the session's maximum buyer push. Only a close above it (not a brief wick) constitutes invalidation of the bearish thesis.
Mistake 5 — Confusing Shooting Star with Inverted Hammer
Seeing a candle with a small body at the bottom and long upper wick after a downtrend and treating it as a Shooting Star (bearish). In reality, the same visual shape after a downtrend is an Inverted Hammer — a bullish warning signal.
The fix: Before identifying any pattern, identify the prior trend. Long upper wick after an uptrend = Shooting Star (bearish). Long upper wick after a downtrend = Inverted Hammer (bullish warning). The visual shape alone is insufficient — trend context is the determining factor.
Mistake 6 — Not Checking the Pattern's Location
Shorting a Shooting Star that forms in the middle of a price range — away from any resistance level, moving average, or significant structural zone. The pattern has no structural reason to hold; price drifts sideways or continues upward.
The fix: Before acting on any Shooting Star, check where it formed on the chart. Is it at or near a recognisable resistance level? A moving average? A Fibonacci retracement? A round number? If not — if the pattern appears mid-range without structural backing — skip it. Location is the primary filter that separates 60%+ win rate setups from the 53% baseline.
FAQ
Q: What is a Shooting Star candlestick pattern? A Shooting Star is a single-candle bearish reversal pattern with a small body at the lower end of the candle's range, a long upper wick at least twice the body length, and minimal or no lower wick. It appears after an uptrend and signals that buyers pushed price significantly higher during the session but sellers overwhelmed them before the close, driving price back to the bottom of the range. The long upper wick represents the failed buying surge. According to Thomas Bulkowski's research, the pattern achieves 60%+ success with proper context and confirmation.
Q: What is the difference between a Shooting Star and an Inverted Hammer? Both patterns are visually identical — small body at the lower end of the range, long upper wick, minimal lower wick. The sole difference is context: a Shooting Star appears after an uptrend and signals a bearish reversal. An Inverted Hammer appears after a downtrend and signals a potential bullish reversal. Same visual structure, completely opposite meanings. The prior trend is the only differentiator — check it before identifying either pattern.
Q: Is a green Shooting Star valid? Yes — a green (bullish body) Shooting Star is a valid bearish signal, though slightly weaker than a red Shooting Star. The green body shows the close was marginally above the open, meaning buyers retained a small edge at the session end. However, the long upper wick still demonstrates strong selling rejection of higher prices. Apply slightly stronger confirmation requirements for a green Shooting Star before entering.
Q: Where should I place my stop loss on a Shooting Star trade? Above the Shooting Star's highest wick point — the intraday High of the pattern — with a 0.2–0.3% buffer for large-cap NSE stocks. The wick high is the absolute invalidation level: if price rises back above it, the entire bearish narrative has been negated and the position must be exited. Never place the stop inside the pattern (at the body top or between body and wick high), as normal price oscillation will trigger it prematurely.
Q: How is a Shooting Star different from a Hammer? The Hammer is the Shooting Star's bullish mirror image. A Hammer has a long lower wick and appears after a downtrend — signalling buyers rejecting the lows and a potential upward reversal. A Shooting Star has a long upper wick and appears after an uptrend — signalling sellers rejecting the highs and a potential downward reversal. Both have small bodies and long single-direction wicks, but the wick direction and trend context are completely opposite.
Q: What confirmation is best for a Shooting Star? The most reliable confirmation is the next candle closing below the Shooting Star's body or low. Beyond that, the three best indicators to combine with the Shooting Star are: (1) RSI above 70 (overbought — confirms momentum is exhausted), (2) MACD histogram declining or bearish crossover (confirms trend momentum is weakening), and (3) above-average volume on the Shooting Star candle (confirms institutional participation in the selling rejection of higher prices).
Q: What is the best timeframe for trading the Shooting Star? Daily and weekly charts produce the most reliable Shooting Star signals due to full institutional participation. For NSE intraday traders, the 5-minute chart during the 9:30–11:00 AM session — particularly when the Shooting Star forms at VWAP resistance — provides actionable setups. Higher timeframes always produce more reliable signals because they represent more comprehensive buyer-seller battles with genuine institutional volume.
Conclusion
The Shooting Star is one of the simplest, most visually distinctive, and most psychologically transparent signals in all of technical analysis. The story it tells requires no interpretation: buyers tried to go higher — sellers said no — with such conviction that they drove price back to the bottom of the session's range.
When that story plays out at a significant resistance level, with RSI in overbought territory, and with above-average volume confirming institutional selling participation, the probability of a subsequent decline is meaningfully above random.
Three principles to carry into every Shooting Star trade:
1. Location determines 70% of the outcome. A Shooting Star at a recognised resistance level carries dramatically more weight than the same pattern in mid-range. The resistance provides the structural reason for sellers to appear; the Shooting Star provides the timing evidence that they did. Never trade a Shooting Star without first confirming its location relative to a key level.
2. Volume is the truth detector. A 15–20% reliability improvement from volume confirmation is too significant to ignore. Make above-average volume on the Shooting Star candle a non-negotiable requirement. Low-volume Shooting Stars are visual noise disguised as signals.
3. Wait for the confirmation candle. Acting on the Shooting Star's close alone — before the next session confirms the bearish direction — produces a significantly higher false entry rate. One additional session of patience, waiting for the candle to close below the Shooting Star's body or low, eliminates the majority of false signals.
Master the Shooting Star at resistance with RSI and volume confirmation. Trade it consistently for 30 sessions. Journal every outcome. The pattern's 60%+ win rate with proper context will become visible in your data — and so will the conditions when it fails, helping you refine when to apply it and when to stand aside.
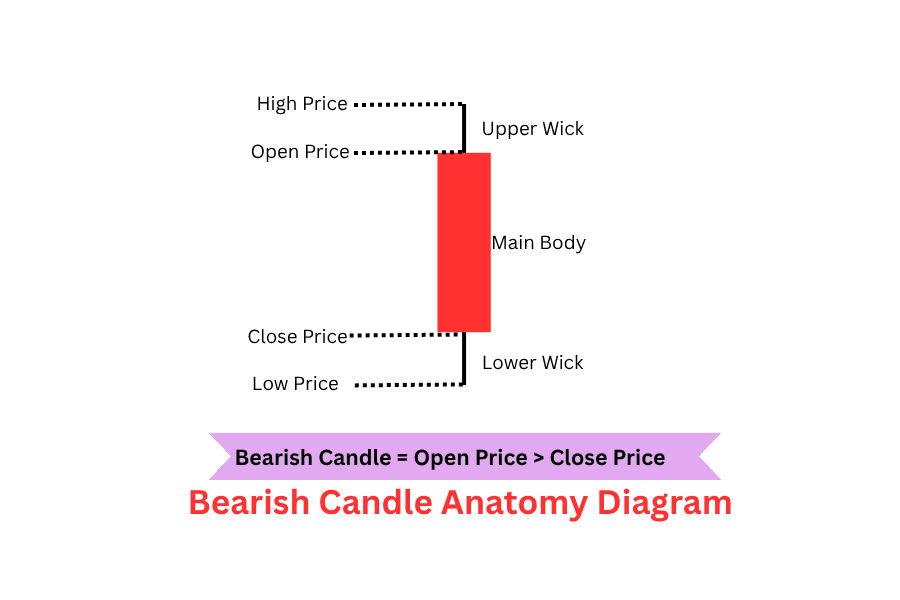
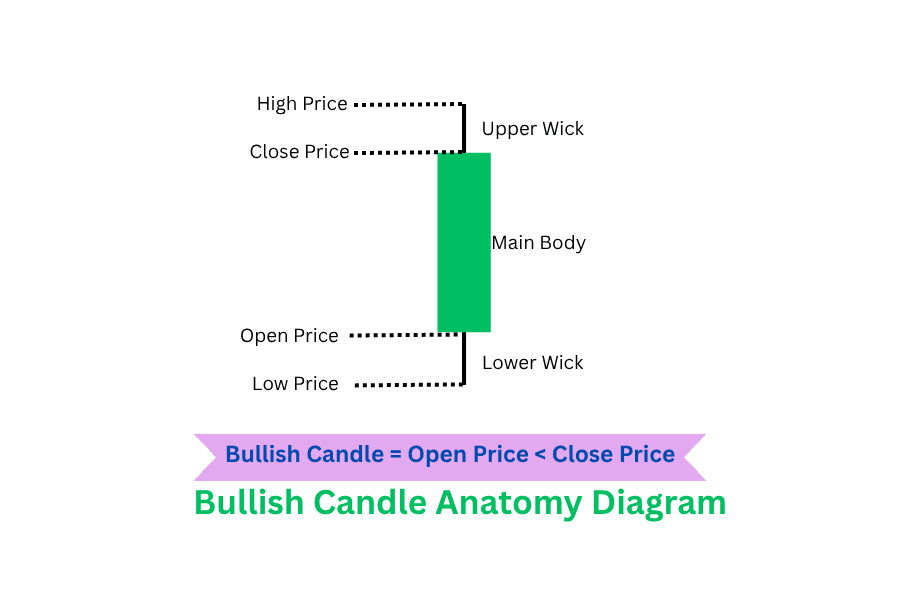
Further reading: Bearish Candle Anatomy: How to Read a Bearish Candlestick | Bullish Candle Anatomy: How to Read a Bullish Candlestick | Important Candlestick Patterns: The Complete Guide | Bearish Engulfing Pattern: Complete Trading Guide | Hammer Candlestick Pattern: Complete Trading Guide | RSI Trading Strategy: Complete Guide | Support and Resistance: The Complete Trading Guide | Volume Analysis Trading Strategy | Bollinger Bands Trading Strategy | Bullish Engulfing Pattern: Complete Trading Guide | Morning Star Candlestick Pattern: Complete Trading Guide | How to Trade Intraday Stocks in India | Dhanith Intraday Screener | Technical Analysis Mastery: The Complete Guide | Smart Money Concepts: The Complete Mastery Guide | 5 Best Intraday Trading Strategies for NSE India
Ready to Trade the Shooting Star on Real Stocks?
→ Open the Dhanith Intraday Screener — find today's NSE stocks where Shooting Star setups are forming at VWAP and key resistance levels on above-average volume
→ Calculate Your Position Size Before Every Trade — know your exact share count, stop distance, and maximum loss before entering any short
→ Log Every Shooting Star Trade in the Dhanith Journal — track which configurations produce the best results for your execution style
Disclaimer: This article is for educational purposes only and does not constitute financial or investment advice. Trading in stocks and financial markets involves significant risk of capital loss. Past performance does not guarantee future results. Always use proper risk management and stop losses.
Have a question about this article?
Comment on our latest Instagram post or send us a DM — we reply to every one.
@dhanith_officialWas this article helpful?
Click to rate
Founder, Dhanith Trading
7+ years trading Nifty, Bank Nifty, NSE stocks, and commodities — specializing in Smart Money Concepts (SMC) and ICT price action. Founder of Dhanith — a trading journal, intraday screener, and risk tools platform built for retail traders.
Dhanith Newsletter
Enjoyed this article? Get more like it.
New trading guides, candlestick patterns, SMC strategies, and tool updates — straight to your inbox. Free, for Indian traders.
No spam. Unsubscribe anytime.
Continue Reading