On this page
- Introduction
- Part 1: What Is the Bearish Engulfing Pattern?
- The Formal Definition
- The OHLC Story — What Each Candle Reveals
- The Body-to-Body Rule — The Critical Distinction
- What Strengthens the Signal
- Part 2: The Four Types of Bearish Engulfing Setups
- Type 1 — Perfect Bearish Engulfing (Maximum Power)
- Type 2 — Standard Bearish Engulfing (Reliable)
- Type 3 — Gap Engulfing (High Momentum)
- Type 4 — Bearish Engulfing After Exhaustion (Extended Rally Top)
- Part 3: The Data — Bearish Engulfing Win Rate and Statistics
- What the Research Shows
- The Confluence Effect
- A Counterintuitive Research Finding
- Part 4: How to Identify a Valid Bearish Engulfing — The Complete Checklist
- The 7-Point Identification Checklist
- Part 5: Five Complete Bearish Engulfing Trading Strategies
- Strategy 1 — Bearish Engulfing at Resistance (The Foundation Strategy)
- Strategy 2 — Bearish Engulfing + RSI Overbought (Momentum Exhaustion)
- Strategy 3 — Bearish Engulfing + MACD (Trend Confirmation)
- Strategy 4 — Bearish Engulfing + Bollinger Bands (Volatility Extreme)
- Strategy 5 — Bearish Engulfing at Moving Average Resistance (Trend Alignment)
- Part 6: Stop Loss and Target — The Complete Rules
- Stop Loss Placement
- Target Setting Rules
- Part 7: Bearish Engulfing vs. Related Patterns
- Bearish Engulfing vs. Bullish Engulfing
- Bearish Engulfing vs. Dark Cloud Cover
- Bearish Engulfing vs. Bearish Harami
- Part 8: Bearish Engulfing on Different Timeframes
- Daily Chart — Primary Application
- Weekly Chart — Maximum Institutional Weight
- 5-Minute and 15-Minute Chart — Intraday NSE Application
- Part 9: Common Bearish Engulfing Mistakes and Exact Fixes
- Mistake 1 — Trading in an Established Bull Market
- Mistake 2 — Incomplete Engulfment
- Mistake 3 — Ignoring Volume
- Mistake 4 — Stop Loss Inside the Pattern
- Mistake 5 — Not Confirming with at Least One Indicator
- Mistake 6 — Setting the Target Too Conservatively
- FAQ
- Conclusion
- Ready to Trade the Bearish Engulfing on Real Stocks?
Bearish Engulfing Pattern: Complete Trading Guide & Strategies (2026)
Master the Bearish Engulfing candlestick pattern in 2026. Learn exact identification rules, 5 proven strategies, RSI + MACD + Bollinger Bands combinations, stop loss placement, targets, and common mistakes — with real NSE stock examples.
Introduction
There is a moment every long trader dreads.
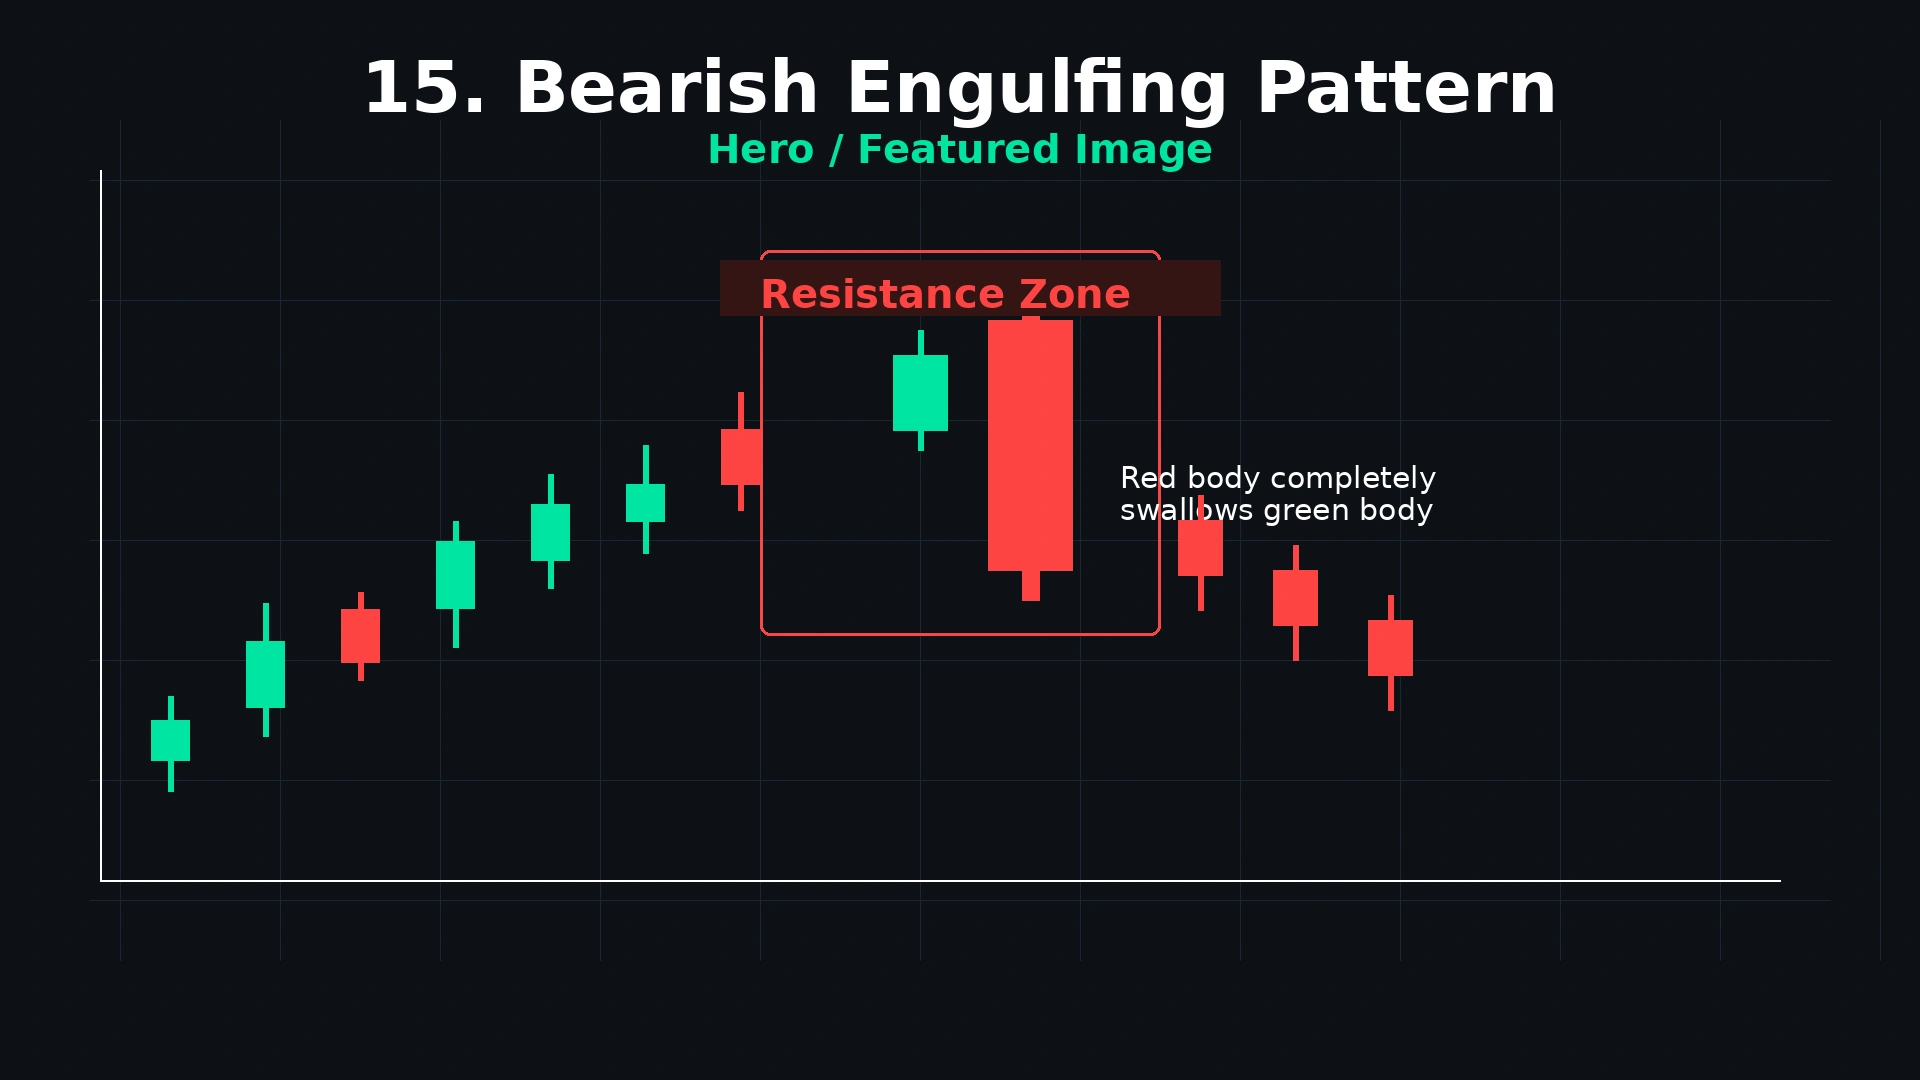
A stock has been rising for days. Your position is profitable. The uptrend looks strong and you are holding with confidence. Then, on a single day, everything changes. The session opens even higher than the previous close — confirming your bullish thesis. But as the day progresses, sellers emerge with overwhelming force. They push price not just back to the previous day's open but well below it, closing the session in a deep red that completely swallows the entire prior green candle whole.
That was a Bearish Engulfing pattern. And if you missed it as an exit signal, the next several sessions likely taught you an expensive lesson.
The Bearish Engulfing candlestick pattern is a two-candle reversal signal that appears at market tops, at resistance levels, and after sustained rallies. It signals something precise and powerful: in a single session, sellers have overwhelmed buyers so completely that they have erased the entire previous session's gain and extended far below it. The battle for direction has flipped decisively — and the people who were winning (buyers) are now on the wrong side of the trade.
Understanding the Bearish Engulfing pattern correctly — not just recognising its visual shape but understanding its psychology, its context requirements, its reliable strategies, and its failure modes — is one of the most valuable skills a price action trader can develop.
The Bearish Engulfing is a two-candlestick reversal formation that appears after a price advance. The first candle is bullish, confirming the existing uptrend. The second candle is bearish and its body completely swallows the body of the first candle, showing that sellers overpowered buyers within a single session.
This guide covers the complete Bearish Engulfing framework — from precise identification rules to five complete trading strategies with exact entry, stop, and target rules, to the data on win rates, and the most common mistakes with exact fixes.
TL;DR — Key Takeaways
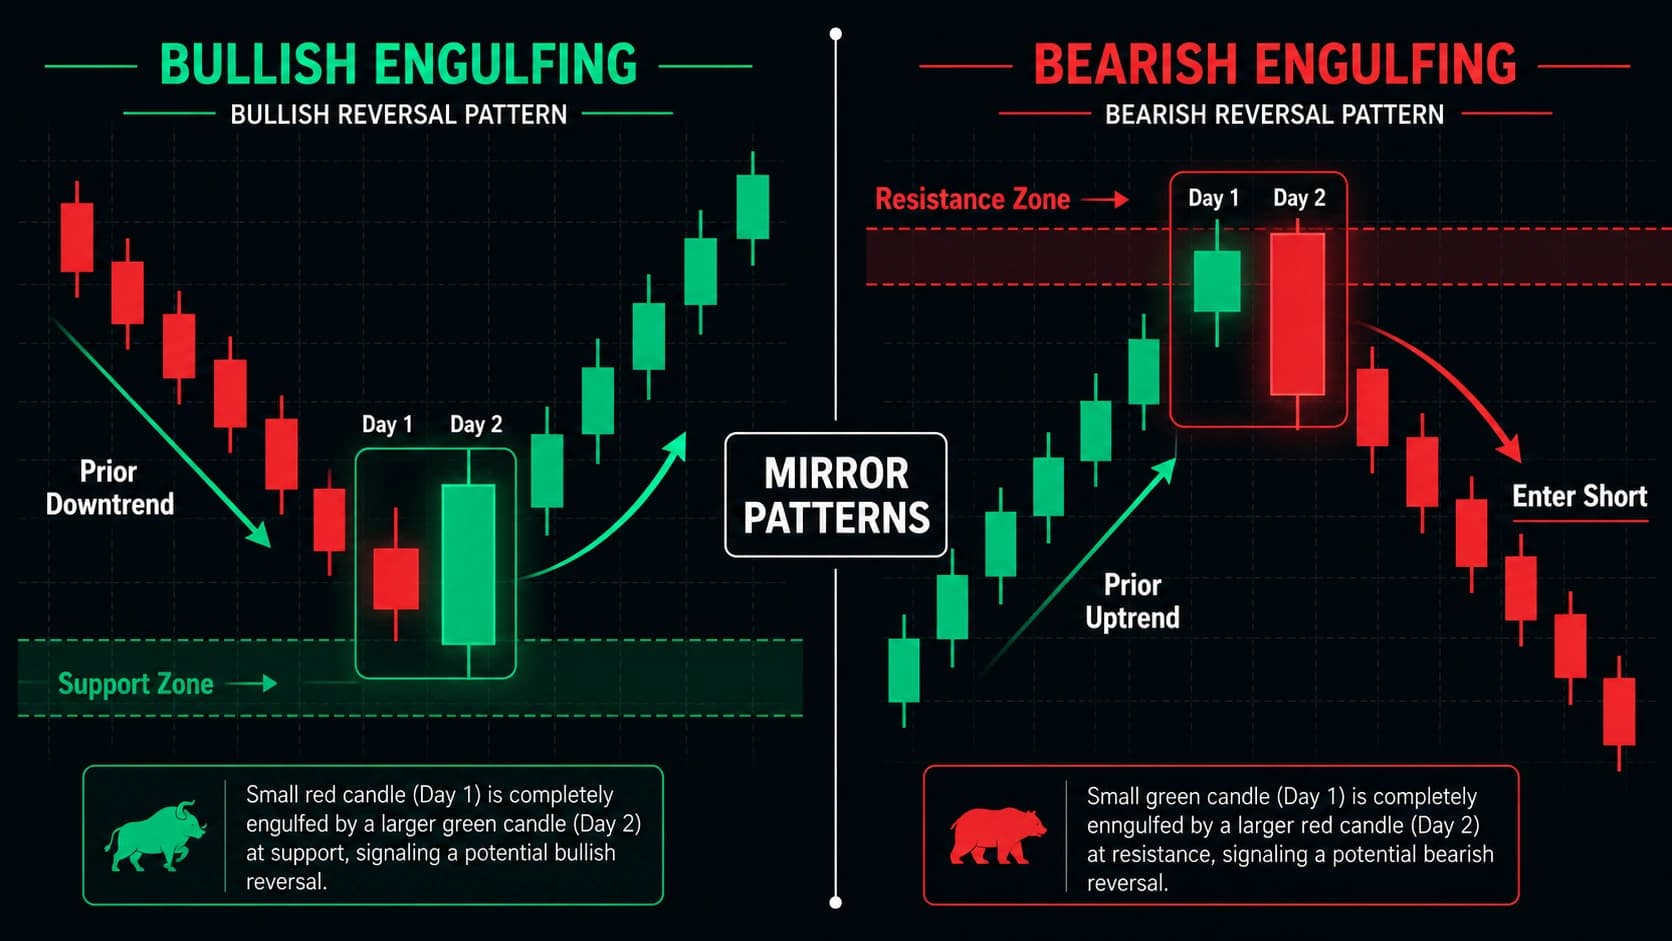
- A Bearish Engulfing pattern is a two-candle bearish reversal signal — a small bullish candle (Day 1) is completely engulfed by a larger bearish candle (Day 2) that opens higher and closes lower
- Research by Liberated Stock Trader puts the win rate at approximately 57% on the daily timeframe. Reliability improves significantly when combined with overbought RSI, a key resistance zone, or high volume
- Three non-negotiable requirements: prior uptrend, complete body engulfment (body to body, not wick), above-average volume on Day 2
- The larger Day 2 is relative to Day 1, the more decisive the seller takeover — size differential matters
- Five strategies: Bearish Engulfing at Resistance, Engulfing + RSI Overbought, Engulfing + MACD, Engulfing + Bollinger Bands, Engulfing at Moving Average Resistance
- Stop loss: above Day 2's high (the engulfing candle's high) with a small buffer
- Target: previous swing low below — minimum 2:1 risk-reward required
- The Bearish Engulfing is most powerful when Day 2 closes near its session low — showing sellers dominated throughout, with no buyer recovery at the close
Part 1: What Is the Bearish Engulfing Pattern?
The Formal Definition
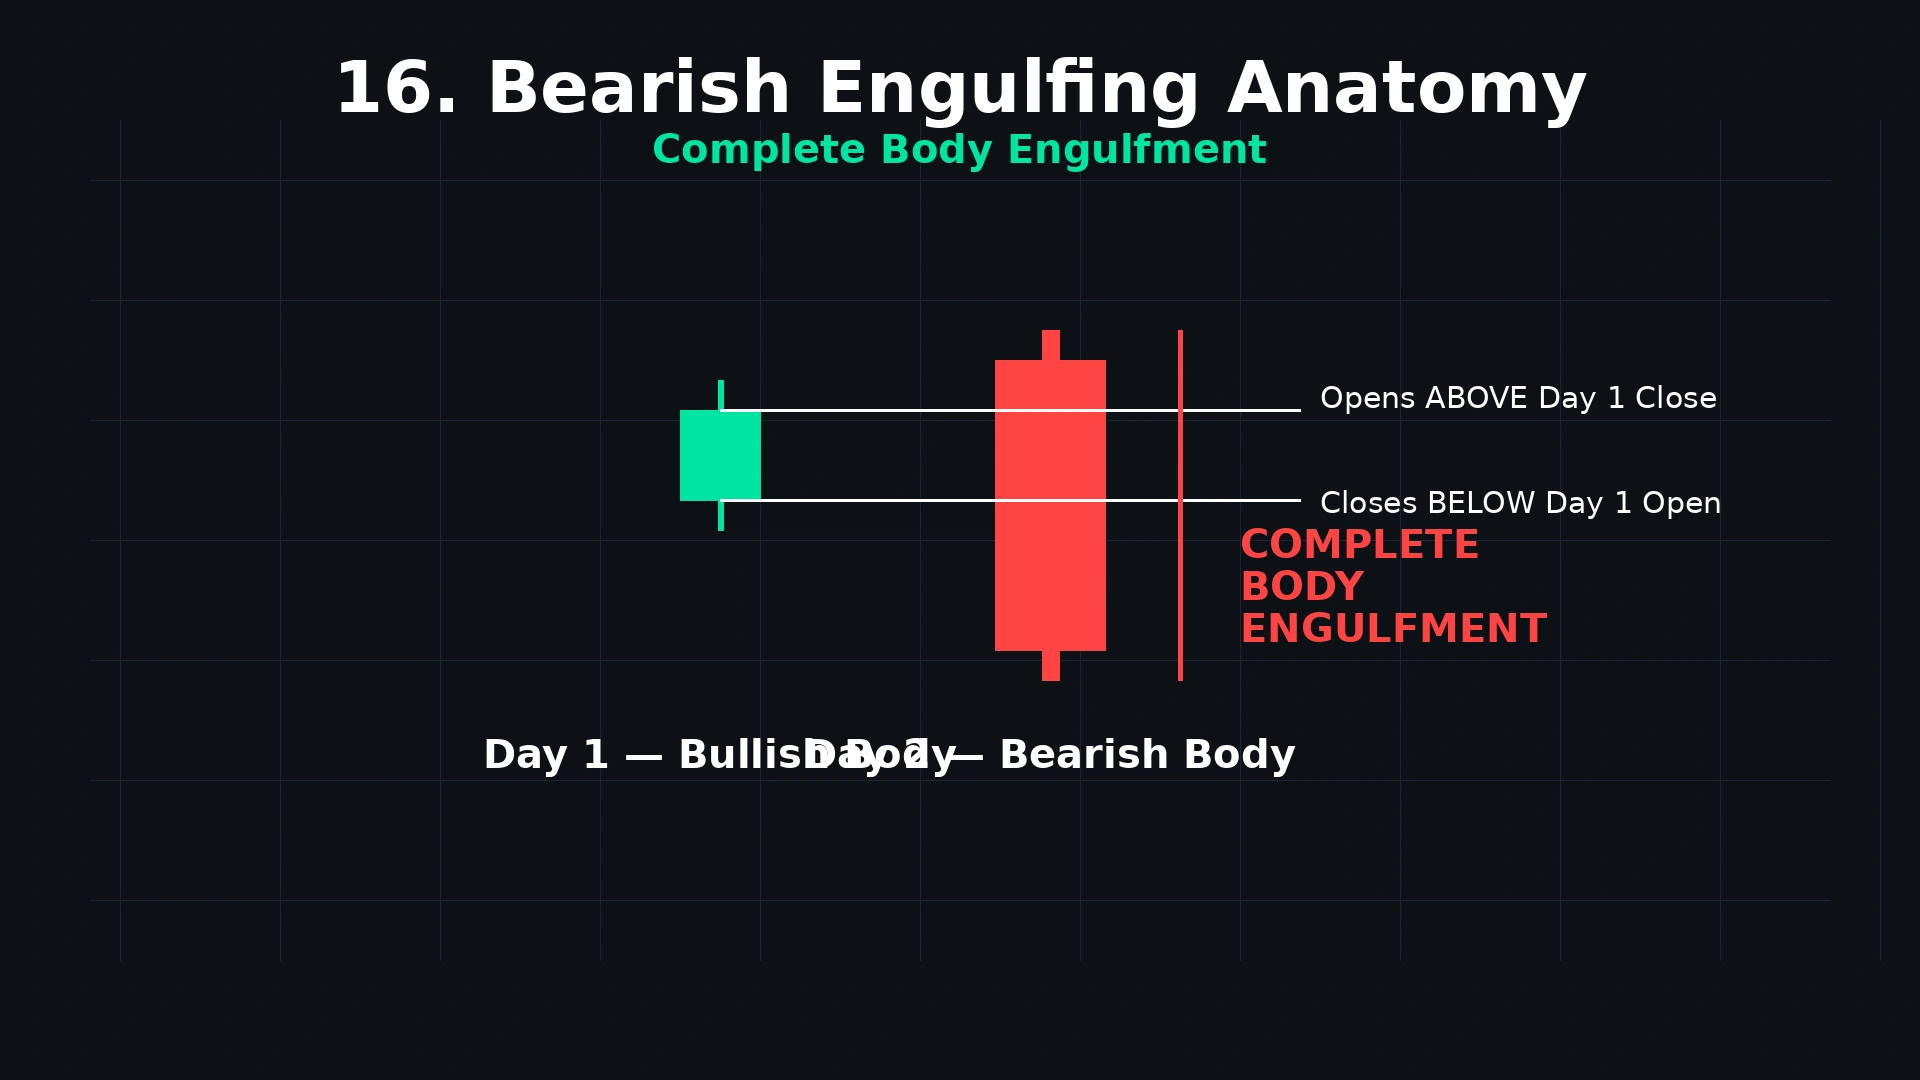
A Bearish Engulfing pattern is a two-candlestick bearish reversal formation that appears after an uptrend. It consists of:
Candle 1 (Day 1): A bullish (green/white) candle — confirming that buyers were in control during the prior session. The body should be clearly bullish (close above open).
Candle 2 (Day 2 — the Engulfing Candle): A bearish (red/black) candle whose body completely engulfs the body of Candle 1. Specifically:
- Day 2 opens at or above Day 1's close
- Day 2 closes at or below Day 1's open
- Day 2's body completely covers Day 1's body from below and above
The red candle opens above the previous close and closes well below the green body, showing a complete rejection of the prior candlestick's gains. The pattern signals that selling pressure has returned with force and that the uptrend may be ending. The first candle indicates buyers still trying to push forward, but the second red candle completely overwhelms them, leaving no doubt about the new direction.
The OHLC Story — What Each Candle Reveals
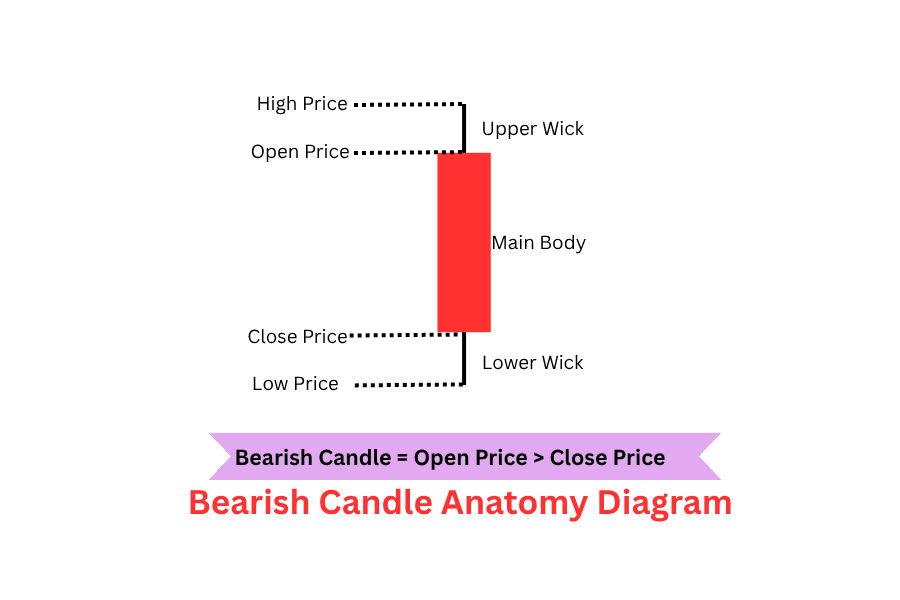
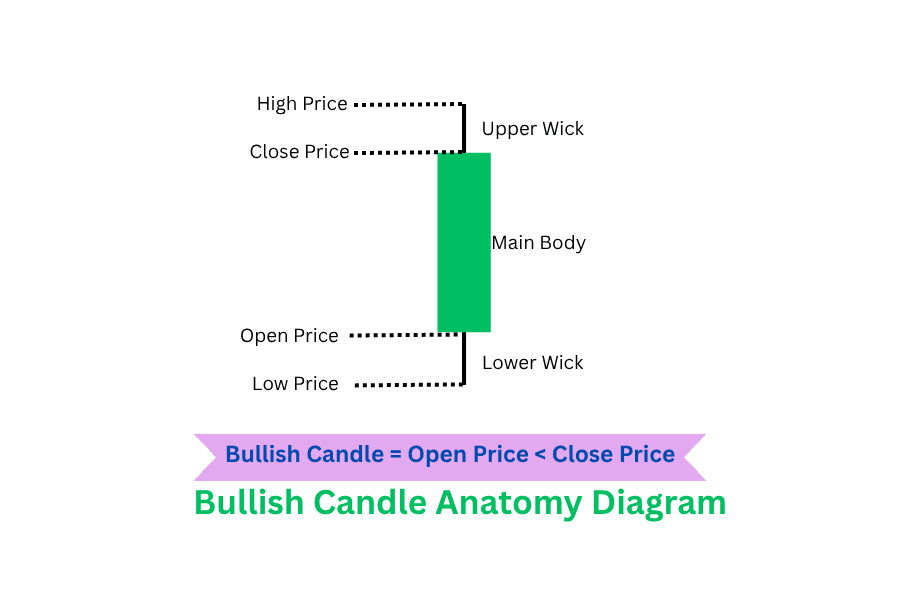
Day 1 (Bullish Candle):
- Opens at a price — buyers push it higher through the session
- Closes above the open — buyers win the session decisively
- Message to the market: "Buyers are in control. The uptrend continues."
Day 2 (Engulfing Candle):
- Opens at or above Day 1's close — initially appears to confirm bullish momentum
- Sellers surge in and overwhelm buyers aggressively
- Closes below Day 1's open — sellers have erased all of Day 1's gains and pushed below where Day 1 began
- Message to the market: "Sellers have comprehensively reversed everything buyers achieved yesterday. Control has shifted."
The psychological shift is complete. Day 1 declared buyer victory. Day 2 annulled that victory entirely and issued a new declaration of seller dominance. For traders holding long positions from Day 1 or before, this is a warning to reassess — or exit.
The Body-to-Body Rule — The Critical Distinction
The engulfment is body to body, not wick to wick.
Day 2's candle body (open to close) must exceed Day 1's candle body (open to close) in both directions. Day 2's wicks can extend further — those are less significant than the body engulfment itself.
Only the real bodies need to overlap. The second candle does not have to engulf the wicks of the first candle for the pattern to be valid.
This is a commonly misunderstood point. A Day 2 candle that shows a wick reaching below Day 1's wick but a body that does not completely engulf Day 1's body is NOT a valid Bearish Engulfing. The bodies represent the genuine directional battle of the session; the wicks are brief excursions that were recovered.
Body engulfment = real seller dominance throughout the session Wick-only extension = temporary price excursion, not sustained seller control
What Strengthens the Signal
Not all Bearish Engulfing patterns carry equal weight. The following factors amplify the signal's reliability:
1. Large Day 2 relative to Day 1: The size differential between the candles matters — the larger the engulfing candle relative to the prior candle, the stronger the potential reversal signal.
2. Day 2 closes near its session low: Ideally, Day 2 closes near the session low, showing strong seller control. A long lower wick on Day 2 would reduce signal strength — it would show buyers fought back near the close.
3. High volume on Day 2: Engulfing patterns are most reliable when volume reaches 2–3× the average.
4. At a significant resistance level: A pattern floating in mid-range carries far less weight than one at a well-established prior high, resistance zone, or round number.
Part 2: The Four Types of Bearish Engulfing Setups
Type 1 — Perfect Bearish Engulfing (Maximum Power)
Day 2 is dramatically larger than Day 1 — 1.5× to 2× or more the size. The bearish candle opens with a gap above Day 1's close and closes well below Day 1's open, leaving little doubt about the shift in control.
The size differential is the critical factor here. A massive Day 2 candle overwhelming a small Day 1 candle tells a clear story: sellers stepped in with institutional force and overwhelmed the modest buying of the previous session. The visual impact matches the psychological reality — decisive seller takeover.
Signal strength: Maximum. Trade with full conviction at appropriate position sizing.
Type 2 — Standard Bearish Engulfing (Reliable)
Day 2's body exceeds Day 1's body moderately — roughly 1.0× to 1.5× larger. The engulfment is complete but not visually dramatic. This is the most frequently occurring version.
Despite its everyday appearance, the standard Bearish Engulfing at the right location (resistance level, after an extended uptrend) with volume confirmation is a fully tradeable setup.
Signal strength: High. Apply all standard confirmation filters.
Type 3 — Gap Engulfing (High Momentum)
Day 2 opens with a visible gap above Day 1's close — appearing to confirm bullish continuation — before sellers overwhelm buyers completely and close well below Day 1's open.
The gap-up opening creates a specific trap: breakout buyers who enter on the gap-up (expecting bullish continuation) are immediately on the wrong side as the session reverses. Their forced exits add additional selling pressure to the already-dominant bearish move. The resulting pattern is sharp, conviction-filled, and often marks significant market tops.
On Indian equity markets, the gap Bearish Engulfing appears regularly on overnight developments — strong US markets encouraging a gap-up open on NSE, followed by intraday selling that completely reverses the bullish opening. When this appears at a prior resistance level, treat it as a high-conviction short signal.
Signal strength: Very High — particularly potent because of the trapped breakout buyers adding fuel to the reversal.
Type 4 — Bearish Engulfing After Exhaustion (Extended Rally Top)
This version occurs after an extended multi-session rally where price has reached an extreme — well above moving averages, with RSI deeply overbought, at a significant resistance level. The pattern coincides with the technical exhaustion of the uptrend.
These setups tend to mark meaningful tops — not just brief pullback entries — because the confluence of exhaustion signals means both technical traders and fundamental value sellers are exiting simultaneously. The snap-back downward has momentum from long liquidation, short-sellers, and momentum traders all entering together.
Signal strength: High — works best for longer-term swing traders targeting the full reversal of the prior uptrend.
Part 3: The Data — Bearish Engulfing Win Rate and Statistics
What the Research Shows
On the daily timeframe, research by Liberated Stock Trader puts the win rate at approximately 57%. This makes it statistically useful but not infallible. Reliability improves significantly when the pattern is combined with other signals such as overbought RSI, a key resistance zone, or high volume on the engulfing candle.
Research across 56,680 test trades found the Bearish Engulfing around 57% success rate. The Bullish and Bearish Engulfing patterns appear regularly across all markets and timeframes, have documented win rates of 57–65%, and are the first patterns most professional traders learn to trade at scale.
The Confluence Effect
Every filter applied to a Bearish Engulfing setup raises its probability:
| Bearish Engulfing Configuration | Win Rate (Approximate) |
|---|---|
| Standalone (no context filters) | 53–57% |
| After confirmed uptrend (5+ bullish sessions) | 57–60% |
| At recognised resistance level | 62–65% |
| With above-average volume on Day 2 | 63–67% |
| With RSI above 70 (overbought) | 65–70% |
| With bearish MACD divergence | 65–70% |
| All filters: resistance + volume + RSI overbought | 68–73% |
| At SMC order block/FVG + volume + resistance | 72–78% |
Gate.io's January 2026 analysis found that pairing RSI with MACD produced a 77% win rate in backtesting. Adding Bollinger Bands as a third confirmation layer maintains the 73–77% range while significantly reducing false signals.
A Counterintuitive Research Finding
One of the most fascinating research findings about the Bearish Engulfing pattern appears in rigorous backtesting: the pattern actually behaves as a mean-reversion bullish signal in certain systematic tests on indices (particularly the S&P 500). When a Bearish Engulfing appears in an established uptrend and the test system buys it rather than shorts it, win rates exceed 75%.
This does not mean you should buy Bearish Engulfing patterns. It means the pattern identifies extreme selling events that often snap back in established bull markets. The implication for traders: in a strong bull market, a Bearish Engulfing within the uptrend may be a pullback entry for longs rather than a short signal. In a choppy or bearish market, at resistance, it is the short signal it visually implies.
Context determines everything. This is the most important lesson from the statistical analysis of this pattern.
Part 4: How to Identify a Valid Bearish Engulfing — The Complete Checklist
The 7-Point Identification Checklist
Check 1 — Prior Uptrend: Price must have been rising meaningfully before the pattern forms — at least 5 consecutive bullish sessions for basic validity, ideally 7–10+ sessions for a more established trend. The Bearish Engulfing reverses an uptrend. Without one, there is nothing to reverse.
Check 2 — Day 1 Is a Clearly Bullish Candle: Day 1 must close above its open with a visible body. A Doji-like Day 1 weakens the setup — a clear bullish Day 1 makes the subsequent engulfment more meaningful.
Check 3 — Day 2 Opens at or Above Day 1's Close: Day 2 must open at or above Day 1's close — the initial direction appears bullish before the reversal begins. A Day 2 that opens inside Day 1's body (lower than Day 1's close) is valid but slightly weaker.
Check 4 — Day 2 Closes at or Below Day 1's Open (Complete Engulfment): Day 2's close must be at or below Day 1's open — the complete erasure of Day 1's gain. This is the absolute minimum requirement for the pattern to qualify.
Check 5 — Day 2 Is Larger Than Day 1: The bearish candle (Day 2) must be larger than the bullish candle (Day 1). A Day 2 that barely exceeds Day 1's body carries weaker conviction than one that dramatically exceeds it.
Check 6 — Volume Confirmation: Day 2's volume must be meaningfully above the recent average — ideally 1.5× to 2× the 20-period average. Below-average volume Bearish Engulfing patterns fail significantly more often than high-volume ones.
Check 7 — Key Level Proximity: The pattern forms at or near a significant technical level: prior resistance zone, round number, prior swing high, moving average resistance, Fibonacci retracement level, or an SMC order block/FVG zone in premium territory.
Minimum for a tradeable setup: Checks 1, 4, and 6 are mandatory. With all seven, the setup is Grade A.
Part 5: Five Complete Bearish Engulfing Trading Strategies
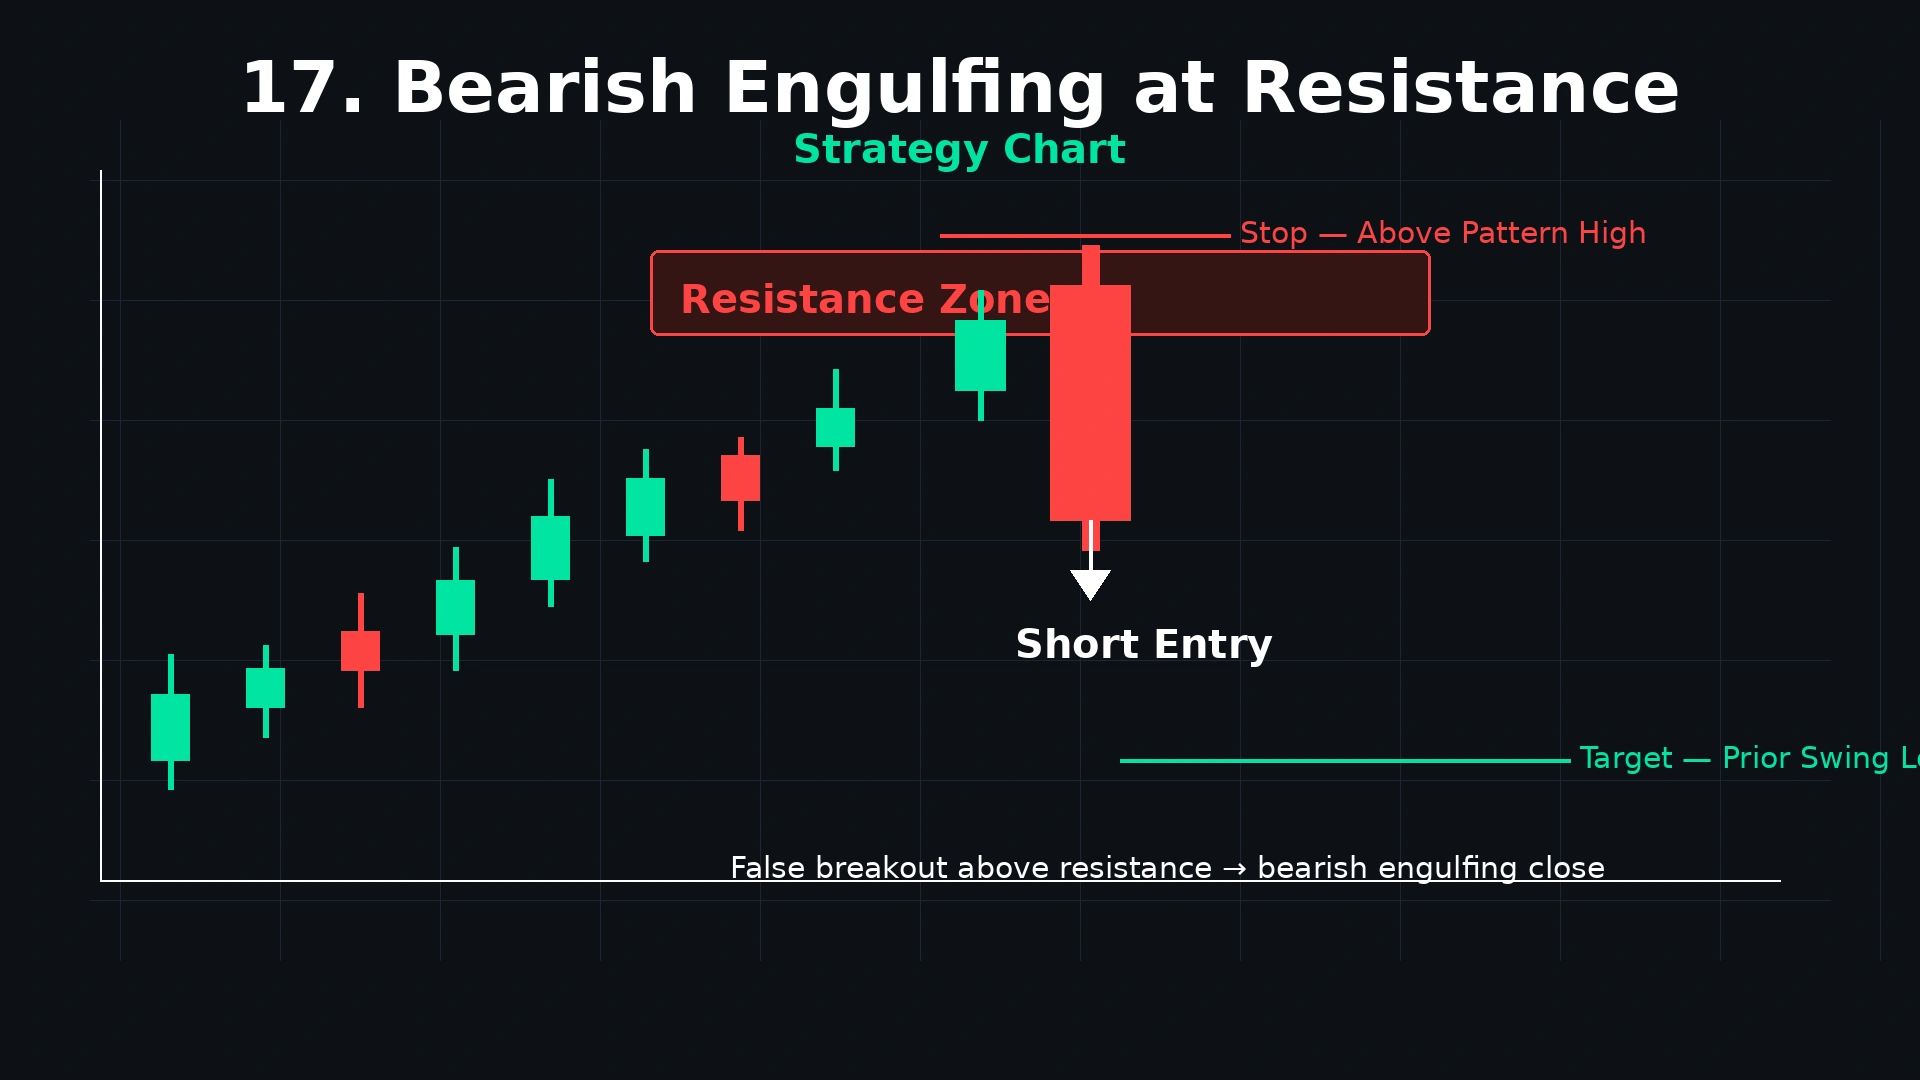
Strategy 1 — Bearish Engulfing at Resistance (The Foundation Strategy)
The most reliable and most widely traded Bearish Engulfing strategy. The resistance level provides the structural context; the pattern provides the timing signal.
Setup conditions:
- Identify a significant resistance level on the daily chart (prior swing high, horizontal resistance zone, round number, previous breakout level)
- Price rallies from below toward this resistance over 5+ sessions
- A Bearish Engulfing forms as price reaches the resistance zone
- Ideally, Day 1 closes briefly above resistance (false breakout — trapping breakout buyers) and Day 2's engulfing candle closes decisively below resistance
Why the false breakout version is most powerful: The brief penetration above resistance on Day 1 (or on Day 2's opening gap) triggers the buy stops of breakout traders and the stop losses of short sellers who were positioned below resistance. This liquidity collection provides additional fuel for the subsequent downward move as those trapped breakout buyers are forced to exit their losing long positions.
Real NSE example (TCS): TCS faced resistance at ₹2,260–₹2,290 and reversed four times from there. A big Bearish Engulfing candle formed on the daily chart at that resistance level with volume above the 20-day average. RSI had broken down indicating more weakness, and the MACD histogram started decreasing in size.
- Entry: ₹2,255 (Day 2 close of the Bearish Engulfing at resistance)
- Stop: ₹2,298 (above Day 2's high with buffer)
- Risk: ₹43 per share
- Target: ₹2,165 (prior swing low support)
- Risk-Reward: 2.09:1
Entry:
- Aggressive: At the close of Day 2 (the engulfing candle)
- Conservative: Wait for Day 3 to open below Day 2's close, confirming the reversal held overnight
Stop Loss: Above the high of Day 2 (the engulfing candle's high — the session high) with a 0.2–0.3% buffer.
Target: The previous swing low below. Minimum 2:1 risk-reward before entering.
Pro Tip: A Bearish Engulfing at resistance after a gap-up open is one of the cleanest short setups available. The gap-up entices breakout buyers at the worst possible moment — they buy into the Day 2 open expecting continuation, are immediately trapped as selling begins, and their forced exits add fuel to the bearish move. When you see a stock gap up above resistance and then close with a large Bearish Engulfing body — that setup demands attention.
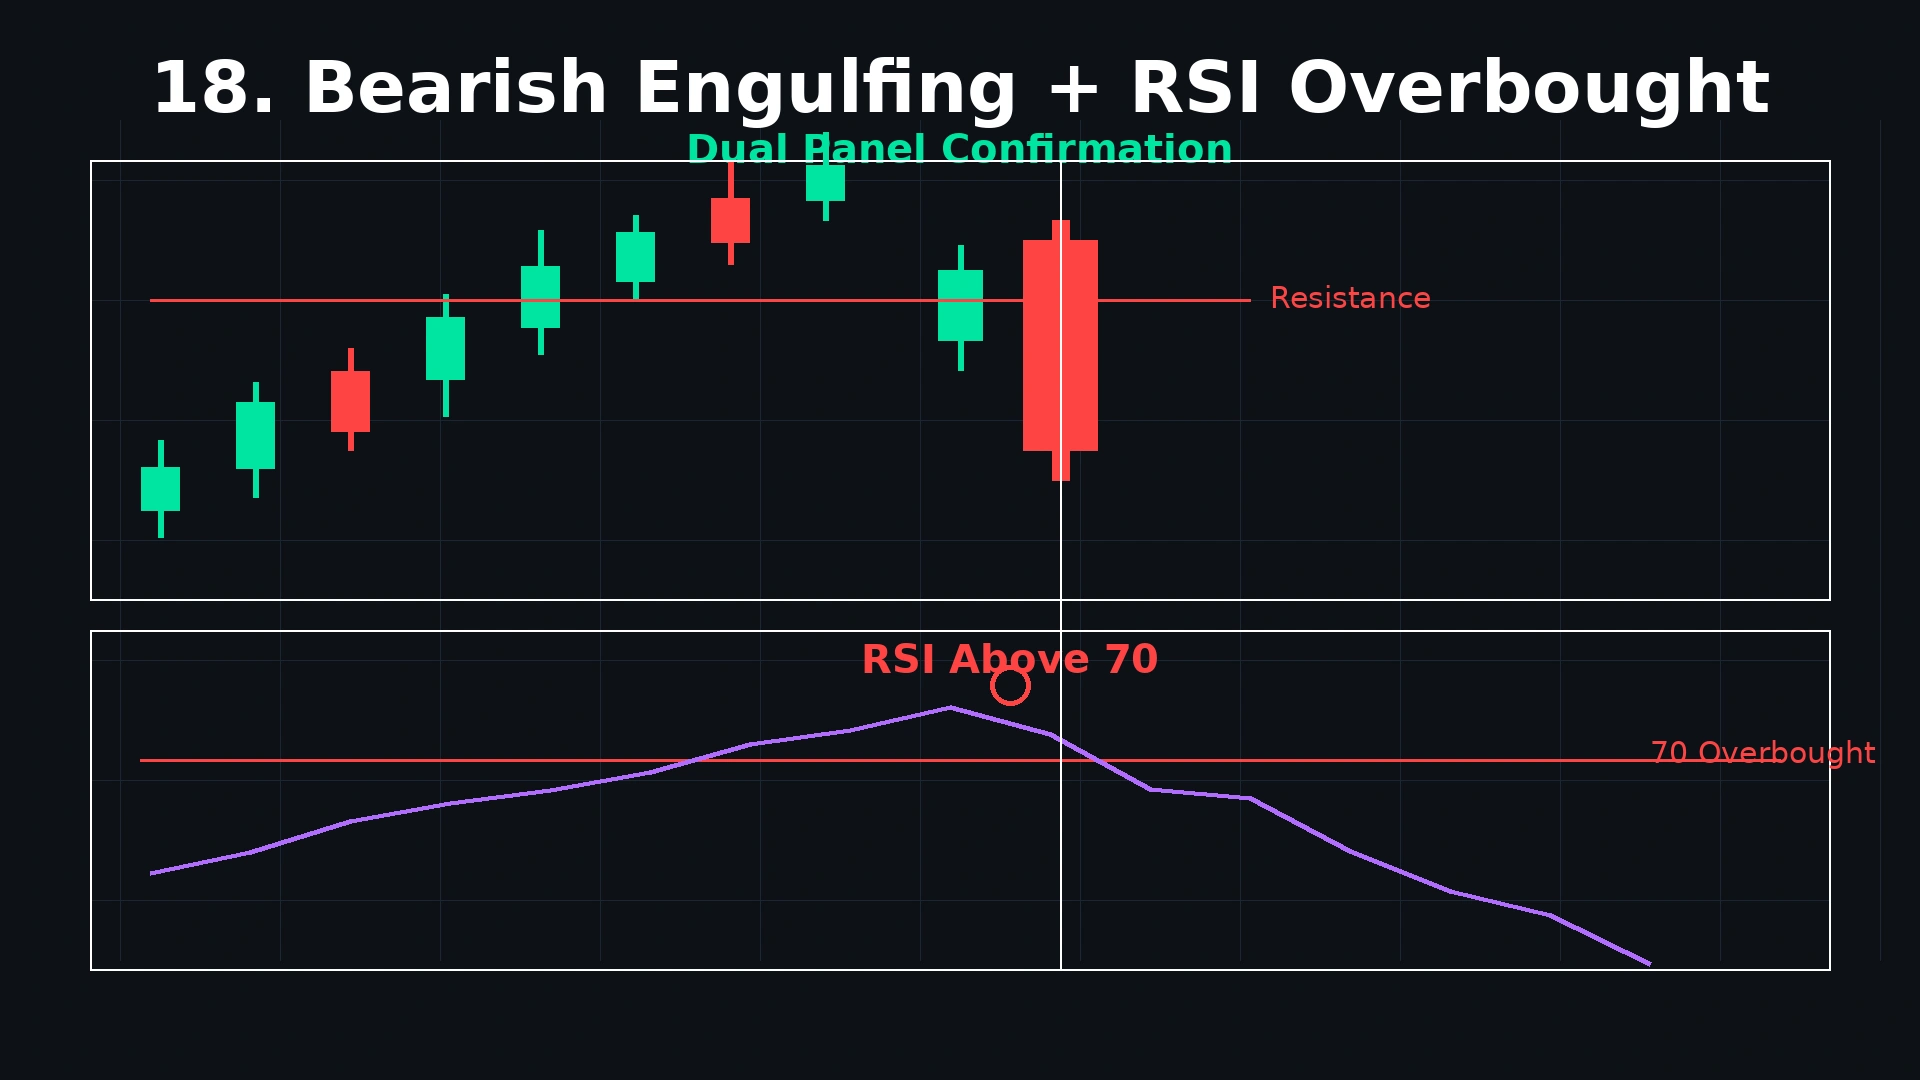
Strategy 2 — Bearish Engulfing + RSI Overbought (Momentum Exhaustion)
Adding RSI to the Bearish Engulfing setup provides an independent momentum confirmation that the buying pressure has genuinely exhausted itself.
Price pushes into resistance on a weak move, RSI prints above 70, and price closes back below resistance with a strong red candle. Often that closing candle is itself a bearish reversal pattern like a Bearish Engulfing or a Shooting Star. Now you have three pieces of evidence lining up: price is at range resistance, RSI is overbought, and the closing candle confirms rejection.
Two RSI configurations to use:
Configuration A — RSI Overbought (Above 70): RSI above 70 signals that the recent rally has pushed momentum to statistically extreme levels. When a Bearish Engulfing forms with RSI above 70, two independent readings confirm the same thesis: price is at an extreme and sellers are stepping in with decisive force.
Configuration B — RSI Bearish Divergence: Price makes a new high, but RSI makes a lower high — the underlying buying momentum was weakening even as price rose to a new extreme. The divergence shows the uptrend is running on fumes. When the Bearish Engulfing forms at the divergence point, it is the visual confirmation of what the divergence already implied: sellers have overwhelmed the final, exhausted buyers.
Entry: At the close of Day 2 (the Bearish Engulfing candle)
Stop: Above Day 2's high with a 0.2–0.3% buffer
Target:
- RSI returning to 50 (the momentum midpoint) as a minimum target reference
- The previous swing low as the price target
Post-entry RSI management: Once in the trade, if RSI crosses below 50, bearish momentum has firmly shifted. Consider trailing the stop behind each new lower high to capture extended moves.
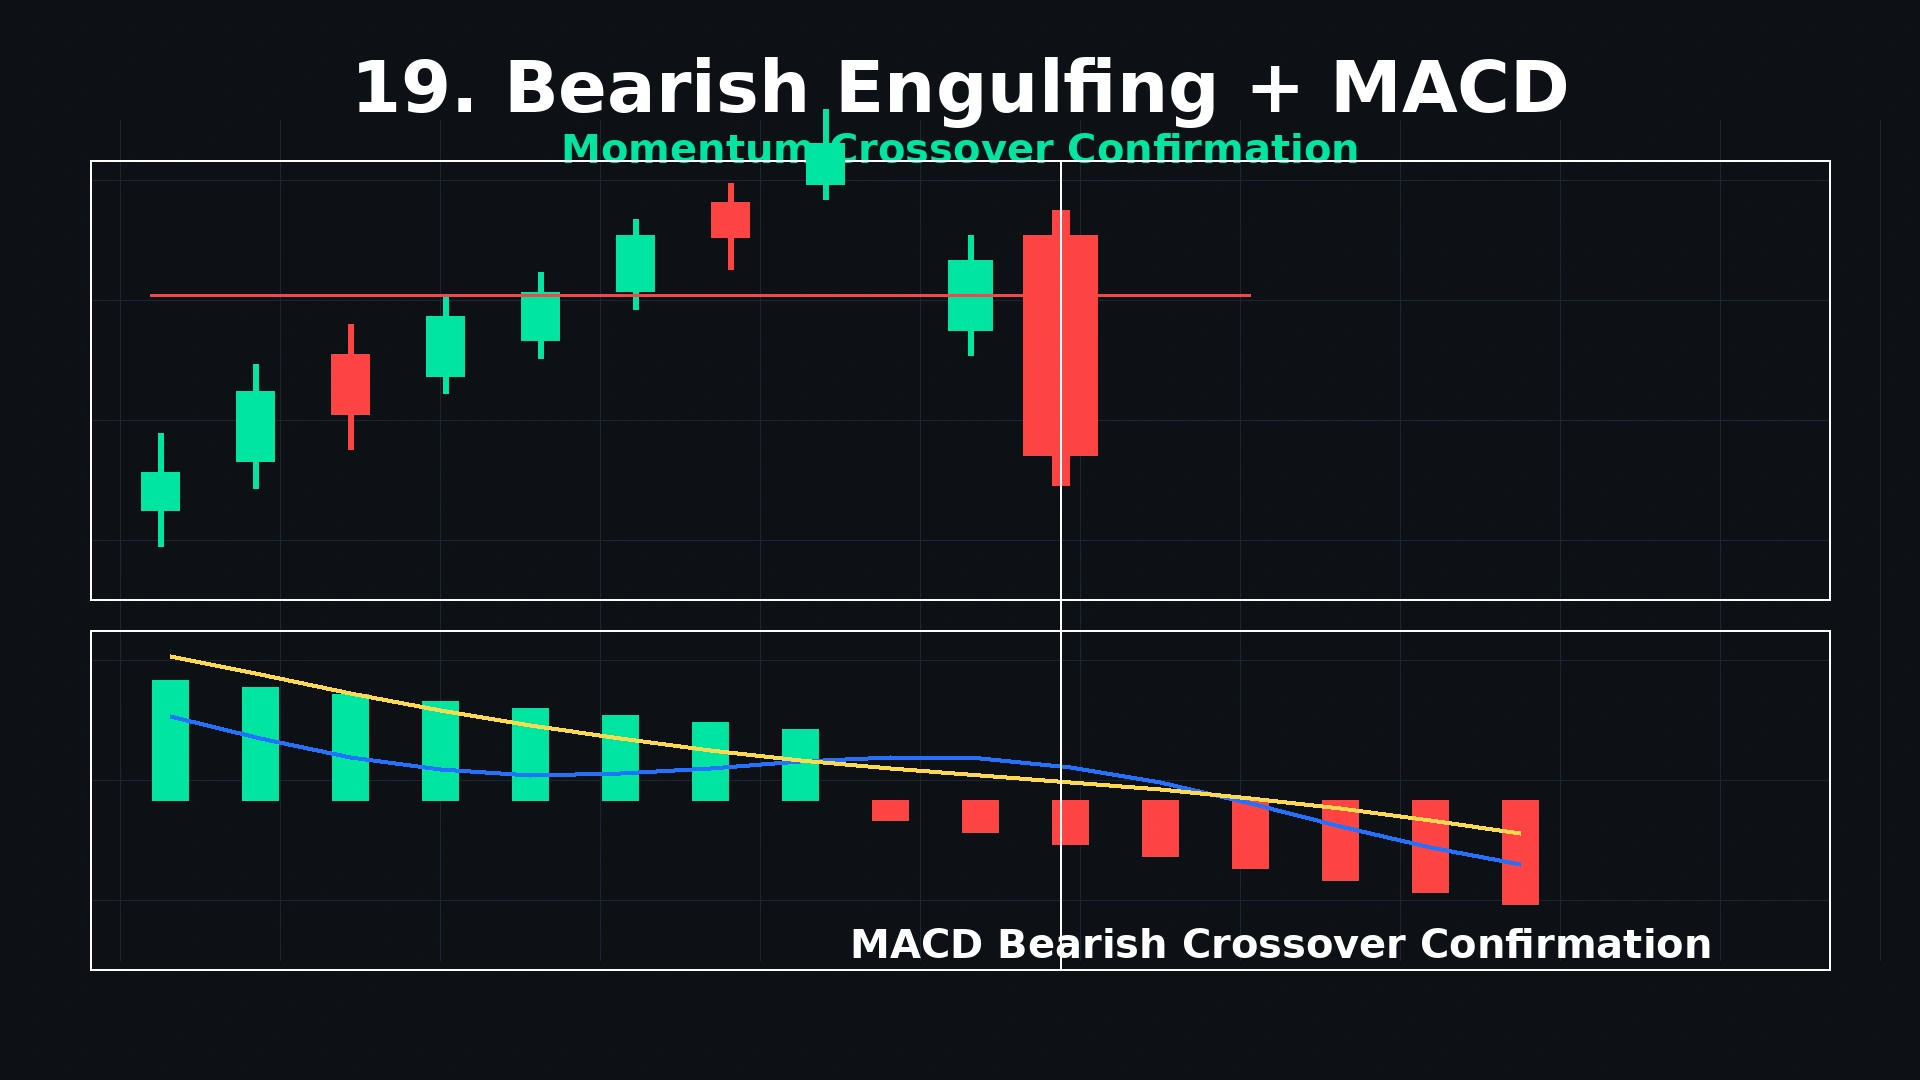
Strategy 3 — Bearish Engulfing + MACD (Trend Confirmation)
MACD adds a trend-momentum dimension to the Bearish Engulfing setup — distinguishing genuine trend reversals from temporary pullbacks within a continuing uptrend.
MACD configurations for Bearish Engulfing:
MACD Bearish Crossover: When the MACD line crosses below the signal line on or near the same session as the Bearish Engulfing, two independent momentum tools are simultaneously flagging bearish pressure. The MACD crossover confirms that the short-term momentum has shifted bearishly, aligning with the Engulfing's visual signal.
MACD Histogram Declining: If the MACD histogram bars have been shrinking for 3–5 sessions before the Bearish Engulfing forms — showing progressively weakening bullish momentum — and the Bearish Engulfing caps this declining histogram pattern, the combination is powerful. The histogram was warning of the reversal; the Engulfing confirms it.
MACD Bearish Divergence: Price makes a higher high. MACD makes a lower high. The divergence signals weakening institutional buying momentum despite price appearing strong. A Bearish Engulfing at this divergence point is the price action confirmation of the MACD divergence warning.
Entry and stop: Identical to Strategy 1 — at Day 2 close, stop above Day 2 high
Target: The MACD bearish crossover below zero line as a momentum reference. Price target: previous swing low.
Pro Tip: Use MACD on the weekly chart for context and the daily Bearish Engulfing for entry timing. A weekly MACD that has been declining for 2–3 weeks, combined with a daily Bearish Engulfing at resistance, gives you both the macro momentum context (weekly MACD weakness) and the precise entry timing (daily Engulfing). This top-down approach eliminates many false short signals that appear on the daily chart when the weekly trend is still firmly bullish.
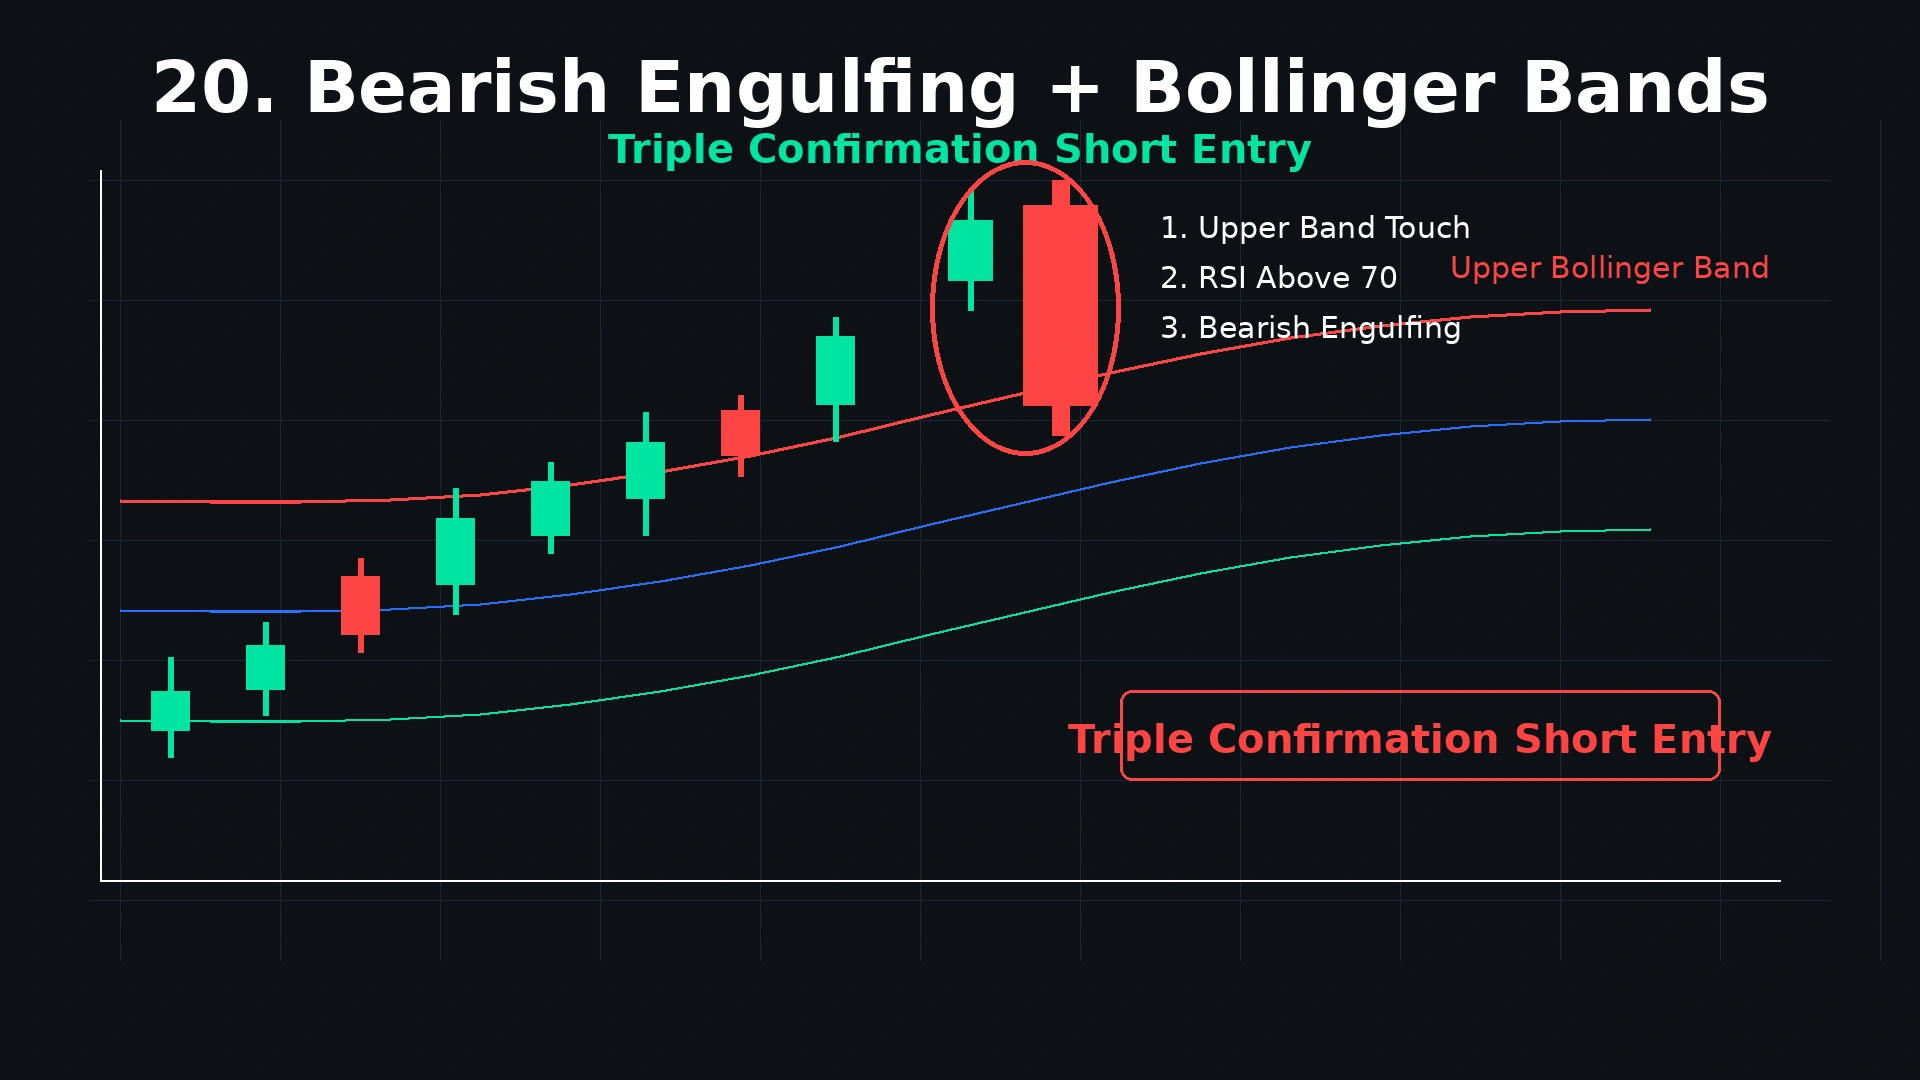
Strategy 4 — Bearish Engulfing + Bollinger Bands (Volatility Extreme)
The Bollinger Band strategy identifies moments when price has extended to a statistically extreme level before the Bearish Engulfing forms — adding a volatility-based filter to the pattern.
Set up RSI (14) and Bollinger Bands (20-period, 2 standard deviations) on your chart. Wait for price to reach the upper Bollinger Band AND RSI to be above 70 (overbought). If a Bearish Engulfing pattern forms in that zone, the confluence of three signals makes for a compelling short entry. Target: 20-period SMA (middle Bollinger Band) or lower band.
The three-signal setup:
- Price at upper Bollinger Band: Statistically, 95% of price action occurs within the ±2 standard deviation bands. When price touches the upper band, it has reached a statistically unusual extreme — mean reversion is more probable.
- RSI above 70: Momentum is in overbought territory — the rally has exceeded typical equilibrium levels.
- Bearish Engulfing forms: The visual confirmation that sellers are stepping in at this combined extreme — volatility and momentum both at the ceiling.
Entry: At the close of the Bearish Engulfing candle, when all three conditions are simultaneously active
Stop: Above the Bearish Engulfing candle's high (and above the upper Bollinger Band) with a 0.2–0.3% buffer
Targets:
- First target: The 20-period SMA (middle Bollinger Band) — the mean reversion midpoint
- Second target: The lower Bollinger Band (full mean reversion)
- Price-based target: Previous swing low below
Why this combination is statistically robust: Gate.io's January 2026 analysis found that pairing RSI with MACD produced a 77% win rate in backtesting. Adding Bollinger Bands as a third confirmation layer maintains the 73–77% range while significantly reducing false signals.
When the Bearish Engulfing is the third signal — after price reaching the upper band and RSI exceeding 70 — the false signal rate drops significantly compared to any single indicator alone.
Strategy 5 — Bearish Engulfing at Moving Average Resistance (Trend Alignment)
Moving averages that functioned as support during an uptrend often become resistance during a downtrend — and a Bearish Engulfing at these key moving average levels provides a powerful trend-aligned short entry signal.
The moving average resistance context:
Using the 20 EMA as resistance (Downtrend pullback): In an established downtrend, price often rallies back to the 20 EMA before sellers reassert control. A Bearish Engulfing forming exactly at the 20 EMA during a downtrend pullback is a high-probability short setup: the moving average provides the structural resistance, and the pattern provides the timing confirmation that sellers are defending it.
Using the 200 SMA as resistance (Major reversal): After a stock breaks below its 200 SMA, the long-term trend has turned bearish. Rallies back up to the 200 SMA often produce Bearish Engulfing patterns as the most significant moving average in global finance provides resistance. A Bearish Engulfing pattern forming right at that moving average is a high-probability short entry signal. This setup aligns the short-term pattern with the longer-term trend direction, stacking probabilities in your favour. Stop above the moving average, target the prior swing low.
Setup conditions:
- Stock in a downtrend (lower highs and lower lows on the daily chart)
- Price rallies (corrects upward) toward the 20 EMA or 200 SMA
- A Bearish Engulfing forms at the moving average
- Volume on Day 2 is above the 20-day average
- RSI has risen to 50–60 range (not overbought — confirming this is a correction within a downtrend, not a reversal)
Entry: At the close of Day 2 (the Bearish Engulfing)
Stop: Above Day 2's high AND above the moving average. If price closes above the moving average, the downtrend structure has been challenged and the thesis is invalidated.
Target: The most recent swing low below — and if the downtrend continues, consider trailing the stop behind each new lower high for extended moves.
| Moving Average | Trend Context | Signal Strength | Frequency |
|---|---|---|---|
| 20 EMA | Short-term downtrend pullback | High in strong downtrends | Very frequent |
| 50 SMA | Medium-term downtrend pullback | Very High | Moderate |
| 200 SMA | Major long-term reversal | Maximum | Rare but powerful |
Part 6: Stop Loss and Target — The Complete Rules
Stop Loss Placement
The universal Bearish Engulfing stop loss rule: Place your stop loss above Day 2's high (the engulfing candle's session high), with a 0.2–0.3% buffer.
Stop loss: just above the engulfing candle's high (the rejection wick). This is the invalidation point.
Why above Day 2's high specifically:
Day 2 represents the complete seller takeover session. If price subsequently rises back above Day 2's high — above even the opening level of the session where sellers dominated — the seller takeover has been completely negated. Buyers have recovered everything sellers achieved during the Bearish Engulfing session. The thesis is wrong. Exit.
A stop placed anywhere below Day 2's high (inside the pattern) can be triggered by normal price oscillation within the established pattern, not by genuine reversal. The Day 2 high is the only logically correct stop level.
Buffer sizing for Indian stocks:
- Large-cap NSE stocks (₹500+ price): 0.2–0.3% above Day 2's high
- Mid-cap stocks: 0.3–0.5% above
- Intraday 5-minute chart: 0.3–0.5% of stock price above the engulfing candle's high
Target Setting Rules
Primary target: The previous swing low below — the level from which the current uptrend began. This is the first significant support where buyers are likely to step back in.
Secondary target: Beyond the primary swing low, the next significant support or the origin of the entire rally preceding the Bearish Engulfing.
Minimum risk-reward: 2:1. If the distance from entry to stop is ₹25, the primary target must be at least ₹50 below entry. If the math doesn't work — if support is too close — skip the setup.
Scale-out approach:
- At 1:1 (risk covered): Close 25–30% of position, move stop to breakeven
- At 2:1 (primary target): Close another 40–50%
- Let remaining 20–25% run with trailing stop above each new lower high
Know your exact share count and maximum loss before entering any Bearish Engulfing short. Use the Dhanith Risk Management Calculator — enter your stop distance and account size to calculate your position size instantly.
Part 7: Bearish Engulfing vs. Related Patterns
Bearish Engulfing vs. Bullish Engulfing
| Feature | Bearish Engulfing | Bullish Engulfing |
|---|---|---|
| Prior trend | Uptrend | Downtrend |
| Day 1 candle | Bullish (green) | Bearish (red) |
| Day 2 candle | Bearish (red) | Bullish (green) |
| Day 2 engulfs | Day 1's bullish body | Day 1's bearish body |
| Signal | Bearish reversal | Bullish reversal |
| Location | At resistance | At support |
| Stop | Above Day 2's high | Below Day 2's low |
| Win rate | 57–65% with filters | 53–65% with filters |
Both patterns share the identical two-candle complete engulfment structure — they are perfect mirror images applied in opposite trend contexts. Mastering one makes the other immediately intuitive.
Bearish Engulfing vs. Dark Cloud Cover
The Dark Cloud Cover is the Bearish Engulfing's close relative. Both are two-candle bearish reversal patterns appearing after uptrends. The critical difference is the degree of engulfment:
| Feature | Bearish Engulfing | Dark Cloud Cover |
|---|---|---|
| Day 2 close | Below Day 1's open (100% engulfment) | Below Day 1's midpoint (50%+ penetration) |
| Engulfment requirement | Full body engulfment | At least 50% body penetration |
| Signal strength | Stronger | Strong but less decisive |
The Bearish Engulfing requires complete engulfment. The Dark Cloud Cover requires only that Day 2 closes below the midpoint of Day 1's body. If a pattern barely fails the full engulfment test but closes below the Day 1 midpoint — that is a Dark Cloud Cover, not a failed Bearish Engulfing.
Bearish Engulfing vs. Bearish Harami
| Feature | Bearish Engulfing | Bearish Harami |
|---|---|---|
| Relative candle size | Day 2 LARGER than Day 1 | Day 2 SMALLER than Day 1 |
| Containment | Day 2 engulfs Day 1 | Day 1 "contains" Day 2 |
| Signal strength | Strong — decisive seller takeover | Weak — only a pause in buying |
| Confirmation | Day 2 close is sufficient | Requires Day 3 confirmation |
The Harami is the opposite of the Engulfing in structure — in the Harami, the bigger candle is Day 1 and Day 2 is contained inside it. The Harami signals uncertainty; the Engulfing signals decisive seller control.
Part 8: Bearish Engulfing on Different Timeframes
Daily Chart — Primary Application
The daily Bearish Engulfing at resistance is the standard use case for most swing traders and position traders. The full-session battle means genuine institutional participation, clear body-to-body identification, and reliable volume data.
For NSE swing traders, a daily Bearish Engulfing at a key resistance level with RSI above 65 and above-average volume is a primary entry signal for a short trade or a long position exit.
Weekly Chart — Maximum Institutional Weight
A weekly Bearish Engulfing represents five full trading days of seller dominance. When the week's candle opens above the prior week's close and closes below the prior week's open — reversing an entire week's worth of gains — the signal carries enormous weight from multiple trading sessions of confirmed seller control.
Weekly Bearish Engulfing patterns at prior resistance zones or multi-year highs often mark the beginning of multi-week or multi-month downtrends. These are relatively rare (appearing perhaps 4–8 times per year on a given stock) but carry maximum weight when they appear.
5-Minute and 15-Minute Chart — Intraday NSE Application
For Indian intraday traders, the Bearish Engulfing on the 5-minute chart works best during two specific windows:
9:30–11:00 AM (Post-opening manipulation): After the opening Judas Swing completes on a bearish session, the Bearish Engulfing at VWAP resistance provides the short entry for the AMD distribution phase. The 5-minute chart shows the pattern as price rallies back to VWAP from below and forms a Bearish Engulfing at the VWAP level — Day 1 pushes above VWAP briefly, Day 2 engulfs it and closes back below VWAP.
2:30–3:15 PM (Closing session): After the midday lull, a Bearish Engulfing at the day's established resistance or at VWAP provides a second short entry opportunity in the afternoon session.
Intraday checklist: Same requirements (prior rally, complete engulfment, above-average volume) but require volume at least 1.5× the session average. Apply RSI above 60 as confirmation on the 5-minute chart for maximum reliability.
Looking for NSE stocks where Bearish Engulfing setups are forming at VWAP resistance today? The Dhanith Intraday Screener pre-filters high-momentum stocks so you spend your time trading the setup — not scanning for it.
Part 9: Common Bearish Engulfing Mistakes and Exact Fixes
Mistake 1 — Trading in an Established Bull Market
Taking every Bearish Engulfing short in a strongly trending bull market where the primary trend is decisively upward and every "reversal" is simply a brief pullback before the uptrend resumes.
The fix: Apply the primary trend filter before any Bearish Engulfing short. Is price above the 200 SMA? Above the 50 SMA? If yes, the primary trend is bullish and Bearish Engulfing patterns are lower-probability counter-trend shorts. In a bull market, Bearish Engulfing at resistance is more likely a pullback entry opportunity for longs than a genuine reversal. Reserve short trades for stocks in confirmed downtrends (below 200 SMA, making lower highs and lower lows).
Mistake 2 — Incomplete Engulfment
Entering on a "near-Bearish Engulfing" where Day 2 closes above Day 1's open — the engulfment is not complete. It may look visually similar but represents a structurally different (weaker) pattern.
The fix: Day 2 must close at or below Day 1's open. No exceptions. A pattern that penetrates 80% of Day 1's body is a Dark Cloud Cover — valid but traded with its own rules, not the Engulfing's rules.
Mistake 3 — Ignoring Volume
Entering on a visually perfect Bearish Engulfing on below-average volume. The institutional selling conviction is absent — the pattern represents retail noise, not genuine reversal.
The fix: Day 2's volume must be noticeably above the 20-period average. Ideally 1.5× to 2× above. Below-average volume Bearish Engulfing patterns fail at significantly higher rates. If volume is below average — skip the setup or dramatically reduce position size.
Mistake 4 — Stop Loss Inside the Pattern
Stop placed at the bottom of Day 1 (inside the two-candle pattern range) instead of above Day 2's high. Normal upward retracement within a developing downtrend triggers the stop before the trade has time to develop.
The fix: Stop above Day 2's high — the engulfing candle's session high — with a small buffer. This is the only logically valid stop placement. If price rises above this level, the seller takeover has been reversed and the position must be exited.
Mistake 5 — Not Confirming with at Least One Indicator
Entering every Bearish Engulfing purely on visual identification without checking RSI, volume, or the broader trend context. The 57% base win rate in isolation means 43 losses for every 57 wins — barely tradeable without the filters that raise it to 65–73%.
The fix: Require at least two of the three confirmation filters: (1) prior uptrend of 5+ sessions, (2) above-average volume on Day 2, and (3) RSI above 60 (ideally above 70) at the time of the pattern. With two of three, the probability is meaningfully improved. With all three, the setup approaches Grade A.
Mistake 6 — Setting the Target Too Conservatively
Targeting just 1:1 risk-reward on a Bearish Engulfing that appears at a major resistance after a 15-session rally — a setup with clear 3:1+ potential.
The fix: Measure the entire potential downside move from the Bearish Engulfing to the next significant support. If the pattern forms at ₹500 and support is at ₹440 (₹60 potential profit) with a stop at ₹510 (₹10 risk), the natural risk-reward is 6:1. Scale partially out at 2:1 and 3:1, letting a portion run to the full support target. Never compress the target to achieve a conservative "safe" 1:1 when the setup naturally offers far more.
FAQ
Q: What is a Bearish Engulfing pattern? A Bearish Engulfing pattern is a two-candle bearish reversal formation that appears after an uptrend. Day 1 is a bullish candle confirming the uptrend. Day 2 is a larger bearish candle whose body completely engulfs Day 1's body — opening at or above Day 1's close and closing at or below Day 1's open. It signals that sellers have overwhelmed buyers so decisively in a single session that the entire prior session's gain has been erased and extended. It is most reliable at resistance levels with above-average volume on Day 2.
Q: What is the win rate of the Bearish Engulfing pattern? Research by Liberated Stock Trader puts the daily timeframe win rate at approximately 57% when traded in isolation. With confluence filters — key resistance level, RSI above 70 (overbought), and above-average volume on Day 2 — the win rate rises to 65–73%. Gate.io's 2026 backtesting found RSI + MACD combinations with bearish engulfing patterns produce 73–77% win rates. The base pattern alone is modest; context and confirmation are what create the genuine trading edge.
Q: What is the difference between Bearish Engulfing and Bullish Engulfing? Both involve complete body engulfment between two candles, but in opposite trend contexts. Bearish Engulfing appears after an uptrend — Day 1 is bullish, Day 2 is bearish and engulfs Day 1 — signalling a bearish reversal. Bullish Engulfing appears after a downtrend — Day 1 is bearish, Day 2 is bullish and engulfs Day 1 — signalling a bullish reversal. They are perfect mirror images of each other.
Q: Where should the stop loss be on a Bearish Engulfing trade? Above Day 2's high — the engulfing candle's session high — with a 0.2–0.3% buffer for large-cap stocks. Day 2's high is the absolute invalidation point: if price rises back above the engulfing candle's highest point, sellers have been completely overwhelmed and the reversal has failed. Never place the stop inside the pattern (between the two candles) as normal upward price movement within a developing reversal will trigger it prematurely.
Q: Is the Bearish Engulfing pattern good for shorting NSE stocks? Yes — the Bearish Engulfing at resistance is one of the cleanest short entry signals for NSE stocks and Bank Nifty futures. On the daily chart, look for the pattern at prior swing highs, round numbers, and previous resistance zones during the stock's rally. For intraday trading, the 5-minute Bearish Engulfing at VWAP (when price is above VWAP and pulls back to form the pattern) provides a short entry signal during the 9:30–11:00 AM session. Always confirm with volume above the session average.
Q: How do I tell a Bearish Engulfing from a Dark Cloud Cover? Both are two-candle bearish reversal patterns after uptrends. The difference is the degree of Day 2 penetration into Day 1's body. In a Bearish Engulfing, Day 2 closes at or below Day 1's open — complete body engulfment (100% penetration). In a Dark Cloud Cover, Day 2 closes below Day 1's midpoint but above Day 1's open — at least 50% penetration but not full engulfment. Bearish Engulfing is stronger because the seller takeover is more complete. If a pattern meets the 50% threshold but not the full engulfment — it is a Dark Cloud Cover, not a Bearish Engulfing.
Conclusion
The Bearish Engulfing pattern is one of the most visually clear and psychologically meaningful signals in technical analysis. When it forms at the right location, with the right volume, after the right trend — the story it tells is unambiguous: buyers were winning yesterday; sellers crushed them today.
That clarity — the complete, visible, single-session seller takeover — is what makes the Bearish Engulfing a pattern worth mastering. Not because it is infallible (57% base win rate in isolation is a reminder that no pattern is), but because when combined with resistance, overbought indicators, and volume confirmation, it becomes a reliable, repeatable, statistically valid short entry signal.
Three principles to carry into every Bearish Engulfing trade:
1. Location creates the edge. A Bearish Engulfing at a well-established resistance level, where price has reversed multiple times before, carries dramatically more weight than the same pattern in mid-range. The resistance provides the structural reason; the Engulfing provides the timing.
2. Volume validates the signal. Below-average volume patterns fail significantly more often. Make volume confirmation a hard requirement — not a "nice to have." The selling conviction must show up in the data.
3. Indicators confirm what the pattern implies. RSI above 70, MACD crossover, bearish divergence, upper Bollinger Band touch — each independent confirmation raises probability. With two or three indicators aligned with the pattern, you move from a 57% signal toward a 70%+ setup.
Master the Bearish Engulfing at resistance with RSI confirmation first. Trade it consistently for 30 sessions. Journal every outcome. Then add the MACD and Bollinger Band variations. Build the system one confirmed layer at a time.
Further reading: Bearish Candle Anatomy: How to Read a Bearish Candlestick | Bullish Candle Anatomy: How to Read a Bullish Candlestick | Bullish Engulfing Pattern: Complete Trading Guide | Important Candlestick Patterns: The Complete Guide | RSI Trading Strategy: Complete Guide | Support and Resistance: The Complete Trading Guide | Volume Analysis Trading Strategy | Bollinger Bands Trading Strategy | Hammer Candlestick Pattern: Complete Trading Guide | Shooting Star Candlestick Pattern: Complete Trading Guide | Morning Star Candlestick Pattern: Complete Trading Guide | How to Trade Intraday Stocks in India | Dhanith Intraday Screener | Technical Analysis Mastery: The Complete Guide | Smart Money Concepts: The Complete Mastery Guide | 5 Best Intraday Trading Strategies for NSE India
Ready to Trade the Bearish Engulfing on Real Stocks?
→ Open the Dhanith Intraday Screener — find today's NSE stocks where Bearish Engulfing setups are forming at VWAP and key resistance levels
→ Calculate Your Position Size Before Every Short Trade — know your exact share count, stop distance, and maximum loss before entering
→ Log Every Bearish Engulfing Trade in the Dhanith Journal — track which configurations produce the best results across different market conditions
Disclaimer: This article is for educational purposes only and does not constitute financial or investment advice. Trading in stocks and financial markets involves significant risk of capital loss. Past performance of any pattern does not guarantee future results. Always use proper risk management and stop losses.
Have a question about this article?
Comment on our latest Instagram post or send us a DM — we reply to every one.
@dhanith_officialWas this article helpful?
Click to rate
Founder, Dhanith Trading
7+ years trading Nifty, Bank Nifty, NSE stocks, and commodities — specializing in Smart Money Concepts (SMC) and ICT price action. Founder of Dhanith — a trading journal, intraday screener, and risk tools platform built for retail traders.
Dhanith Newsletter
Enjoyed this article? Get more like it.
New trading guides, candlestick patterns, SMC strategies, and tool updates — straight to your inbox. Free, for Indian traders.
No spam. Unsubscribe anytime.
Continue Reading