On this page
- Where to Find the Option Chain
- The Anatomy of an Option Chain
- Understanding Each Column in the Option Chain
- OI — Open Interest (The Most Important Column)
- Change in OI — The Real, Live Signal
- LTP — Last Traded Price
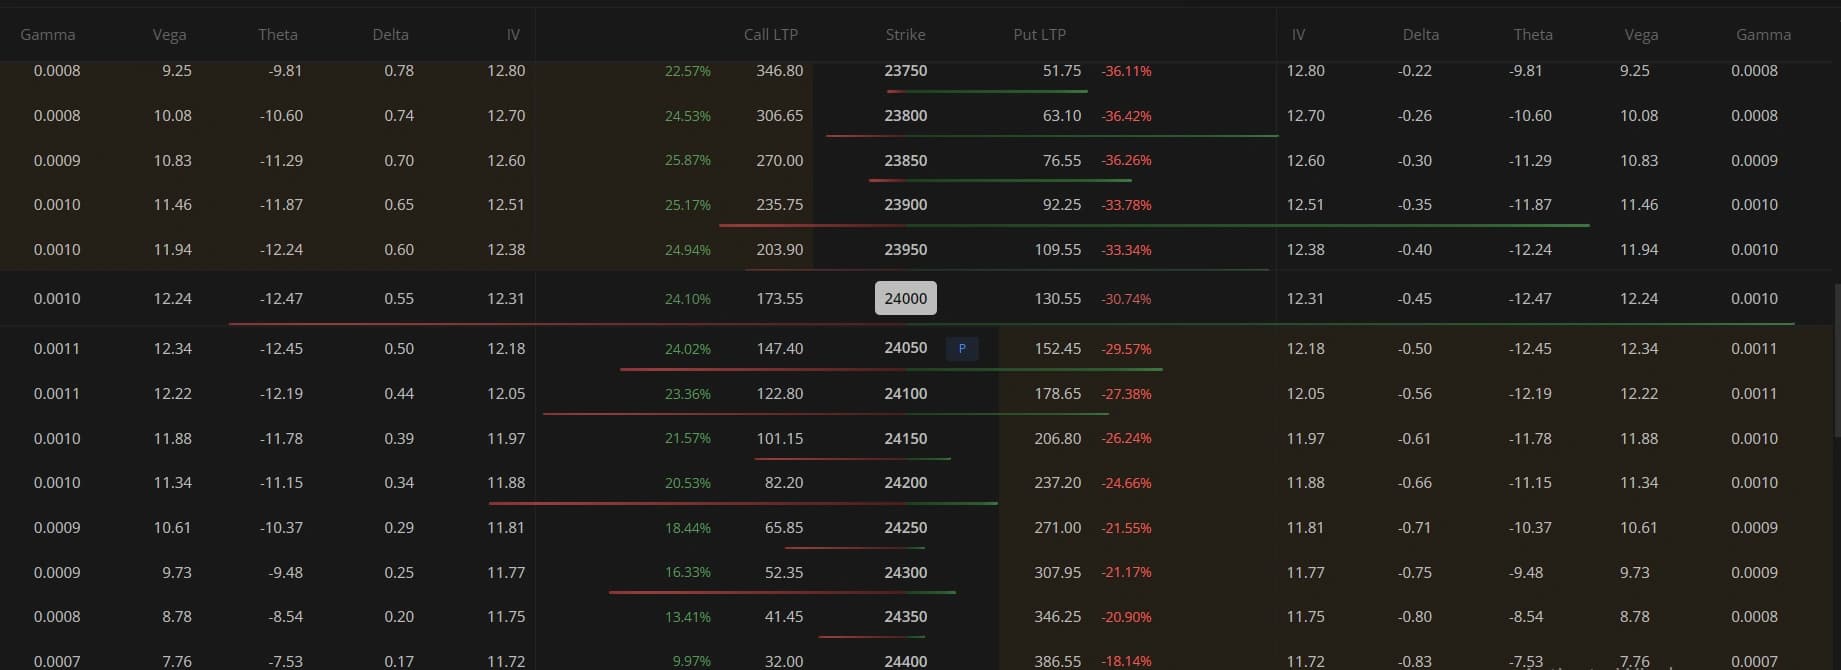
- IV — Implied Volatility
- The 3 Most Important Signals to Read in an Option Chain
- 1. Max Pain — The Expiry Magnet
- 2. PCR — Put Call Ratio
- 3. Support and Resistance From Open Interest
- Real-Time Option Chain Reading: What to Watch During Market Hours
- Combining Option Chain Analysis With Smart Money Concepts (SMC)
- Indian Market-Specific Rules to Remember While Trading Options
- Quick Cheat Sheet for Option Chain Analysis
- Homework: Practice Option Chain Reading Daily
- FAQ
- Conclusion
- Ready to Practice Option Chain Reading?

How to Analyse Option Chain: Complete NSE Guide (2026)
Learn how to analyse option chain data — OI, Change in OI, PCR, Max Pain — to find support, resistance, and high-probability Nifty trades.
Har trader ne kabhi na kabhi Option Chain khola hoga, sirf numbers ka ek bada sa table dekha hoga, aur confuse hokar band kar diya hoga. Lekin yahi table — agar aap how to analyse option chain properly samajh jaayein — is the most powerful free tool available to every retail trader in India. Once you learn to read it correctly, you can actually see where the big money — FIIs and DIIs — is positioned, and use that information to build genuinely high-probability trades.
This guide breaks down option chain analysis from scratch: where to find it, how to read every column, the three most important signals to track (Max Pain, PCR, and OI-based support/resistance), and exactly how to combine option chain reading with price action for sharper entries. Whether you trade Nifty, Bank Nifty, or individual stocks, this is one skill that compounds in value the more consistently you practice it.
Where to Find the Option Chain
You don't need any paid subscription to start reading option chain data — the official source is completely free.
- NSE Official: nseindia.com → Derivatives → Option Chain
- Better, more visual tools: Sensibull and Opstra, both of which present the same underlying data in a more readable, chart-friendly format
For beginners specifically learning option chain analysis for Nifty, starting with the NSE website directly is useful because it forces you to understand the raw data before relying on a tool that simplifies it for you.
The Anatomy of an Option Chain
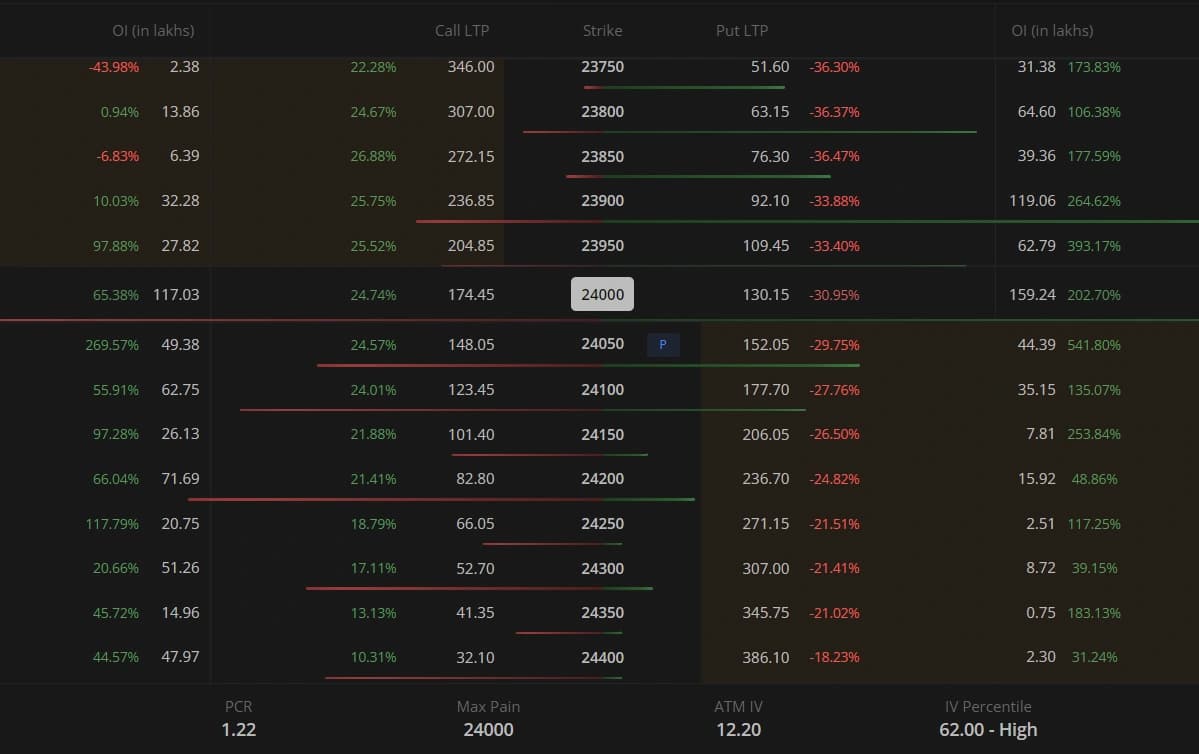
At first glance, an option chain looks intimidating — rows and rows of numbers split into two mirrored halves. But the structure is actually simple once you know what you're looking at: Call (CE) data on the left, Put (PE) data on the right, and the strike price connecting both in the middle.
| CE OI | CE Chng OI | CE LTP | CE IV | Strike | PE IV | PE LTP | PE Chng OI | PE OI |
|---|---|---|---|---|---|---|---|---|
| 2.1L | +45K | 245 | 14% | 23,500 | 28% | 18 | -12K | 3.8L |
| 1.8L | +30K | 180 | 13% | 23,600 | 27% | 24 | -8K | 3.2L |
| 4.5L | -20K | 120 | 12% | 23,700 — Support | 26% | 35 | +40K | 5.1L |
| 1.2L | +15K | 80 | 12% | 23,800 | 15% | 55 | +10K | 1.1L |
| 0.8L | +55K | 50 | 11% | 23,900 | 14% | 75 | +5K | 0.9L |
| 0.5L | +80K | 30 | 11% | 24,000 — ATM | 13% | 105 | +65K | 2.3L |
| 6.2L | +120K | 18 | 12% | 24,100 — Resistance | 12% | 140 | -15K | 0.7L |
| 0.3L | +10K | 10 | 13% | 24,200 | 13% | 195 | -5K | 0.5L |
| 0.2L | +5K | 5 | 14% | 24,300 | 14% | 260 | +8K | 0.4L |
| 0.1L | +2K | 2 | 15% | 24,400 | 15% | 340 | +2K | 0.2L |
Everything in this guide is about understanding what these columns are actually telling you — not just glancing at the numbers.
Understanding Each Column in the Option Chain
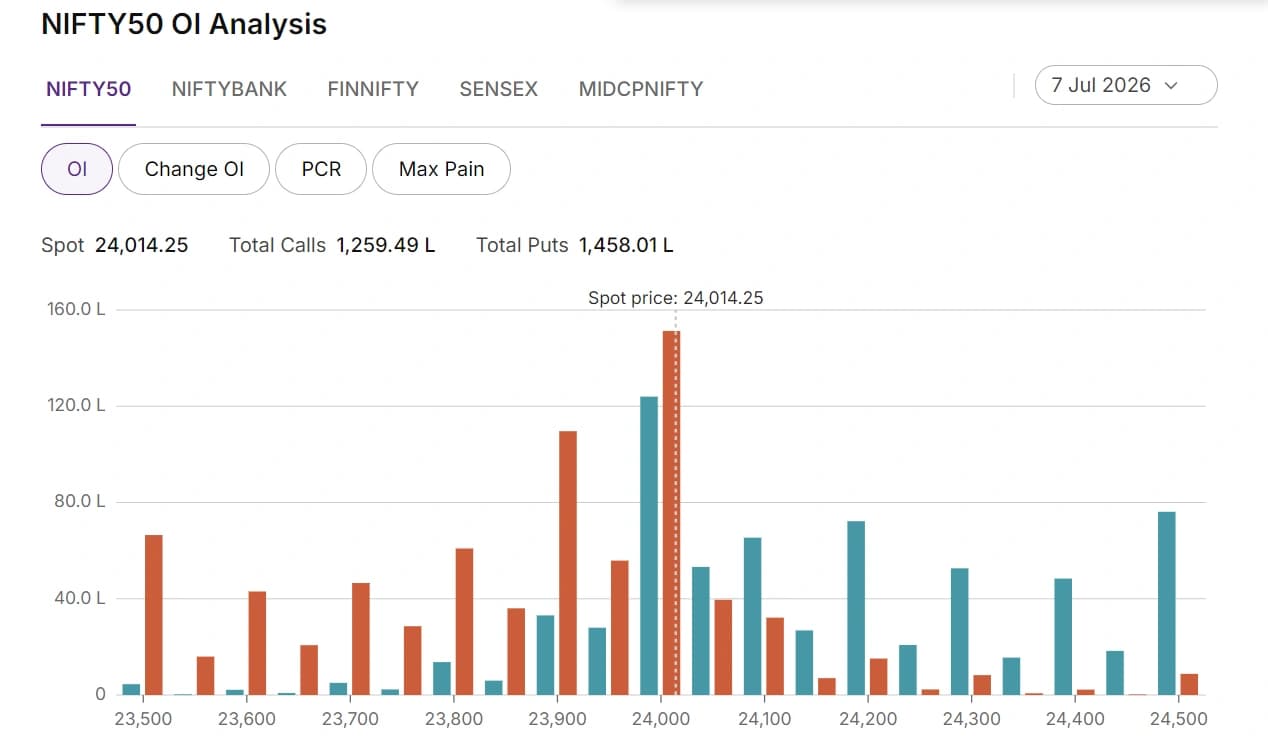
OI — Open Interest (The Most Important Column)
Open Interest represents the number of open, active contracts at that specific strike price. Think of OI as the number of "bets" placed at that price level by large market participants — the higher the OI, the more conviction (and capital) is sitting at that strike.
| Where OI Is High | What It Generally Means |
|---|---|
| High CE OI at a strike | Big players have sold calls there — acts as Resistance |
| High PE OI at a strike | Big players have sold puts there — acts as Support |
This single relationship — high CE OI marking resistance, high PE OI marking support — is the foundation of almost everything else covered in this guide.
Change in OI — The Real, Live Signal
Open Interest alone tells you where positions already exist. Change in OI tells you something more valuable: whether positions are actively being added or exited today, in real time.
| Change in OI | What's Happening in the Market |
|---|---|
| CE OI increasing | Fresh call selling — resistance is getting stronger |
| CE OI decreasing | Call sellers are exiting — resistance is weakening |
| PE OI increasing | Fresh put selling — support is getting stronger |
| PE OI decreasing | Put sellers are exiting — support is weakening |
This is the column experienced traders watch most closely intraday, because it shows you conviction building or fading in real time — far more useful for a same-day trading decision than the static OI number alone.
LTP — Last Traded Price
LTP is simply the current premium of that specific option contract.
- ATM (At The Money) options typically carry the highest premium relative to their strike
- OTM (Out of The Money) options are cheaper, but carry higher risk of expiring worthless
- Watching LTP movement in real time also gives you a sense of momentum building at specific strikes
IV — Implied Volatility
Implied Volatility tells you how expensive an option is relative to the underlying's recent historical movement — essentially, how much "fear" or "expected movement" is priced into the premium.
| IV Reading | What It Suggests | What Traders Often Do |
|---|---|---|
| IV very HIGH | Options are relatively overpriced | Often a better time to consider selling premium |
| IV very LOW | Options are relatively cheap | Often a better time to consider buying |
| IV spikes suddenly | A big event or uncertainty is expected | The market is signaling elevated risk |
India VIX is Nifty's specific "fear index," and it's worth tracking alongside individual strike IV. As a general guide, India VIX above 20 typically means options are expensive across the board, while VIX below 12 typically signals comparatively cheap options.
The 3 Most Important Signals to Read in an Option Chain
Once you understand the individual columns, the real skill in option chain analysis comes from combining them into three specific, repeatable signals.
1. Max Pain — The Expiry Magnet
Max Pain is the strike price at which option buyers, as a group, lose the most money at expiry. The market has a documented tendency to gravitate toward the Max Pain level on expiry day, largely because option sellers — typically large institutions — have a financial incentive to defend that exact level.
Where to find it: Opstra offers a free Max Pain calculator that does this calculation for you automatically.
A practical example: if Max Pain for Nifty is calculated at 24,000, the market is statistically more likely to close near 24,000 on expiry Tuesday (Nifty weekly). At that level, both 24,000 CE and 24,000 PE buyers lose the maximum possible amount, while option sellers profit the most — which is exactly why this level tends to act like a magnet as expiry approaches.
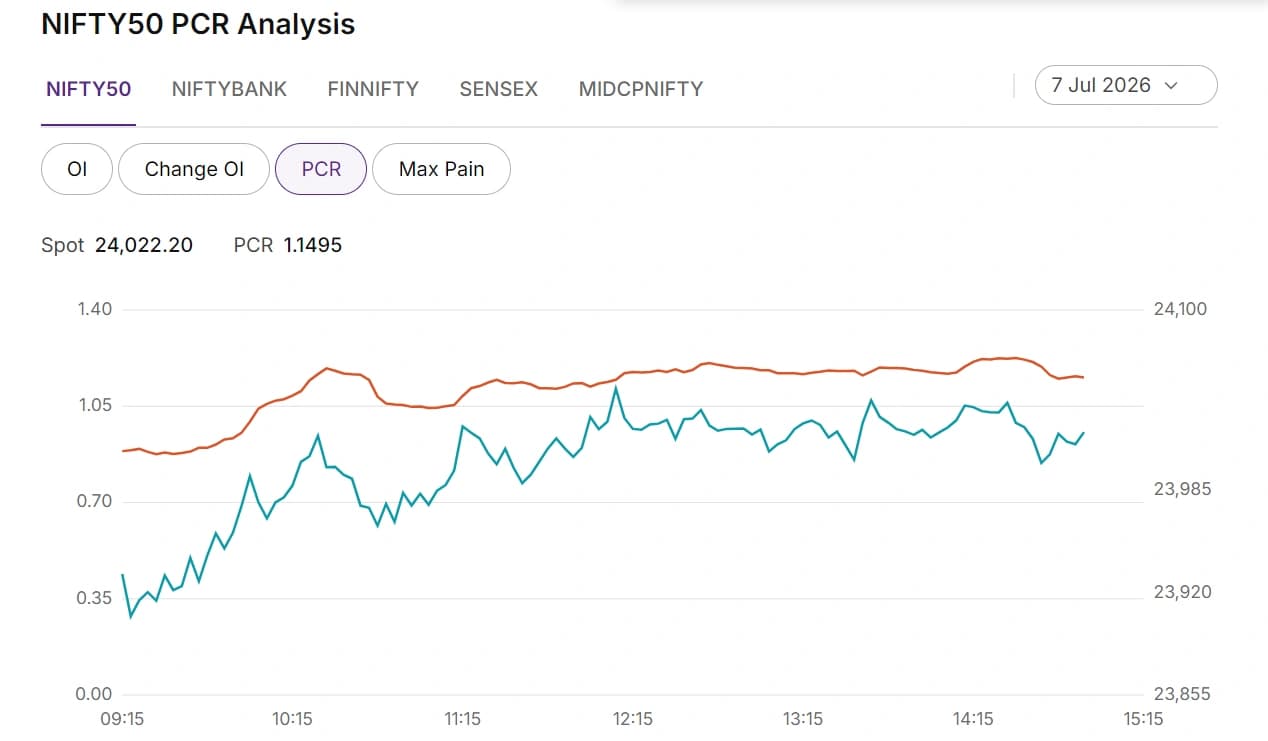
2. PCR — Put Call Ratio
Formula: PCR = Total PE Open Interest ÷ Total CE Open Interest
| PCR Value | Market Sentiment | What It Suggests |
|---|---|---|
| PCR > 1.2 | Bullish | More puts have been sold — the market is being supported |
| PCR < 0.8 | Bearish | More calls have been sold — the market is being capped |
| PCR ≈ 1.0 | Neutral | Roughly balanced positioning on both sides |
| PCR > 1.5 | Extremely bullish | Often treated as a contrarian sell signal |
| PCR < 0.5 | Extremely bearish | Often treated as a contrarian buy signal |
This last point is genuinely important and frequently misunderstood: PCR is a contrarian indicator at its extremes. When PCR readings become unusually high or unusually low, it often signals that sentiment has become one-sided enough that a reversal becomes more likely — rather than simply confirming the existing trend will continue indefinitely.
3. Support and Resistance From Open Interest
This is where how to read option chain for support and resistance becomes a practical, step-by-step process — and it's also exactly how SMC/ICT-style traders combine option chain data with price action analysis.
STEP 1: Find the strike with the highest PE OI → this is your KEY SUPPORT
STEP 2: Find the strike with the highest CE OI → this is your KEY RESISTANCE
STEP 3: These two levels become your trade boundaries for the week
A real worked example:
Highest PE OI is at 23,700 → this becomes your support zone
Highest CE OI is at 24,100 → this becomes your resistance zone
Current Nifty price: 23,980

Interpretation:
- The market is likely to stay within the 23,700-24,100 range this week
- A long CE position near 23,700 support could play a bullish bounce
- A long PE position near 24,100 resistance could play a bearish rejection
- A Short Strangle (selling 23,700 PE + selling 24,100 CE) could suit a range-bound view
This three-step method is, in practice, the single most useful application of option chain data for traders trying to define a weekly trading range before the market even opens.
Real-Time Option Chain Reading: What to Watch During Market Hours
Reading the option chain isn't a one-time, start-of-day activity — the most useful signals come from watching how it evolves throughout the session.
| Time | What to Check |
|---|---|
| 9:15 AM | Check the OI buildup at key strikes and set your levels for the day |
| 10:00 AM | Watch Change in OI closely — are fresh positions being added? |
| 1:00 PM | Mid-day check — is there any OI unwinding? This can signal an early reversal |
| 2:30 PM | On expiry day specifically, watch the Max Pain level closely |
| 3:15 PM | Close all positions — this is the critical STT trap cutoff (covered below) |
Building this routine into your trading day — even on days you don't plan to trade — is one of the fastest ways to genuinely internalize how option chain data behaves in live market conditions, rather than only in theory.
Combining Option Chain Analysis With Smart Money Concepts (SMC)
For traders already familiar with SMC/ICT price action concepts, option chain data adds a powerful second layer of confirmation — and this combination is genuinely one of the more sophisticated, high-probability approaches available to retail traders.
| Option Chain Signal | SMC Confirmation | Resulting Trade Idea |
|---|---|---|
| High PE OI at 23,700 | A demand zone or Fair Value Gap also sitting at 23,700 | A strong bullish signal near that confluence level |
| High CE OI at 24,100 | A supply zone or bearish order block also at 24,100 | A strong bearish or PE-buying signal |
| CE OI unwinding rapidly | A Break of Structure (BOS) to the upside on the chart | Breakout confirmed — bullish momentum trade |
| Sudden PE OI addition | Price visibly rejecting at a resistance level | Active sellers — a PE buying opportunity |
The core principle here is simple but powerful: when option chain OI data aligns with your existing SMC structure, that confluence represents your highest-probability trade setup. Neither signal alone is as reliable as the two together — option chain data tells you where large capital is positioned, while price action structure tells you how price is actually behaving at that exact level.
Indian Market-Specific Rules to Remember While Trading Options
While this guide focuses specifically on option chain analysis, a few India-specific rules are worth repeating, since they directly affect how you should act on the signals above:
- Settlement: options on NSE are cash settled — there is no physical delivery, even for ITM contracts at expiry
- The STT trap: holding an ITM option until expiry without squaring it off can trigger an unexpectedly high Securities Transaction Tax. Always close ITM positions before 3:15 PM on expiry day rather than letting them auto-exercise
- Margin requirements: selling options based on the support/resistance levels identified through OI analysis requires SPAN plus Exposure margin, often ₹1–2 lakh or more per lot depending on the underlying
Quick Cheat Sheet for Option Chain Analysis
HIGH CE OI       →   Resistance / Cap on upside
HIGH PE OI       →   Support / Floor on downside
CE OI adding     →   Sellers active, market may struggle to rise
PE OI adding     →   Buyers protected, dips likely to be bought
PCR rising       →   Market sentiment getting more bullish
PCR falling      →   Market sentiment getting more bearish
Max Pain         →   The level price tends to gravitate toward at expiry
IV rising        →   Fear building, a bigger move may be expected
IV falling       →   Market calming down, premium selling more favorable
Keep this cheat sheet visible while you're learning — over time, you won't need to consciously reference it, because the relationships between OI, Change in OI, and price behavior will become intuitive.
Homework: Practice Option Chain Reading Daily
Reading about option chain analysis is not the same as actually being able to do it under live market conditions. Here's a simple daily practice routine:
- Open the NSE Option Chain for Nifty every morning at 9:20 AM
- Note down the highest CE OI strike and the highest PE OI strike
- Calculate the PCR manually using the formula above
- Write down your interpreted support and resistance levels for the day
- Observe how price actually respects (or breaks) these levels by end of day
- Log everything in your trading journal, including whether your read was accurate
Do this for 21 days without placing a single trade — purely observing and recording. By the end of this period, the patterns in how OI, PCR, and price interact will start becoming genuinely clear, rather than feeling like abstract numbers on a screen.
FAQ
Q: How do you analyse an option chain for Nifty? Start by identifying the strike with the highest Call (CE) Open Interest, which generally marks resistance, and the strike with the highest Put (PE) Open Interest, which generally marks support. Then check the Put Call Ratio (PCR) for overall sentiment, and the Max Pain level for where price may gravitate toward at expiry. Watching Change in OI throughout the day tells you whether these levels are strengthening or weakening in real time.
Q: What does high Open Interest mean in an option chain? High Open Interest at a specific strike means a large number of contracts remain open at that level, generally indicating significant institutional positioning. High Call OI typically acts as resistance, while high Put OI typically acts as support, since these levels represent where large sellers have written options and have an incentive to defend that price.
Q: What is a good PCR (Put Call Ratio) value? A PCR around 1.0 suggests neutral, balanced sentiment. A PCR above 1.2 generally suggests bullish positioning, while a PCR below 0.8 suggests bearish positioning. However, PCR is considered a contrarian indicator at extremes — readings above 1.5 or below 0.5 are often treated as potential reversal signals rather than simple trend confirmation.
Q: What is Max Pain in option chain analysis? Max Pain is the strike price at which option buyers, collectively, lose the most money at expiry. The market often gravitates toward this level on expiry day, since large option sellers benefit when price settles near it. Tools like Opstra offer free Max Pain calculators based on live option chain data.
Q: Can option chain analysis be combined with technical analysis? Yes — combining option chain signals (such as high OI strikes) with technical price action concepts like support/resistance zones, demand and supply zones, or Smart Money Concepts (SMC) structures often produces higher-probability setups than either method used alone. When an OI-based level aligns with a technical confluence zone on the chart, that overlap is generally considered a stronger signal.
Conclusion
Learning how to analyse option chain data is, in many ways, learning to see the market through the eyes of the large institutional players actually moving it. The columns themselves — OI, Change in OI, LTP, IV — are simple once explained, but the real skill comes from synthesizing them into the three core signals covered here: Max Pain, PCR, and OI-based support and resistance.
This isn't a skill that develops overnight. It comes from the same discipline that defines every other part of serious trading: consistent daily observation, careful logging, and an honest review of whether your reads were actually correct. Treat the 21-day homework exercise above seriously, and option chain reading will go from feeling like a wall of confusing numbers to one of the most reliable tools in your entire trading process.
Further reading: What Is Options Trading? A Complete Beginner's Guide | Best Online Trading Journal: Why Serious Traders Track Every Trade | AMD Trading Strategy for NY Open | Support and Resistance: The Complete Trading Guide
Ready to Practice Option Chain Reading?
→ Log Your Daily Option Chain Reads in the Dhanith Journal — track your interpreted support/resistance, PCR, and Max Pain calls against what actually happened
→ Calculate Your Risk Before Every Options Trade — know your exact premium outlay, lot size cost, and maximum loss before you enter
Disclaimer: This blog is for educational purposes only and is not investment advice. Options trading involves substantial risk, and more than 90% of retail F&O traders lose money, as per a SEBI study. Always paper trade first, use only risk capital, and never trade without a clearly defined stop loss.
Was this article helpful?
Click to rate
Trader & Founder, Dhanith Trading
Full-time trader focused on price action, Smart Money Concepts, and intraday strategies for Indian markets. Founder of Dhanith — a trading journal, intraday screener, and risk tools platform built for retail traders.
Dhanith Newsletter
Enjoyed this article? Get more like it.
New trading guides, candlestick patterns, SMC strategies, and tool updates — straight to your inbox. Free, for Indian traders.
No spam. Unsubscribe anytime.
Continue Reading