On this page
- Introduction
- What Is a Bearish Candle?
- The Anatomy of a Bearish Candle
- 1. Open
- 2. Close
- 3. High
- 4. Low
- 5. Real Body
- 6. Upper and Lower Wicks
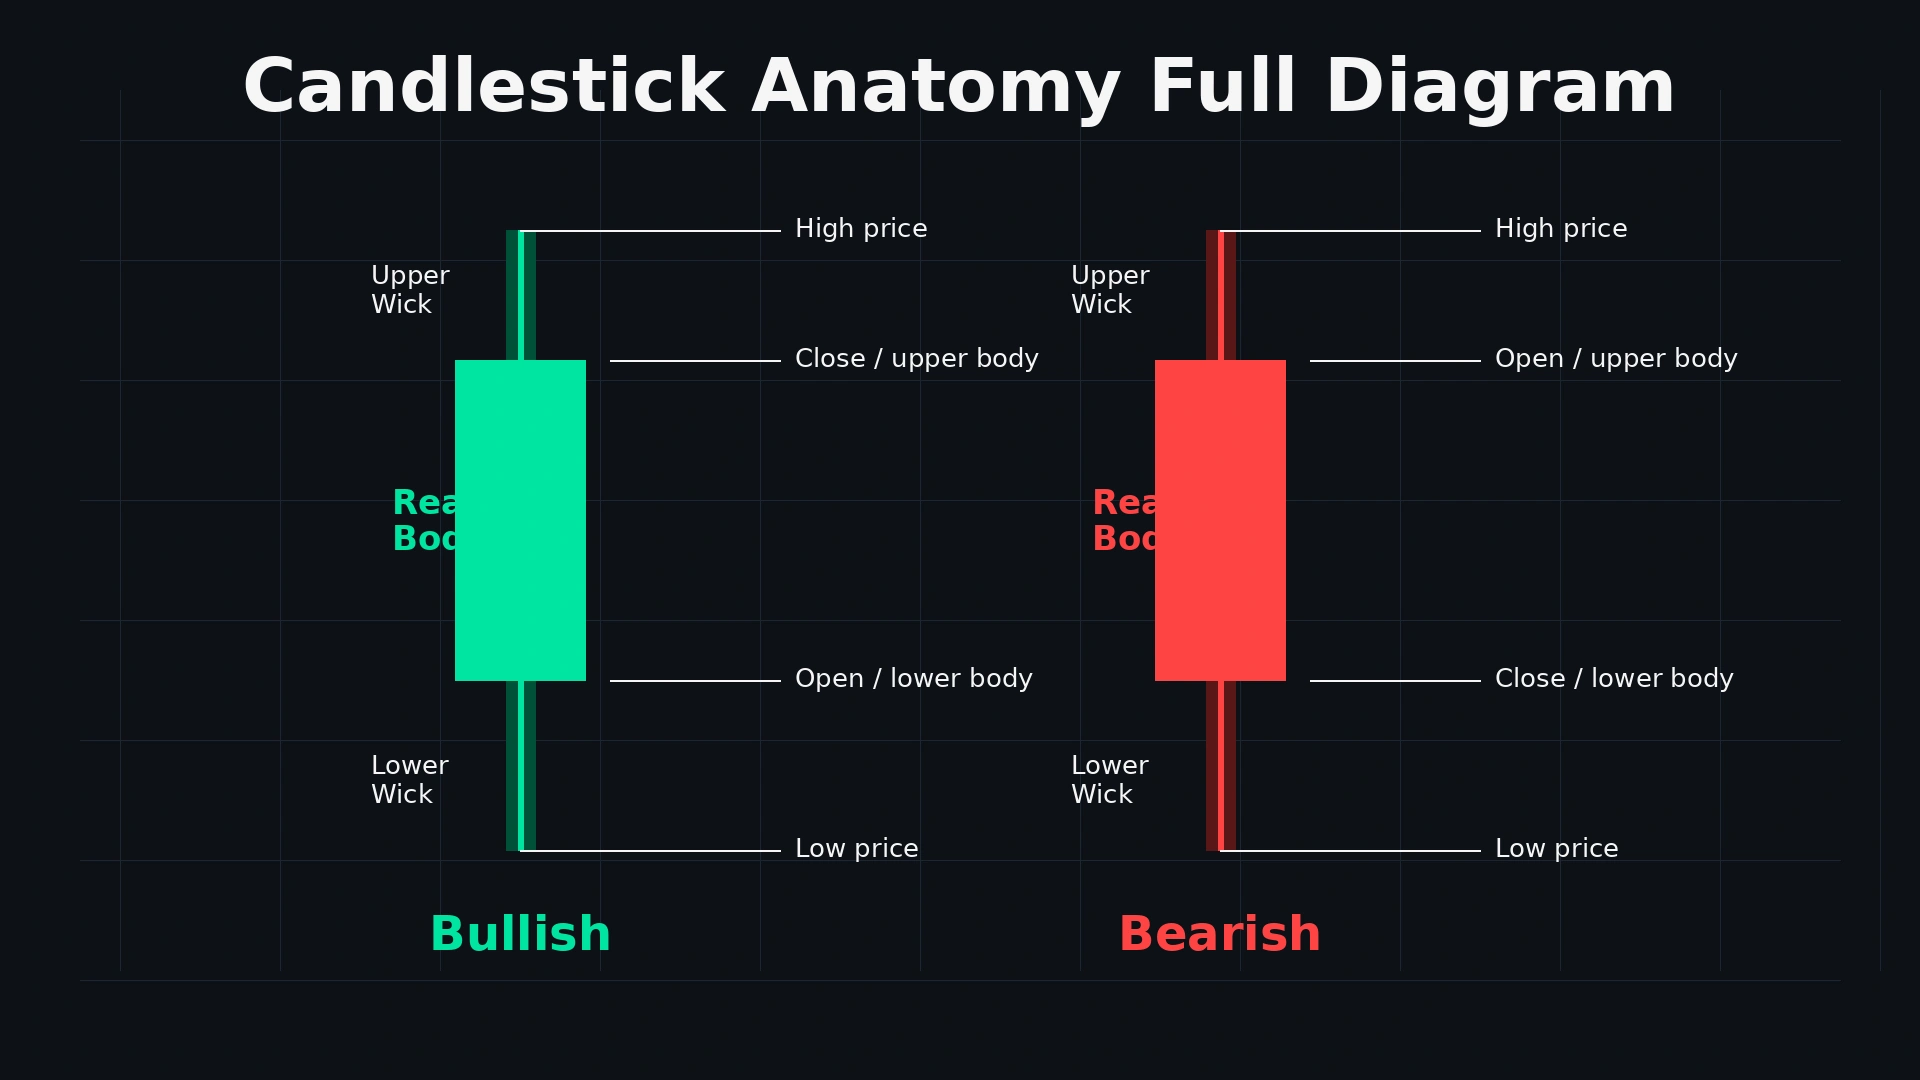
- Bearish vs Bullish Candle — Quick Comparison
- What the Anatomy Tells You About Seller Pressure
- Common Bearish Candlestick Patterns
- Bearish Candles in SMC/ICT Context
- Common Mistakes Traders Make
- FAQ
- Final Thoughts
Bearish Candle Anatomy: How to Read a Bearish Candlestick (With Chart Examples)
Learn bearish candle anatomy in detail — open, close, high, low, body, and wicks — and how to read seller pressure, common bearish patterns, and SMC/ICT context.
Introduction
If you've ever stared at a red candle on your chart and wondered what's actually happening behind it, you're not alone. Understanding bearish candle anatomy is the foundation of reading price action — and it's one of the first things every serious trader on NSE/BSE needs to master before jumping into patterns, Smart Money Concepts, or ICT setups.
In this guide, we'll break down exactly what makes a candle bearish, what each part of it tells you, and how to use that information in real trades.
TL;DR — Key Takeaways
- A candle is bearish when the close is lower than the open — sellers were in control during that period
- Every candle is built from four price points (Open, High, Low, Close) and two visual parts (the real body and the wicks)
- Body size shows conviction: a large body means one-sided selling, a small body means a close fight between buyers and sellers
- Wicks show rejection: a long upper wick on a bearish candle means buyers pushed price up but sellers rejected the highs hard
- Context matters more than color — a bearish candle at a supply zone or order block carries far more weight than a random red candle mid-range
What Is a Bearish Candle?
A candle is bearish when the closing price is lower than the opening price. In simple terms, sellers won control of that time period — price opened higher and ended up lower.
On most charting platforms, bearish candles are shown in red or black, while bullish candles (where price closes higher than it opened) are shown in green or white.
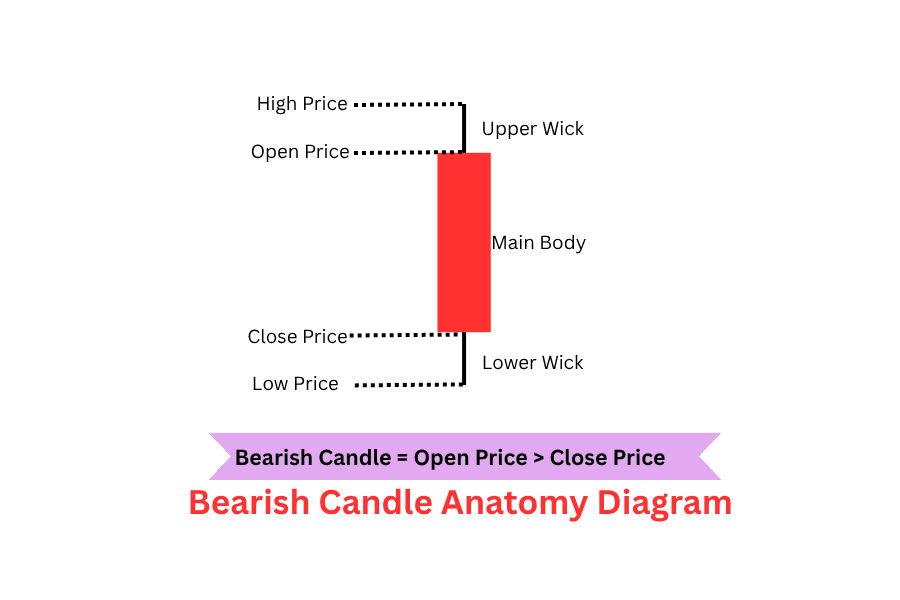
The Anatomy of a Bearish Candle
Every candlestick — bearish or bullish — is made up of four key price points and two visual components:
1. Open
The price at which the candle started for that timeframe. For a bearish candle, this sits at the top of the real body.
2. Close
The price at which the candle ended for that timeframe. For a bearish candle, this sits at the bottom of the real body.
3. High
The highest price touched during that period, marked by the upper wick (or upper shadow).
4. Low
The lowest price touched during that period, marked by the lower wick (or lower shadow).
5. Real Body
The thick rectangular part between the open and close. In a bearish candle, this is typically filled in red. The size of the body tells you how strong the selling pressure was — a large body means sellers dominated the entire session; a small body means the fight between buyers and sellers was close.
6. Upper and Lower Wicks
The thin lines extending above and below the body. Wicks show you the price extremes that were rejected — meaning price went there but couldn't hold, and reversed back.
- Long upper wick on a bearish candle — buyers pushed price up, but sellers stepped in hard and rejected the highs. This is often a sign of exhaustion or a supply zone reaction.
- Long lower wick on a bearish candle — sellers pushed price down, but buyers defended and pushed it back up before the close. Even though the candle is still bearish, this can hint at incoming demand.
Bearish vs Bullish Candle — Quick Comparison
| Feature | Bearish Candle | Bullish Candle |
|---|---|---|
| Close vs Open | Close is lower | Close is higher |
| Color | Red / Black | Green / White |
| Body position | Open on top, Close on bottom | Close on top, Open on bottom |
| Market meaning | Sellers in control | Buyers in control |
What the Anatomy Tells You About Seller Pressure
Reading the anatomy isn't just about naming the parts — it's about understanding the story behind the candle:
- Large body, small wicks — strong, one-sided selling. Sellers were in control from open to close with little pushback.
- Small body, long wicks on both sides — indecision. Neither buyers nor sellers held control, often seen right before a reversal.
- Bearish Marubozu (no wicks at all, just a full body) — maximum seller conviction. Price opened at the high and closed at the low with zero rejection either side.
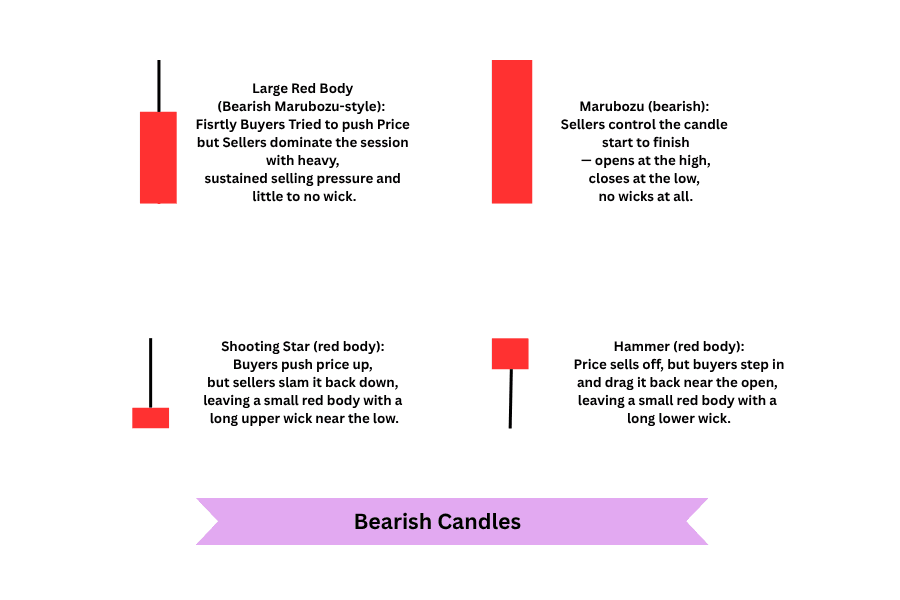
Common Bearish Candlestick Patterns
Once you understand single-candle anatomy, these multi-candle bearish patterns will make a lot more sense:
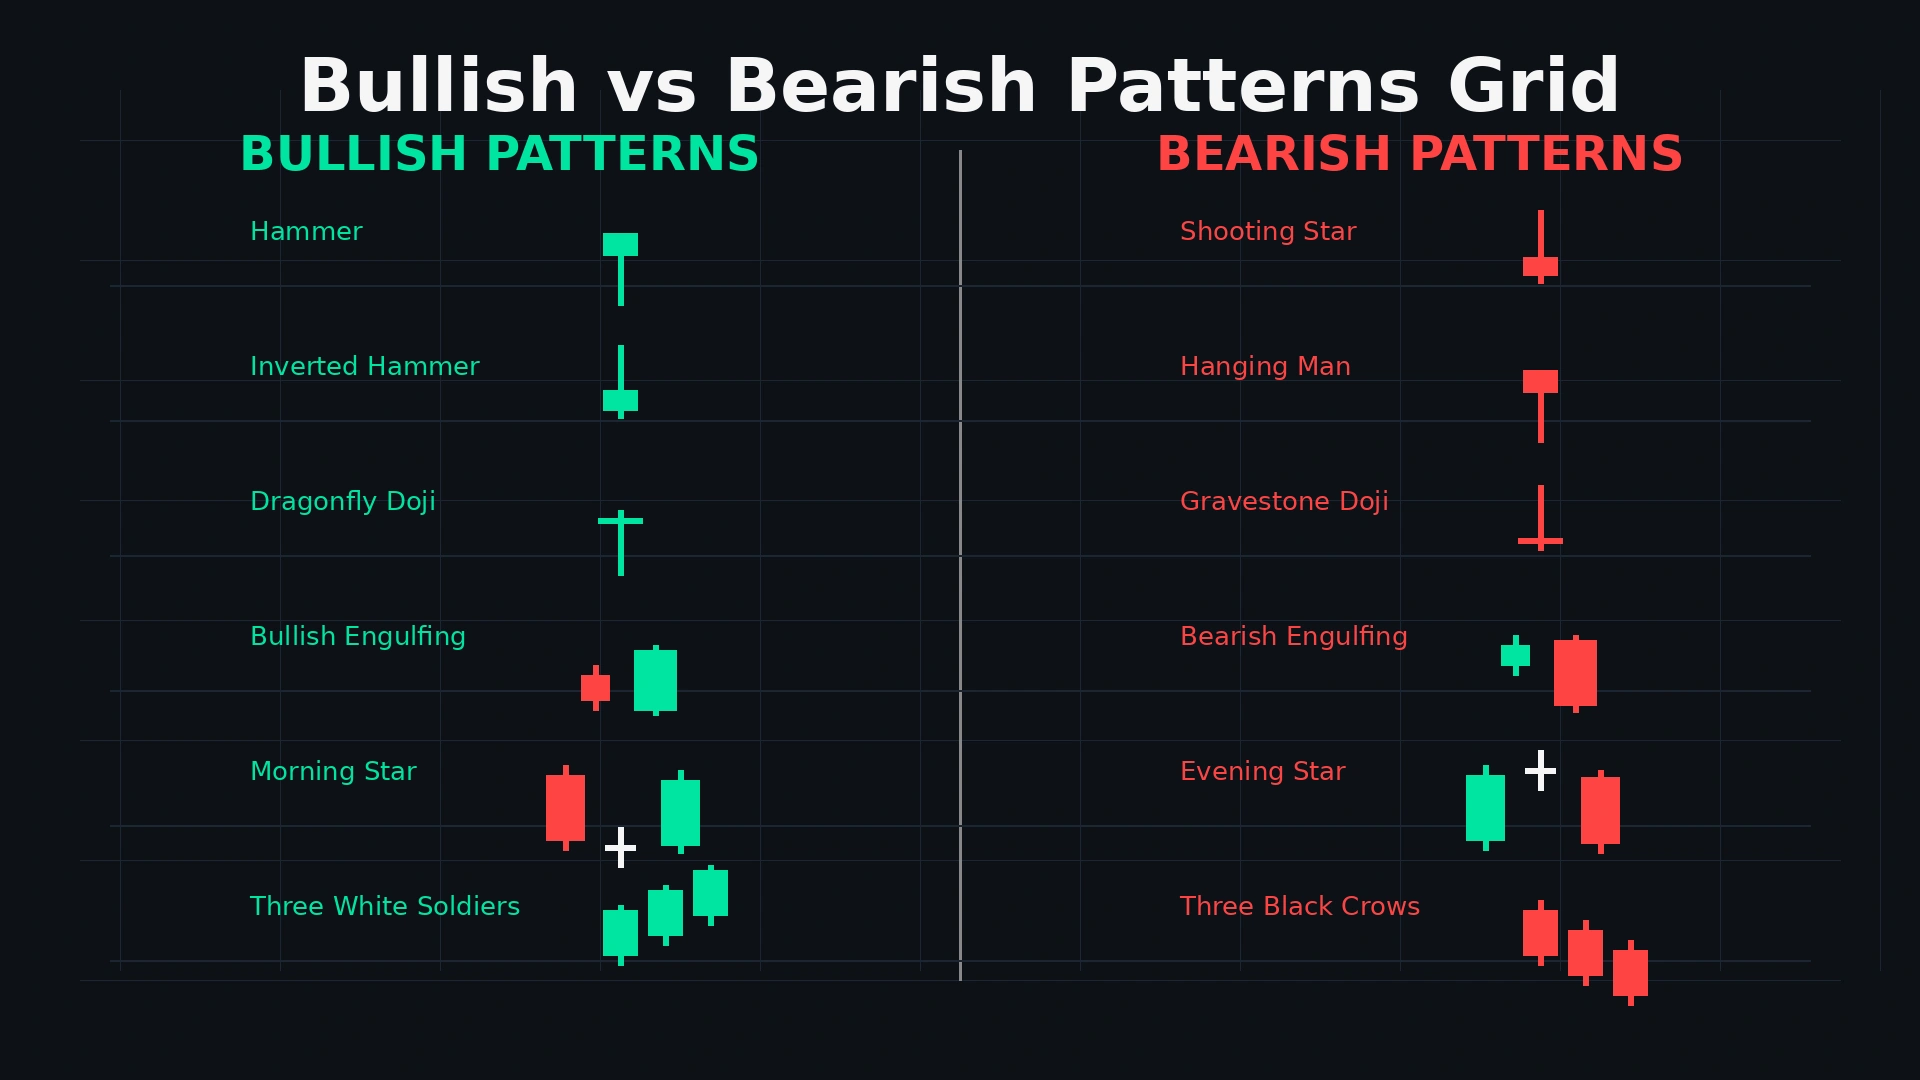
- Bearish Engulfing — a bearish candle that completely engulfs the previous bullish candle's body, signaling a strong shift in control.
- Shooting Star — a small body near the low with a long upper wick, showing rejection at the top of a move.
- Evening Star — a three-candle reversal pattern marking the end of an uptrend.
- Hanging Man — a small body with a long lower wick appearing after an uptrend, warning of potential reversal.
Bearish Candles in SMC/ICT Context
Reading a bearish candle in isolation only tells you half the story. In Smart Money Concepts and ICT methodology, context matters more than the candle itself:
- A bearish candle forming right at a supply zone or unmitigated order block carries far more weight than a random bearish candle in the middle of a range.
- Bearish candles that appear immediately after a liquidity sweep above a previous high (a stop-hunt) often mark genuine reversal points rather than continuation.
- A bearish candle that fills a Fair Value Gap (FVG) from below can act as a strong confirmation of institutional selling.
Pro Tip: At Dhanith Trading, we always teach candle anatomy as step one — but never step where you stop. The real edge comes from combining candle behavior with zone context and liquidity mapping.
Common Mistakes Traders Make
- Trading a bearish candle in isolation, without checking the higher timeframe trend or nearby zones.
- Ignoring volume — a bearish candle on low volume carries far less conviction than one on high volume.
- Treating every red candle as a sell signal — context (support/resistance, trend, liquidity) matters more than color.
- Not backtesting — assuming a pattern works without checking how it's actually performed historically on NSE/BSE charts.
FAQ
What is a bearish candle? A bearish candle is a candlestick where the closing price is lower than the opening price, indicating sellers were in control during that period.
How do you identify a bearish candlestick? Look at the color (usually red or black) and confirm the close is below the open. Check the body size and wick length to gauge the strength of the move.
What does a long upper wick on a bearish candle mean? It signals that buyers pushed price higher but sellers rejected that move and pushed price back down before the close — often a sign of resistance or a supply zone reaction.
Final Thoughts
Bearish candle anatomy is simple on the surface — open, close, high, low, body, wicks — but the way these elements interact tells you a story about who's in control of the market: buyers or sellers. Once you can read that story fluently, patterns like engulfing candles, shooting stars, and SMC concepts like order blocks and liquidity sweeps start making a lot more sense.
The best way to build this skill is repetition — mark up real charts, note the context, and track your observations over time.
Dhanith Trading Journal
Track every trade. Find your real edge.
Log your setups, grade your entries, and review your trading patterns — all in one place. The journal built for serious SMC traders.
Further reading: Bearish Engulfing Pattern: Complete Trading Guide | Shooting Star Candlestick Pattern: Complete Trading Guide | Bullish Candle Anatomy: How to Read a Bullish Candlestick | Order Blocks: The Complete Mastery Guide | Liquidity Sweeps: The Complete Mastery Guide | Fair Value Gaps (FVG): The Complete Mastery Guide | Important Candlestick Patterns Every Trader Must Know
Disclaimer: This article is for educational purposes only and does not constitute financial or investment advice. Trading in stocks and financial markets involves significant risk of capital loss. Past performance of any pattern does not guarantee future results. Always use proper risk management and stop losses.
Was this article helpful?
Click to rate
Trader & Founder, Dhanith Trading
Full-time trader focused on price action, Smart Money Concepts, and intraday strategies for Indian markets. Founder of Dhanith — a trading journal, intraday screener, and risk tools platform built for retail traders.
Dhanith Newsletter
Enjoyed this article? Get more like it.
New trading guides, candlestick patterns, SMC strategies, and tool updates — straight to your inbox. Free, for Indian traders.
No spam. Unsubscribe anytime.
Continue Reading