On this page
- Introduction
- Part 1: How to Read Candlesticks — The Foundation
- The Four Data Points — OHLC
- The Body — Who Won
- The Wicks — Who Got Rejected
- The Three Questions to Ask Every Candle
- Part 2: The Three Context Filters — What Makes Patterns Reliable
- Filter 1 — Trend Context
- Filter 2 — Volume Confirmation
- Filter 3 — Location at Key Levels
- Part 3: The Most Important Single-Candle Patterns
- 1. Hammer — The Bullish Reversal Icon
- 2. Shooting Star — The Bearish Reversal Icon
- 3. Hanging Man — The Warning Signal
- 4. Inverted Hammer — Bullish Despite Bearish Appearance
- 5. Doji — The Five Types of Indecision
- 6. Marubozu — Maximum Conviction
- 7. Spinning Top — Indecision With Range
- Part 4: The Most Important Two-Candle Patterns
- 8. Bullish Engulfing — High-Reliability Reversal
- 9. Bearish Engulfing — The Seller Takeover
- 10. Bullish Piercing Line — Highest Individual Win Rate
- 11. Dark Cloud Cover — The Bearish Piercing Line
- 12. Harami Patterns — Early Warning Signals
- 13. Tweezer Tops and Bottoms — Precision Levels
- Part 5: The Most Important Three-Candle Patterns
- 14. Morning Star — The Strongest Bullish Reversal
- 15. Evening Star — The Strongest Bearish Reversal
- 16. Three White Soldiers — Powerful Bullish Continuation
- 17. Three Black Crows — Powerful Bearish Continuation
- 18. Rising Three Methods — Most Reliable Continuation
- 19. Falling Three Methods — Bearish Continuation
- Part 6: Advanced Patterns — High Power, Lower Frequency
- 20. Bullish Abandoned Baby — The Rarest Reliable Signal
- 21. Three Inside Up and Three Inside Down
- Part 7: Candlestick Patterns in the Indian Market Context
- NSE-Specific Application
- Candlestick Patterns Combined With VWAP (For Intraday Trading)
- Part 8: The Complete Pattern Reference — Quick Lookup Table
- Part 9: The Seven Most Common Candlestick Pattern Mistakes
- Mistake 1 — Trading Patterns Without Prior Trend
- Mistake 2 — Ignoring Volume
- Mistake 3 — Entering Before the Pattern Completes
- Mistake 4 — Not Placing a Stop Loss
- Mistake 5 — Overcomplicating With Too Many Patterns
- Mistake 6 — Applying Reversal Patterns in Ranging Markets
- Mistake 7 — Ignoring the Location
- FAQ
- Conclusion
- Ready to Trade These Patterns on Real Stocks?

Important Candlestick Patterns Every Trader Must Know (Complete Guide 2026)
Master the most important candlestick patterns in 2026. Complete guide to Hammer, Doji, Engulfing, Shooting Star, Morning Star, Marubozu, Three White Soldiers and more — with identification rules, trading strategies, and real examples.
Introduction
If the stock market is a battlefield, candlestick patterns are the intelligence reports that tell you who is winning — and who is about to lose.
Every candlestick on your chart is a record of a completed battle between buyers and sellers. The open, high, low, and close of each candle tell you exactly how that battle ended — who had control at the start, how far each side pushed during the session, and who held the field when the bell rang.
When you learn to read these patterns correctly, price charts stop looking like random noise and start revealing the systematic behavior of the market's most powerful participants.
But here is the problem most traders face: there are over 100 named candlestick patterns. Nobody needs to know all of them. What every trader does need — whether you trade NSE stocks, Nifty futures, forex, or crypto — is a deep, working knowledge of the 15–20 patterns that actually matter. The patterns that appear consistently, that have statistically validated reliability, and that professional traders worldwide actually use to make trading decisions every day.
This complete guide covers all of them. The most important single-candle patterns, the most powerful two-candle signals, the highest-reliability three-candle formations, and the three critical context filters that separate profitable pattern trading from random shape recognition.
By the end, you will know every important candlestick pattern, understand the buyer-seller psychology behind each one, and have a clear framework for applying them in real trades.
TL;DR — Key Takeaways
- There are over 100 named candlestick patterns — the 15–20 covered in this guide account for 90% of what professional traders use
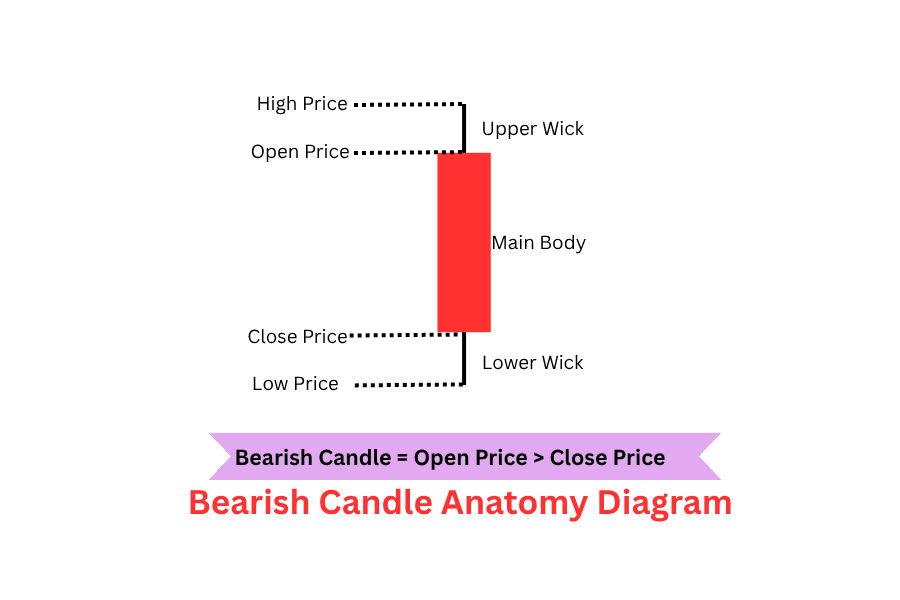
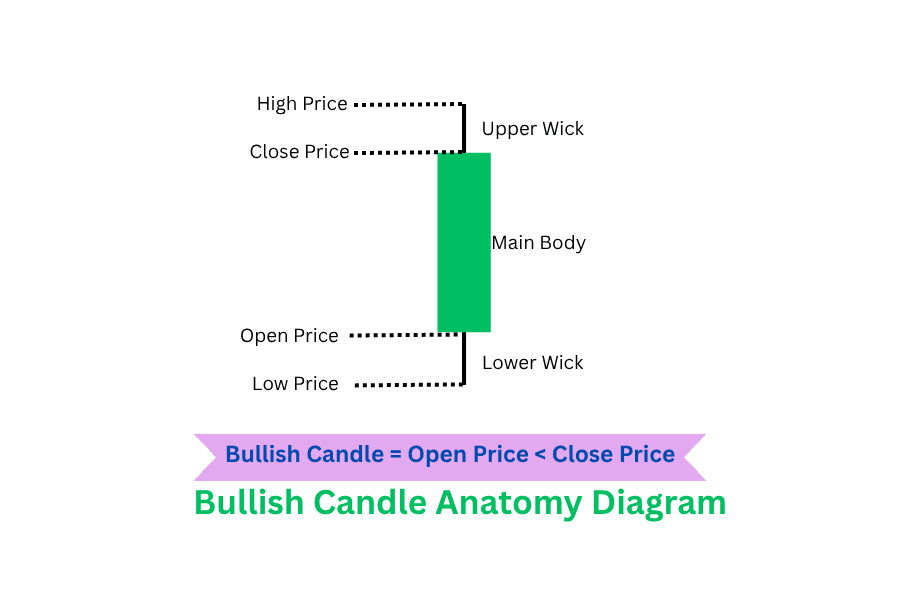
- Every candlestick encodes four prices: Open, High, Low, Close — the body shows the Open-Close range, the wicks show the High-Low extremes
- Patterns fall into three categories: reversal (signal trend change), continuation (signal trend resumption), and indecision (signal a pause)
- No pattern works in isolation — context (trend direction, key levels, volume confirmation) determines whether a signal has real edge
- The three most important bullish patterns: Hammer, Bullish Engulfing, Morning Star
- The three most important bearish patterns: Shooting Star, Bearish Engulfing, Evening Star
- The most important indecision pattern: Doji (all five types)
- The most powerful continuation patterns: Three White Soldiers, Three Black Crows, Rising Three Methods
- Volume is the single most important confirmation filter — a pattern without volume support is significantly less reliable
Part 1: How to Read Candlesticks — The Foundation

Before patterns, you must understand individual candles. Every candlestick tells a complete story in four numbers.
The Four Data Points — OHLC
Open (O): Where the trading period started. The first price buyers and sellers agreed upon.
High (H): The maximum price reached during the period. The upper extreme of the entire battle.
Low (L): The minimum price reached. The lower extreme.
Close (C): Where the period ended. The final verdict of the buyer-seller battle — the most important price of the four.
The Body — Who Won
The rectangular body between Open and Close tells you the direction and decisiveness of the session result.
Green/white body (bullish): Close is above Open. Buyers won. The larger the body, the more decisive the win.
Red/black body (bearish): Close is below Open. Sellers won. The larger the body, the more decisive the dominance.
Tiny body (Doji or Spinning Top): Open and Close are nearly the same. Neither side won. Indecision. A decision point is forming.
The Wicks — Who Got Rejected
The thin lines extending above and below the body tell you where each side attempted to go — and got pushed back.
Upper wick: Buyers pushed price this high during the session but sellers rejected the level, pushing price back down before close. The longer the upper wick, the more aggressive the selling rejection of higher prices.
Lower wick: Sellers pushed price this low but buyers stepped in and recovered it before close. The longer the lower wick, the more aggressive the buying at the lows.
The Three Questions to Ask Every Candle
Before reading any pattern, apply these three questions to each individual candle:
- Who won the session? (Body colour — green = buyers, red = sellers)
- How convincingly? (Body size relative to total range — large = decisive, small = tentative)
- What did the extremes reveal? (Wick length — long upper wick = selling rejection, long lower wick = buying rejection)
Master these three questions and you can read any candlestick chart without memorising a single named pattern.
Part 2: The Three Context Filters — What Makes Patterns Reliable
Here is the most important insight in this entire guide: candlestick patterns do not predict the future. Context does.
Without these three filters, even the most reliable candlestick patterns produce results barely better than random. With them, patterns become genuine, statistically validated trading signals.

Filter 1 — Trend Context
Every reversal pattern requires a trend to reverse. A Hammer appearing after a 10-session downtrend at a major support level is a powerful bullish reversal signal. The same Hammer appearing in the middle of a sideways range means nothing.
The minimum requirement: At least 5–7 candles in the prior trend before any reversal pattern carries meaningful weight. The stronger and more sustained the prior trend, the more significant the reversal signal.
Filter 2 — Volume Confirmation
Volume is the market's truth detector. When a reversal pattern forms on volume significantly above the recent average, institutions are participating — the reversal has real backing. When the same pattern forms on thin volume, it is retail noise without institutional support.
The threshold: The pattern's key candle (the engulfing candle, the third candle of a Morning Star, the Hammer itself) should have volume at least 1.5× the 20-period average. Below-average volume patterns should be skipped entirely or held to a very reduced position size.
Filter 3 — Location at Key Levels
A candlestick pattern is maximally significant when it forms at a structurally important price level:
- Support levels for bullish patterns — where buying has historically arrested declines
- Resistance levels for bearish patterns — where selling has historically arrested rallies
- VWAP (for intraday traders) — the institutional fair value reference
- Order blocks and FVGs (for SMC traders) — institutional entry zones
- Round numbers — ₹500, ₹1,000, ₹2,000 price points attract disproportionate order flow
- Previous day/week highs and lows — structural reference points all participants watch
A Bullish Engulfing at a random mid-range location has modest reliability. The same pattern at a major support level, after a 10-session decline, on 2× average volume — that is a Grade A signal.
Part 3: The Most Important Single-Candle Patterns

1. Hammer — The Bullish Reversal Icon
The Hammer is the single most searched and most recognised bullish candlestick pattern. It appears at the bottom of downtrends and signals that buyers are stepping in aggressively to arrest the decline.
Visual identification:
- Small body at the upper end of the candle's total range
- Long lower wick — minimum 2× the body length
- Little or no upper wick
- Can be bullish (green) or bearish (red) — a green Hammer is slightly stronger

The psychology: Sellers pushed price significantly lower during the session (creating the long lower wick), but buyers surged back with such force that price recovered to close near the open. The session's low was decisively rejected. This buyer strength at a support level, after a decline, is the signal that selling pressure is exhausting.
Entry rules:
- Wait for the Hammer to fully form (candle close)
- The following candle must confirm: it should close above the Hammer's body
- Entry: at the close of the confirmation candle, or above the Hammer's high
- Stop: below the Hammer's lowest wick point
- Target: the previous swing high above
Reliability data: The Inverted Hammer — the bullish equivalent of the Hammer — is the highest-profitability single-candle pattern per trade at 1.12% average gain per occurrence in backtested data. The Hammer itself consistently ranks among the top five most reliable single-candle bullish signals.
Pro Tip: A Hammer on the daily chart at a previous support level, with volume 2× or more above the 20-day average, is one of the highest-probability setups in all of technical analysis. The combination of structural location, prior trend, and volume confirmation pushes the probability significantly above the base rate of the pattern alone.
Go deeper: Hammer Candlestick Pattern: Complete Trading Guide — the full identification checklist, 5 proven strategies with RSI and VWAP confirmation, and real NSE chart examples.
2. Shooting Star — The Bearish Reversal Icon
The Shooting Star is the mirror image of the Hammer — appearing at market tops and signalling seller rejection of higher prices.
Visual identification:
- Small body at the lower end of the candle's total range
- Long upper wick — minimum 2× the body length
- Little or no lower wick
- The wick must be at the top, pointing upward like a shooting star falling to ground

The psychology: Buyers pushed price significantly higher during the session (the long upper wick), but sellers overwhelmed them before the close, driving price back down near the open. The aggressive rejection of higher prices at a resistance level, after a rally, signals that buyers are running out of strength.
Entry rules:
- Wait for the Shooting Star to fully form
- Confirmation candle closes below the Shooting Star's body
- Entry: at the close of the confirmation candle
- Stop: above the Shooting Star's high (the top of the wick)
- Target: the previous swing low below
Go deeper: Shooting Star Candlestick Pattern: Complete Trading Guide — exact identification rules, 5 proven strategies, and RSI + MACD + resistance confirmation with real NSE chart examples.
3. Hanging Man — The Warning Signal
Identical visual appearance to the Hammer — small body at the top, long lower wick, no upper wick. The critical difference is context: the Hanging Man appears at the top of an uptrend.

The long lower wick that is bullish after a decline becomes ominous after a rally. It shows sellers were strong enough to push price significantly below the open — even though buyers recovered it. The first time sellers show this kind of force during an uptrend is a warning that the trend may be tiring.
The Hanging Man requires stronger confirmation than the Hammer — wait for the next candle to close below the Hanging Man's body with expanding volume before treating it as a reversal signal.
4. Inverted Hammer — Bullish Despite Bearish Appearance
Identical visual appearance to the Shooting Star — small body at the bottom, long upper wick. Context makes the difference: the Inverted Hammer appears at the bottom of a downtrend.

The long upper wick during a downtrend shows buyers are beginning to fight back — pushing price significantly above the open before sellers recovered it. It is not a decisive buyer win (hence the bearish-looking wick), but it signals the balance of power is shifting.
Requires confirmation: The following candle must close above the Inverted Hammer's high to confirm buyers have taken control.
5. Doji — The Five Types of Indecision
The Doji forms when the Open and Close are at nearly the same price — the session ended where it started, regardless of how far price traveled intraday.
A Doji is never a standalone signal. Its significance comes entirely from where it appears and what comes next. The five types:

Standard Doji (Cross): Equal upper and lower wicks. Pure indecision. Neither buyers nor sellers won. Most meaningful after a sustained trend, signalling exhaustion.
Dragonfly Doji: Long lower wick, no upper wick, body at the top. Price fell hard during the session but buyers recovered the entire move. At the bottom of a downtrend, at support, this is a powerful bullish reversal signal.

Gravestone Doji: Long upper wick, no lower wick, body at the bottom. Price rallied hard but sellers drove it all the way back to the open. At the top of an uptrend, at resistance, this is a powerful bearish reversal signal.

Long-Legged Doji: Very long wicks on both sides. Extreme volatility with no resolution — the market traveled far in both directions and ended where it started. Often precedes a significant move in either direction.
Four-Price Doji: Open, High, Low, and Close all the same. Extremely rare in liquid markets. Indicates near-zero participation.
| Doji Type | Best Location | Signal |
|---|---|---|
| Standard Doji | After strong trend | Reversal warning — wait for confirmation |
| Dragonfly Doji | Bottom of downtrend at support | Bullish reversal |
| Gravestone Doji | Top of uptrend at resistance | Bearish reversal |
| Long-Legged Doji | After extended move | Potential explosive move either way |
| Four-Price Doji | Any | Ignore — thin market |
6. Marubozu — Maximum Conviction
The Marubozu (from Japanese: "bald head/shaved head") is a candle with no wicks — or minimal wicks — where the open equals the low (bullish) or the close equals the low (bearish).
Bullish Marubozu: Opens at the low, closes at the high. Not a single point of pushback from sellers during the entire session. The most bullish single candle possible. In SMC terms, this is the displacement candle — the institutional delivery move.

Bearish Marubozu: Opens at the high, closes at the low. Sellers dominated the entire session without a single moment of buyer recovery.

Marubozu candles are not typically traded as reversal signals — they are read as confirmation of institutional momentum. A large bullish Marubozu on above-average volume breaking through resistance is a continuation signal, not a reversal.
7. Spinning Top — Indecision With Range
Small body with wicks on both sides of roughly equal length. Neither buyers nor sellers won the session, but unlike a Doji, there is at least a minimal directional bias.
In the middle of a range, a Spinning Top means nothing. At the top of a strong uptrend, a cluster of Spinning Tops signals that bullish momentum is fading — buyers are no longer dominant. The same cluster at the bottom of a downtrend signals seller exhaustion.

Part 4: The Most Important Two-Candle Patterns
8. Bullish Engulfing — High-Reliability Reversal
The Bullish Engulfing is among the most reliable and most traded two-candle patterns in global financial markets. It appears at the end of downtrends and signals a decisive, complete buyer takeover.
Visual identification:
- Candle 1: A bearish (red) candle — sellers in control
- Candle 2: A bullish (green) candle whose body completely engulfs Candle 1's body
- Candle 2 opens below Candle 1's close
- Candle 2 closes above Candle 1's open
- The body of Candle 2 exceeds the body of Candle 1 entirely

The psychology: Day 1 confirmed seller dominance — the downtrend is intact. Day 2 buyers overwhelmed sellers so completely that they erased the entire Day 1 decline and extended beyond it. This is not a partial recovery — it is a complete buyer takeover in a single session.
The key rule: The engulfment must be body to body — Candle 2's body must exceed Candle 1's body. Wick-to-wick engulfment is less significant.
Entry rules:
- Enter at the close of the engulfing candle (Day 2) or the open of Day 3
- Stop: below the low of the entire two-candle pattern (the lowest point of either candle)
- Target: the previous swing high above
Volume requirement: Volume on Day 2 (the bullish engulfing candle) must be significantly higher than Day 1. The louder the buyer announcement, the more reliable the reversal.
Reliability data: The Bullish Engulfing consistently ranks among the top three most reliable reversal patterns in backtested studies. Win rates of 57–70% are reported depending on the study parameters and confirmation filters applied.
An even sharper variant — the Bullish Kicker: When Day 2 doesn't just open below Day 1's close but gaps cleanly above Day 1's entire range — leaving a visible empty gap between the two candles, with no overlap at all — the pattern becomes a Bullish Kicker. It is rarer than a standard Bullish Engulfing but represents an even more violent transfer of control, often triggered by overnight news.

Pro Tip: The Bullish Engulfing is especially powerful when it appears at a recognised support level after the market has made a false break below that level (a liquidity sweep). The false break shakes out weak longs, creating the sell-side liquidity that institutions use to fill their buy orders — and the Bullish Engulfing is the visual confirmation that those buyers have completely taken control.
Go deeper: Bullish Engulfing Pattern: Complete Trading Guide — identification rules, 5 proven strategies, RSI + VWAP + support combinations, and real stock examples.
9. Bearish Engulfing — The Seller Takeover
The mirror of the Bullish Engulfing. Candle 1 is bullish. Candle 2 is bearish and completely engulfs Candle 1's body. Appears at the top of uptrends.

Psychology: Day 1 confirms bullish momentum. Day 2 sellers overwhelm buyers completely — erasing the entire Day 1 gain and extending below it. Maximum seller conviction.
Requirements: Same as Bullish Engulfing — complete body engulfment, above-average volume on the bearish candle, appears at resistance or after a prolonged uptrend.
Entry: At the close of the bearish engulfing candle. Stop above the pattern's high. Target the previous swing low.
The mirror — Bearish Kicker: Day 2 gaps down clean below Day 1's entire range, with no overlap between the two candles' bodies. Like its bullish counterpart, it is less common than a standard Bearish Engulfing but signals an even more abrupt reversal — often the result of negative overnight news forcing a clean gap-down open.

Go deeper: Bearish Engulfing Pattern: Complete Trading Guide — exact identification rules, 5 proven strategies, RSI + MACD + Bollinger Bands combinations, and real NSE stock examples.
10. Bullish Piercing Line — Highest Individual Win Rate
The Bullish Piercing Line holds the highest individual win rate of all 75 candlestick patterns in comprehensive backtesting on S&P 500 data.
Visual identification:
- Candle 1: A long bearish candle
- Candle 2: Opens below Candle 1's low (gap down or significantly lower open), then rallies to close above the midpoint of Candle 1's body

The psychology: The gap down or low open confirms seller momentum — then buyers surge from below, recovering more than half of Candle 1's decline in a single session. The 50% recovery threshold is critical — it demonstrates substantial buyer conviction, not just a minor bounce.
The 50% rule: Candle 2 MUST close above the exact midpoint of Candle 1's body. If it closes below the midpoint, the pattern does not qualify — it is a failed recovery, not a Piercing Line.
11. Dark Cloud Cover — The Bearish Piercing Line
The bearish equivalent. Candle 1 is a long bullish candle. Candle 2 opens above Candle 1's high, then falls to close below the midpoint of Candle 1's body. The same 50% penetration rule applies.

The false breakout mechanism: The opening above Candle 1's high appears to confirm the uptrend — attracting breakout buyers — before sellers overwhelm them and drive price below the session midpoint. Those late breakout buyers are now trapped, adding to selling pressure.
12. Harami Patterns — Early Warning Signals
The Bullish Harami and Bearish Harami (from Japanese: "pregnant") are two-candle reversal warnings — weaker than Engulfing patterns but providing earlier warning.
Bullish Harami:
- Candle 1: Large bearish candle
- Candle 2: Small candle (bullish or bearish) whose entire body is contained within Candle 1's body
- Signal: The large decline has paused. Selling momentum is fading. Not yet a buyer victory — a potential buyer preparation.
- Requires confirmation from Candle 3

Bearish Harami:
- Candle 1: Large bullish candle
- Candle 2: Small candle entirely contained within Candle 1's body
- Signal: The rally has paused. Bullish momentum fading. Requires confirmation.

The Harami Cross: When Candle 2 is specifically a Doji, the signal is significantly stronger. A Doji inside a large candle body indicates complete indecision at a moment of maximum prior momentum — a powerful signal of trend exhaustion.
13. Tweezer Tops and Bottoms — Precision Levels
Tweezer Bottom: Two consecutive candles with nearly identical lows. Buyers defended the same price level twice consecutively, creating an identifiable double-support.

Tweezer Top: Two consecutive candles with nearly identical highs. Sellers defended the same resistance twice — creating a precise resistance level.

Important caveat: Tweezers are best used to identify specific price levels rather than as primary entry triggers. As standalone trading signals, they underperform. Combined with a key structural support or resistance and an additional confirmation, they become useful precision tools.
Part 5: The Most Important Three-Candle Patterns
14. Morning Star — The Strongest Bullish Reversal
The Morning Star is the most powerful and most reliable bullish reversal pattern in technical analysis — appearing at the end of downtrends and signalling a complete three-session transfer of control from sellers to buyers.
Visual identification:
- Candle 1: Large bearish candle — confirms the downtrend momentum
- Candle 2 (The Star): Small body (Doji or Spinning Top) — seller momentum has stalled; neither buyers nor sellers dominate; ideally gaps below Candle 1's close
- Candle 3: Large bullish candle closing above the midpoint of Candle 1's body — buyers have completely taken control

The narrative: Day 1 — sellers win decisively, downtrend appears strong. Day 2 — sellers try to continue but can no longer dominate; the market pauses in uncertainty. Day 3 — buyers surge forward, completely reversing Day 1's losses and signalling the trend has changed.
The three requirements:
- Candle 3 must close above the midpoint of Candle 1's body (the 50% level)
- Volume must expand on Candle 3 — the buyer surge must have institutional backing
- The pattern must appear after a genuine downtrend with a recognisable support level nearby
Entry rules:
- Entry: at the close of Candle 3, or at the open of Candle 4
- Stop: below the low of the entire three-candle pattern (typically the low of Candle 2)
- Target: minimum 50% retracement of the prior downtrend; first target is the previous swing high
Morning Doji Star: When Candle 2 is specifically a Doji, the pattern becomes even stronger — the complete open=close indecision of a Doji shows total selling exhaustion before the buyer surge of Candle 3.

Pro Tip: The Morning Star is most reliable when Candle 2 (the star) has gaps on both sides — a gap below Candle 1's close and a gap above Candle 3's open. In Indian markets, overnight gaps are common and create these true Morning Star gaps regularly on the daily chart. When gaps appear on both sides, the reliability of the pattern increases substantially.
Go deeper: Morning Star Candlestick Pattern: Complete Trading Guide — the 3-candle structure, identification checklist, 5 proven strategies with RSI + VWAP + support, and real NSE stock examples.
15. Evening Star — The Strongest Bearish Reversal
The mirror of the Morning Star. Three candles at the top of an uptrend:
- Candle 1: Large bullish candle — uptrend confirmed
- Candle 2: Small body star — buyer momentum stalled
- Candle 3: Large bearish candle closing below the midpoint of Candle 1's body

The Evening Star is the signal that the uptrend's final chapter has been written. It appears at market tops, at resistance levels, often preceding multi-session declines.
Requirements mirror the Morning Star: Candle 3 must penetrate below 50% of Candle 1's body; volume must expand on Candle 3; pattern must appear after a sustained uptrend at resistance.
Evening Doji Star: When Candle 2 is specifically a Doji — gap-isolated above Candle 1 and below Candle 3 — the bearish reversal carries significantly more weight. The complete indecision of a Doji after a sustained uptrend shows buying conviction has evaporated entirely before sellers seize control on Candle 3.

16. Three White Soldiers — Powerful Bullish Continuation
Three White Soldiers is one of the most reliable continuation patterns in technical analysis, signalling sustained institutional buying over three consecutive sessions.
Visual identification:
- Three consecutive large bullish (green) candles
- Each candle opens within or above the previous candle's body
- Each candle closes near its high (short or no upper wick)
- Each candle's close is higher than the previous close — stair-stepping upward
The psychology: Three sessions in a row where buyers dominated from open to close, gaining ground each day, and closing at or near the high each time. This is not retail buying — this is institutional accumulation playing out in a methodical, sustained pattern.
Reliability data: Three White Soldiers consistently achieves win rates of 73.7% in backtesting when the three-candle formation is confirmed by expanding volume across all three sessions. It is one of the highest-probability continuation patterns available.
What to avoid (the "Advance Block" warning): If the three candles become progressively smaller — the third is noticeably smaller than the second, which was smaller than the first — the pattern is called an "Advance Block" and signals weakening momentum, not continuation. The candles should be roughly equal in size or slightly growing, not shrinking.
17. Three Black Crows — Powerful Bearish Continuation
The mirror of Three White Soldiers. Three consecutive large bearish (red) candles, each opening within the prior candle's body, each closing near its low. Methodical, sustained institutional selling.
Application: Most powerful when appearing after a period of consolidation or at the beginning of a confirmed downtrend. Volume should expand across all three sessions.
18. Rising Three Methods — Most Reliable Continuation
The Rising Three Methods is a five-candle continuation pattern and one of the highest-reliability formations in all of technical analysis.
Formation:
- Candle 1: Large bullish candle
- Candles 2–4: Three small bearish candles that retrace partially into Candle 1's body — but do not close below Candle 1's open
- Candle 5: Large bullish candle closing above Candle 1's close

The psychology: The initial bullish impulse (Candle 1) is followed by three sessions of profit-taking and consolidation (Candles 2–4). But bulls maintain control — the retracement never breaks below Candle 1's open. Candle 5's decisive advance above Candle 1's close confirms the consolidation is complete and the uptrend resumes.
This pattern beautifully illustrates institutional accumulation: the brief pullback provides lower prices for institutions to add positions before continuing the rally.
Reliability: Rising Three Methods shows win rates of 73–91% in trending markets — the highest range of any candlestick continuation pattern.
19. Falling Three Methods — Bearish Continuation
The mirror: Large bearish Candle 1, three small bullish candles that partially recover but don't close above Candle 1's open, then a large bearish Candle 5 closing below Candle 1's close. Confirms bearish trend continuation after a brief pullback.

That covers every pattern in Parts 3 to 5. Before moving on to the advanced, lower-frequency patterns, here is how all of them line up as bullish/bearish mirror pairs:

Part 6: Advanced Patterns — High Power, Lower Frequency
20. Bullish Abandoned Baby — The Rarest Reliable Signal
The Bullish Abandoned Baby is a high-reliability pattern that appears infrequently but produces some of the sharpest reversals in technical analysis.
Formation:
- Candle 1: Large bearish candle in a downtrend
- Candle 2: A Doji that gaps below Candle 1's close — the Doji's high is below Candle 1's low
- Candle 3: Large bullish candle that gaps above Candle 2's close — Candle 3's low is above Candle 2's high

The Doji is completely isolated — "abandoned" — with price gaps on both sides. This isolation makes it extraordinary: the market tested the lows, found no sellers willing to push further, and the complete gap recovery on Candle 3 signals total buyer control.
Note on Indian markets: True gaps (where the wick of one candle does not overlap the next) are more common in Indian equity markets due to overnight sessions, making the Abandoned Baby more observable here than in forex markets.
Bearish Abandoned Baby: The mirror pattern, appearing at the top of an uptrend. Candle 1 is a large bullish candle, Candle 2 is a Doji that gaps above Candle 1's high, and Candle 3 is a large bearish candle that gaps below Candle 2's low — the same dramatic gap-isolation, but signalling that buyers have been completely abandoned at the top.

21. Three Inside Up and Three Inside Down
Three Inside Up (Bullish Reversal): A two-step reversal — first the Harami (warning), then the confirmation:
- Candle 1: Large bearish candle
- Candle 2: Small bullish candle inside Candle 1's body (Bullish Harami)
- Candle 3: Bullish candle closing above Candle 1's open
The Harami signals the pause; Candle 3's close above Candle 1's entire body confirms buyers have fully reversed the prior move.
Three Inside Down (Bearish Reversal): The mirror — large bullish Candle 1, bearish Harami Candle 2, Candle 3 closing below Candle 1's open.
Part 7: Candlestick Patterns in the Indian Market Context
NSE-Specific Application
Candlestick patterns work identically across all liquid markets, but Indian traders have specific considerations that affect application:
Daily chart patterns for NSE stocks: The most reliable candlestick setups in India come from daily charts on Nifty 50 and Bank Nifty constituents. These liquid large-cap stocks have sufficient institutional participation to make pattern reactions genuine rather than retail noise.
Intraday patterns (5-minute and 15-minute charts): The most actionable intraday candlestick signals appear during the 9:30–11:00 AM killzone when institutional volume is highest. Patterns forming during the 11:30 AM–1:30 PM lunch lull have lower reliability due to reduced institutional participation.
Pre-open gap analysis: When an NSE stock gaps up or down significantly at the 9:15 AM open, the first 15-minute candle becomes a particularly important candlestick. A large bullish gap-open Marubozu signals strong institutional buying. A gap up followed by a Shooting Star in the first 30 minutes signals the gap may be filled.
Bank Nifty special consideration: Bank Nifty's high volatility (ATR typically 1.5–2% daily) means candlestick patterns produce larger price movements but also larger false signals. Require stronger volume confirmation on Bank Nifty patterns than on individual stocks.
Candlestick Patterns Combined With VWAP (For Intraday Trading)
The most powerful intraday application of candlestick patterns in Indian markets combines them with VWAP:
Bullish rejection candle at VWAP: A Hammer or Bullish Engulfing forming exactly at the VWAP line signals that institutional buyers are defending fair value. This combination — VWAP as the institutional reference level and candlestick as the visual confirmation — is one of the highest-probability intraday setups available to NSE traders.
Bearish rejection candle at VWAP: A Shooting Star or Bearish Engulfing at VWAP signals institutional sellers defending fair value from above. Enter short with stop above the pattern high.
Bullish Engulfing below VWAP: A complete Bullish Engulfing pattern when price is below VWAP signals a potential VWAP reclaim and session direction change. This is the third entry condition in the Dhanith intraday trading strategy — specifically designed around this candlestick-VWAP combination.
Ready to apply these patterns on real NSE stocks? The Dhanith Intraday Screener pre-filters high-momentum stocks where VWAP-candlestick setups appear every session — so you spend your time trading, not searching.
Part 8: The Complete Pattern Reference — Quick Lookup Table
Use this table as your go-to reference for every important candlestick pattern:

| Pattern | Type | Candles | Signal | Reliability | Key Requirement |
|---|---|---|---|---|---|
| Hammer | Single | 1 | Bullish reversal | High | After downtrend at support |
| Hanging Man | Single | 1 | Bearish warning | Medium | After uptrend; needs confirmation |
| Shooting Star | Single | 1 | Bearish reversal | High | After uptrend at resistance |
| Inverted Hammer | Single | 1 | Bullish warning | Medium | After downtrend; strong confirmation needed |
| Doji (Standard) | Single | 1 | Indecision | Medium | Context-dependent |
| Dragonfly Doji | Single | 1 | Bullish reversal | High | At support after downtrend |
| Gravestone Doji | Single | 1 | Bearish reversal | High | At resistance after uptrend |
| Bullish Marubozu | Single | 1 | Bullish continuation | High | After consolidation |
| Bearish Marubozu | Single | 1 | Bearish continuation | High | After consolidation |
| Bullish Engulfing | Double | 2 | Bullish reversal | High | After downtrend; high volume |
| Bearish Engulfing | Double | 2 | Bearish reversal | High | After uptrend; high volume |
| Bullish Piercing | Double | 2 | Bullish reversal | Highest | Close above 50% of Candle 1 |
| Dark Cloud Cover | Double | 2 | Bearish reversal | High | Close below 50% of Candle 1 |
| Bullish Harami | Double | 2 | Bullish warning | Medium | Requires Candle 3 confirmation |
| Bearish Harami | Double | 2 | Bearish warning | Medium | Requires Candle 3 confirmation |
| Morning Star | Triple | 3 | Bullish reversal | Very High | Candle 3 above 50% of Candle 1 |
| Evening Star | Triple | 3 | Bearish reversal | Very High | Candle 3 below 50% of Candle 1 |
| Three White Soldiers | Triple | 3 | Bullish continuation | High | Each close near high; volume expanding |
| Three Black Crows | Triple | 3 | Bearish continuation | High | Each close near low; volume expanding |
| Rising Three Methods | Five | 5 | Bullish continuation | Very High | Candles 2–4 stay above Candle 1 open |
| Falling Three Methods | Five | 5 | Bearish continuation | Very High | Candles 2–4 stay below Candle 1 open |
| Bullish Abandoned Baby | Triple | 3 | Bullish reversal | Very High | Gaps on both sides of Candle 2 |
| Three Inside Up | Triple | 3 | Bullish reversal | High | Candle 3 closes above Candle 1 open |

Spotted a pattern? Size the trade correctly before you enter. Use the Dhanith Risk Management Calculator to calculate your exact share count, stop distance, and maximum loss in seconds.
Part 9: The Seven Most Common Candlestick Pattern Mistakes
Mistake 1 — Trading Patterns Without Prior Trend
Entering a Morning Star trade without confirming there was a downtrend preceding it. A three-candle dip-then-rally pattern in a sideways market is not a Morning Star — it is a random three-candle fluctuation.
The fix: Before acting on any reversal pattern, identify the prior trend. The reversal pattern must be reversing something.
Mistake 2 — Ignoring Volume
Entering a Bullish Engulfing on below-average volume. The pattern looks perfect visually but the institutional buying is absent. The "reversal" fails within two candles.
The fix: Check the volume bar of the pattern's key candle (the engulfing candle, the third Morning Star candle, the Hammer) against the 20-period average. Below-average volume = reduced position size or skip entirely.
Mistake 3 — Entering Before the Pattern Completes
Seeing Day 2 of a forming Morning Star (the star/Doji) and entering long before Day 3 confirms. Day 3 turns bearish and the position immediately loses.
The fix: Patterns require all their candles to complete. A three-candle pattern needs three fully closed candles. A two-candle pattern needs both to close. Never enter based on a candle that is still forming.
Mistake 4 — Not Placing a Stop Loss
Trading a "perfect" Bullish Engulfing without a defined stop loss because "it's such a clear signal." The pattern fails and the loss grows into a major account draw-down.
The fix: Every candlestick pattern trade requires a defined stop loss before entry. For bullish patterns: stop below the low of the entire pattern. For bearish patterns: stop above the high. No exceptions.
Mistake 5 — Overcomplicating With Too Many Patterns
Trying to learn all 100+ candlestick patterns simultaneously, producing pattern confusion and analysis paralysis.
The fix: Master these five patterns completely before learning any others: Hammer/Shooting Star, Bullish/Bearish Engulfing, Morning/Evening Star, Doji (all five types), Three White Soldiers/Three Black Crows. These five groups account for 90% of actionable signals in real markets.
Mistake 6 — Applying Reversal Patterns in Ranging Markets
Taking every Hammer and Engulfing signal in a sideways, choppy market where reversals are not meaningful because there is no established trend to reverse.
The fix: In ranging markets, reversal patterns produce false signals much more frequently. Identify whether the market is trending or ranging before applying reversal patterns. In ranges, use continuation patterns or wait for the range to resolve.
Mistake 7 — Ignoring the Location
Finding a perfect Bullish Engulfing formation but entering without checking whether the pattern formed at a meaningful technical level. The pattern forms mid-range, away from any support, and fails to sustain.
The fix: Pattern + location = signal. Pattern without location = noise. Always verify that the candlestick pattern is forming at a structurally significant level (support, resistance, VWAP, moving average, round number).
FAQ
Q: What are the most important candlestick patterns to learn first? Start with these five groups covering the most important bullish and bearish signals: (1) Hammer and Shooting Star for single-candle reversals, (2) Bullish Engulfing and Bearish Engulfing for two-candle reversals, (3) Morning Star and Evening Star for three-candle reversals, (4) Doji in all five types for indecision signals, and (5) Three White Soldiers and Three Black Crows for momentum continuation. These cover 90% of the important candlestick patterns that professional traders use in real markets.
Q: Which candlestick pattern is most reliable? Based on backtested data across thousands of trades, the Bullish Piercing Line has the highest individual win rate, the Morning Star and Evening Star have the highest three-candle pattern win rates (65–75%+ with proper context filters), and Three White Soldiers achieves 73.7% in trending conditions. No single pattern is "best" in all conditions — reliability depends heavily on the three context filters: trend direction, volume confirmation, and structural key level.
Q: Do candlestick patterns work for intraday trading in India? Yes, with specific considerations. Intraday patterns work best on NSE during the 9:30–11:00 AM session when institutional volume is highest. The most reliable intraday candlestick patterns are the Bullish Engulfing and Hammer at VWAP, which combine the institutional VWAP reference with visual candlestick confirmation. Patterns forming during the 11:30 AM–1:30 PM lunch lull have lower reliability on NSE due to reduced institutional participation.
Q: What is the difference between a Hammer and a Shooting Star? Both have a small body and a long wick, but the wick direction and location differ. A Hammer has a long lower wick (below the body) and appears at the bottom of a downtrend — it is a bullish reversal signal. A Shooting Star has a long upper wick (above the body) and appears at the top of an uptrend — it is a bearish reversal signal. Same visual structure, opposite meaning based entirely on trend context and wick direction.
Q: What is the best candlestick pattern for intraday trading? For Indian intraday trading, the Bullish Engulfing below VWAP, the Hammer at VWAP, and the Bearish Engulfing at VWAP are the three most actionable intraday candlestick setups. They combine institutional reference levels (VWAP) with clear visual confirmation (the pattern itself), giving both a structural reason and a timing signal for the trade. Use these on 5-minute charts during the 9:30–11:00 AM NSE session for maximum reliability.
Q: How many candlestick patterns should I learn? Focus on mastering 15–20 patterns deeply rather than memorising 100 patterns shallowly. The patterns in this guide — 23 patterns across single, double, and triple candle formations — cover every major market scenario. Understanding the psychology behind each pattern matters more than the visual memorisation. Once you understand why a Morning Star signals a reversal (three-session buyer takeover narrative), you recognise it instantly without needing to memorise the shape.
Q: Can I use candlestick patterns without other indicators? You can use candlestick patterns as your primary analysis tool (pure price action trading), but even pure price action traders use the three context filters: trend direction from chart structure, volume bars for confirmation, and structural key levels (support/resistance). The patterns themselves are your entry timing tool — the context determines whether the entry is high probability. Combining candlestick patterns with VWAP (for intraday) or moving averages (for swing trading) significantly improves reliability.
Conclusion
Candlestick patterns are the oldest surviving tool in technical analysis — 300 years old, validated by centuries of Japanese rice market trading before Western finance ever adopted them. They have endured because they measure something that does not change: the psychology of market participants expressing itself through price.
The most important candlestick patterns covered in this guide — from the single-candle Hammer and Shooting Star through the two-candle Engulfing patterns to the three-candle Morning Star and Evening Star — all tell the same fundamental story in different ways: who was in control, where control shifted, and when the balance of power changed decisively enough to create a tradeable opportunity.
Three principles to take into every session:
1. Context determines everything. A pattern without a prior trend, without a key level, without volume — is just a shape. The same pattern with all three context filters aligned is a high-probability trade.
2. Volume is non-negotiable. Every pattern in this guide becomes significantly more reliable with above-average volume confirmation. Make it a hard rule: check the volume bar before acting on any pattern.
3. Master five patterns before learning a sixth. The Hammer, Engulfing, Morning/Evening Star, Doji, and Three Soldiers patterns cover 90% of everything you will encounter in real markets. Depth of understanding beats breadth of memorisation — every time.
Start with the Hammer. Learn it until it is second nature. Add the Engulfing. Then the Morning Star. Build your pattern library one mastered concept at a time.
Further reading: Bullish Candle Anatomy: How to Read a Bullish Candlestick | Bearish Candle Anatomy: How to Read a Bearish Candlestick | Technical Analysis Mastery: The Complete Guide | How to Trade Intraday Stocks in India: The Complete Guide | RSI Trading Strategy: Complete Guide | Support and Resistance: The Complete Trading Guide | Volume Analysis Trading Strategy | Bollinger Bands Trading Strategy | Smart Money Concepts: The Complete Mastery Guide
Ready to Trade These Patterns on Real Stocks?
→ Open the Dhanith Intraday Screener — find today's NSE stocks where Hammer, Engulfing, and Morning Star setups are forming on above-average volume
→ Calculate Your Risk Before Every Pattern Trade — know your exact share count, stop distance, and maximum loss before you enter
→ Log Your Pattern Trades in the Dhanith Journal — track which patterns work best for your execution style and improve with every session
Disclaimer: This article is for educational purposes only and does not constitute financial or investment advice. Trading in stock markets involves significant risk of capital loss. Past performance of any pattern or strategy does not guarantee future results. Always use proper risk management.
Have a question about this article?
Comment on our latest Instagram post or send us a DM — we reply to every one.
@dhanith_officialWas this article helpful?
Click to rate
Founder, Dhanith Trading
7+ years trading Nifty, Bank Nifty, NSE stocks, and commodities — specializing in Smart Money Concepts (SMC) and ICT price action. Founder of Dhanith — a trading journal, intraday screener, and risk tools platform built for retail traders.
Dhanith Newsletter
Enjoyed this article? Get more like it.
New trading guides, candlestick patterns, SMC strategies, and tool updates — straight to your inbox. Free, for Indian traders.
No spam. Unsubscribe anytime.
Continue Reading