On this page
- Introduction
- Part 1: What Is the Morning Star Candlestick Pattern?
- The Three-Candle Formation
- The 50% Rule — The Most Critical Requirement
- The OHLC Psychology — Three Days of Power Transfer
- Part 2: The Morning Star Variants
- The Standard Morning Star
- The Morning Doji Star (Strongest Version)
- The Abandoned Baby (Extreme Variant)
- The Weak Morning Star (Avoid Trading)
- Part 3: The Data — Morning Star Win Rate and Statistics
- What the Research Shows
- The Confluence Effect
- Why the Morning Star Outperforms Single-Candle Patterns
- Part 4: How to Identify a Valid Morning Star — The Complete Checklist
- The 8-Point Morning Star Checklist
- Part 5: Five Complete Morning Star Trading Strategies
- Strategy 1 — Morning Star at Support (The Foundation Strategy)
- Strategy 2 — Morning Star + RSI (Oversold Confirmation)
- Strategy 3 — Morning Star + VWAP (Intraday NSE Strategy)
- Strategy 4 — Morning Star at Moving Average Support (Swing Trading)
- Strategy 5 — Morning Doji Star Variant (Maximum Power Entry)
- Part 6: Stop Loss and Target — The Complete Rules
- Stop Loss Placement
- Target Setting Rules
- Part 7: Morning Star vs. Evening Star
- Why They Are Equally Reliable
- Part 8: Morning Star on Different Timeframes
- Daily Chart — Primary Application
- Weekly Chart — Highest Institutional Weight
- 5-Minute and 15-Minute Chart — NSE Intraday
- Part 9: Common Morning Star Mistakes and Exact Fixes
- Mistake 1 — Day 3 Does Not Close Above the Day 1 Midpoint
- Mistake 2 — Ignoring Volume on Day 3
- Mistake 3 — Day 2 Is Too Large
- Mistake 4 — Trading Without a Prior Downtrend
- Mistake 5 — Stop Below Day 1's Low Instead of Day 2's Low
- Mistake 6 — Entering Before Day 3 Closes
- FAQ
- Conclusion
- Ready to Trade the Morning Star on Real Stocks?

Morning Star Candlestick Pattern: Complete Trading Guide (2026)
Master the Morning Star candlestick pattern in 2026. Learn the 3-candle structure, identification checklist, 5 proven strategies with RSI + VWAP + support, stop loss rules, targets, and the Morning Doji Star variant — with real NSE stock examples.
Introduction
Every trader who has sat through a sustained downtrend knows the feeling. Days of red candles. The chart dropping steadily lower. The news is bearish. Social media is full of fear. And every time you look at the chart, it seems there is no end in sight.
Then three specific candles appear — in sequence, over three sessions — and everything changes.
The first candle is a large bearish red candle confirming the downtrend. The second candle is small and indecisive — almost a Doji — sitting between the darkness above and the recovery below. The third candle is a large, confident green candle that erases more than half of the first candle's decline and closes with conviction.
That three-candle sequence is the Morning Star — and its name is deliberate. Just as the morning star appears in the sky before dawn as the first sign that night is ending, this candlestick pattern appears at the bottom of downtrends as the first significant evidence that the selling is exhausting and buyers are taking control.
The Morning Star candlestick pattern is one of the most powerful and most reliable three-candle reversal patterns in technical analysis. An extensive study of over 4.7 million candles found that a Morning Star pattern predicted a reversal 78% of the time when properly identified in context. Several studies have repeatedly found that this pattern, when used alongside trend context, support and resistance, and other indicator confluences, gives one of the highest success rates among all candlestick patterns.
This guide covers the complete Morning Star framework — from the precise three-candle identification rules to five complete trading strategies with exact entry, stop, and target rules — along with the Morning Doji Star variant, the comparison with the Evening Star, and every common mistake with exact fixes.
TL;DR — Key Takeaways
- The Morning Star is a three-candle bullish reversal pattern: large bearish candle (Day 1), small indecision candle (Day 2 — "the star"), large bullish candle (Day 3)
- An extensive study of 4.7 million candles found a 78% reversal prediction rate in context — one of the highest of any candlestick pattern
- The "star" (Day 2) is the most important candle — its small body signals the end of seller momentum and the beginning of the buyer-seller power transition
- Day 3 must close above the midpoint (50%) of Day 1's body — this is the non-negotiable confirmation requirement
- Volume must expand significantly on Day 3 — this confirms institutional buying, not just retail hope
- Five strategies: Morning Star at Support, Morning Star + RSI, Morning Star + VWAP (NSE intraday), Morning Star + Moving Average, Morning Doji Star Variant
- Stop loss: below the low of Day 2 (the star candle) — this is the logical invalidation point
- Target: minimum 50% retracement of the prior downtrend; primary target is the previous swing high
Part 1: What Is the Morning Star Candlestick Pattern?
The Three-Candle Formation
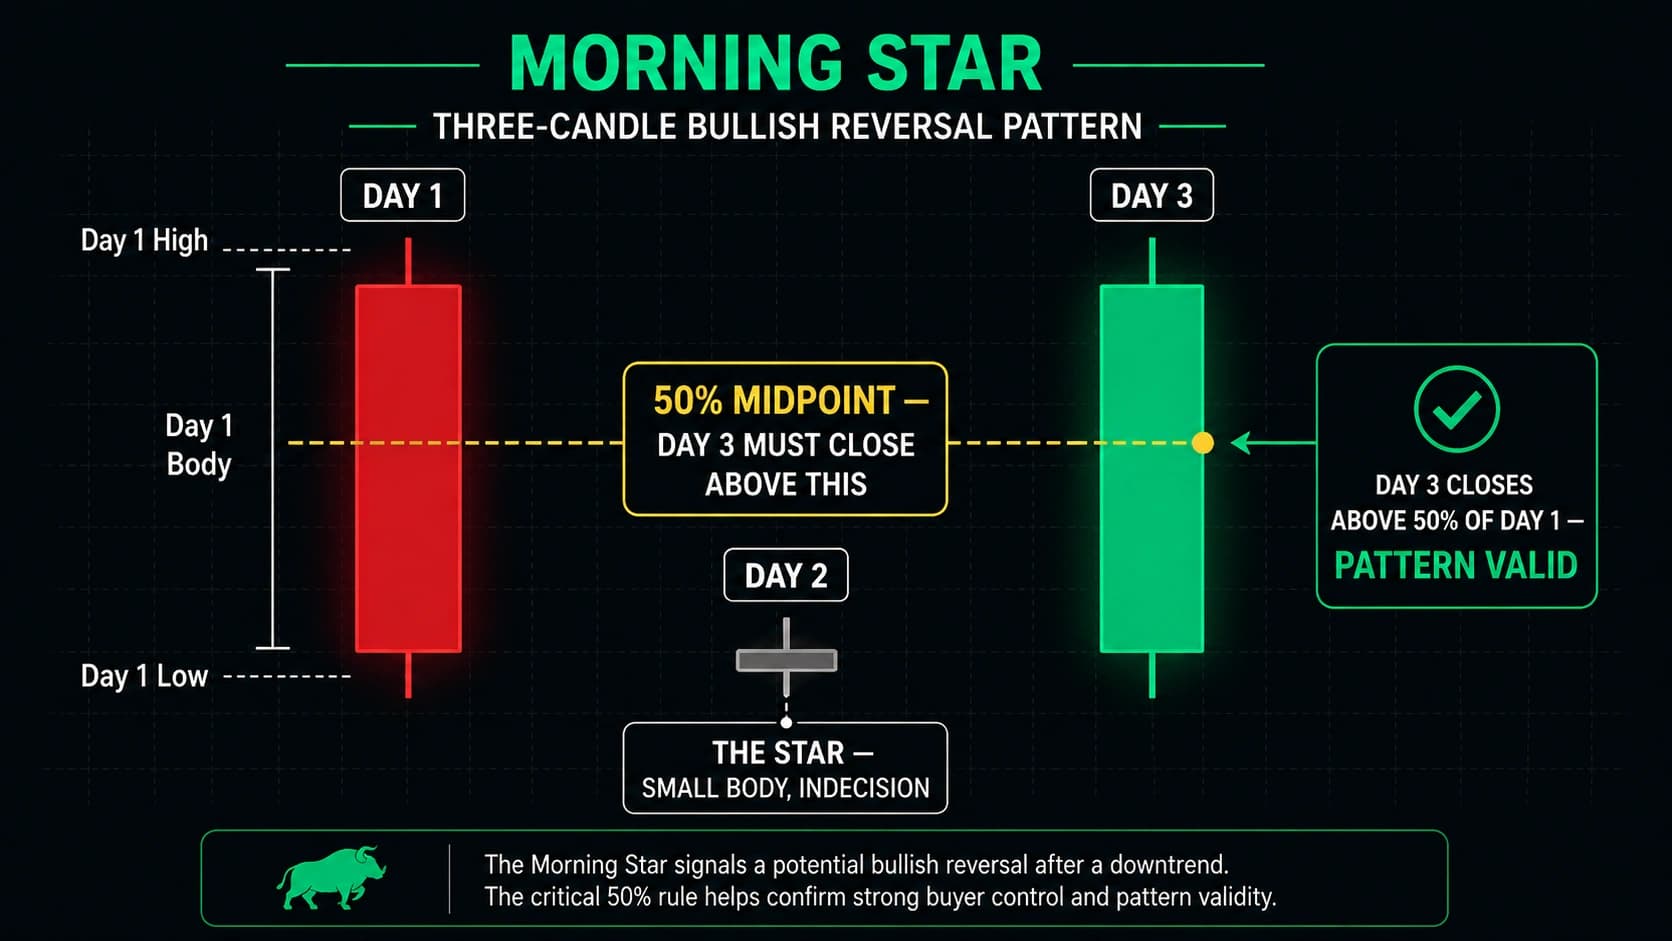
The Morning Star pattern is a three-candle bullish reversal formation that appears after a downtrend. Each candle plays a specific and deliberate role in the story of power transfer from sellers to buyers.
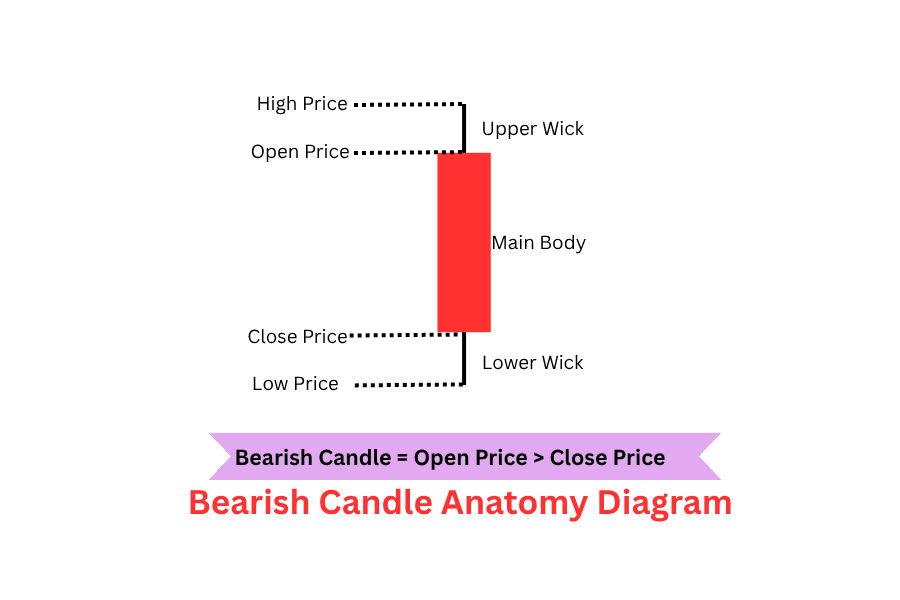
Candle 1 — The Bearish Confirmation: A large bearish (red) candle continuing the established downtrend. This candle confirms that sellers are in full control — the body should be large and confident, representing decisive seller dominance. It sets the stage by confirming the trend that is about to reverse.
Candle 2 — The Star (Indecision): A small-bodied candle — the most important of the three. This candle:
- Has a significantly smaller body than Candle 1
- Can be bullish or bearish in body colour
- Often has wicks on both sides
- Represents complete indecision — neither buyers nor sellers dominate
- Often gaps down from Candle 1's close (particularly on daily charts in Indian markets)
The name "star" comes from the visual appearance: this small candle looks like a small star sitting between the large bearish candle on the left and the large bullish candle on the right.
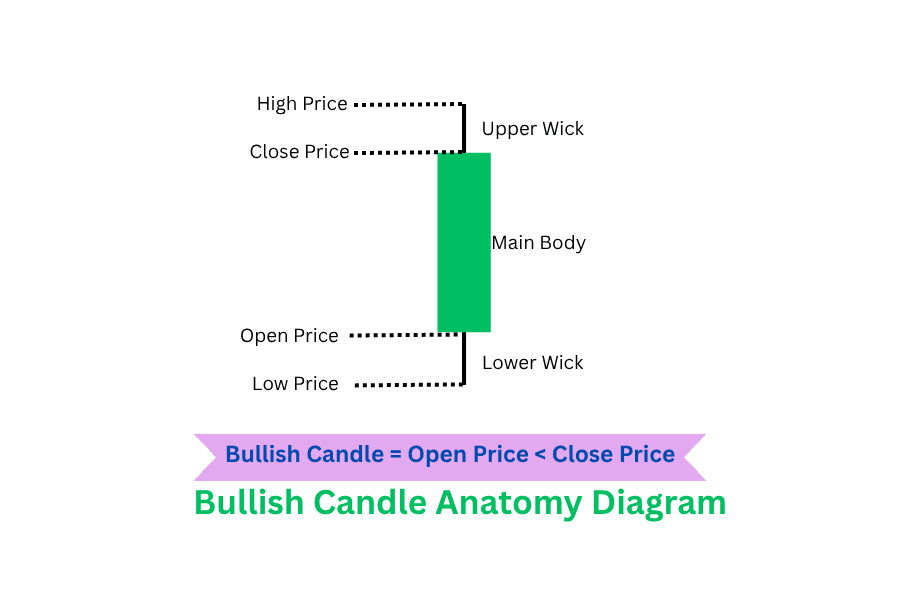
Candle 3 — The Bullish Confirmation: A large bullish (green) candle that:
- Opens above or near Candle 2's close
- Rises strongly throughout the session
- Closes above the midpoint of Candle 1's body (the 50% level)
- Ideally closes as high as possible — near the top of its range
- Comes with significantly expanded volume
The 50% Rule — The Most Critical Requirement
Candle 3 must close above the midpoint of Candle 1's body. This is the single most important mathematical requirement of the Morning Star.
The midpoint of Candle 1's body is calculated as:
Midpoint = Candle 1 Open − ((Candle 1 Open − Candle 1 Close) ÷ 2)
If Candle 1 opened at ₹500 and closed at ₹460, the midpoint is ₹480. Candle 3 must close above ₹480.
Why the 50% rule matters: The midpoint represents the halfway recovery of Candle 1's decline. A Candle 3 that recovers less than 50% of Candle 1 means buyers have not yet demonstrated dominance — they have merely slowed the selling. A Candle 3 that recovers more than 50% — particularly one closing in the upper third of Candle 1's range — shows decisive buyer control.
The deeper Candle 3 penetrates into Candle 1's body, the more powerful the Morning Star signal. A Candle 3 that closes above Candle 1's open (100% recovery) is the strongest possible version.
The OHLC Psychology — Three Days of Power Transfer
Day 1 psychology: Fear and selling pressure dominate. The downtrend continues aggressively. Anyone still holding long positions is losing confidence. The large bearish candle is the visual expression of widespread panic selling.
Day 2 psychology: Something changes. Sellers try to continue the decline but encounter resistance. Buyers begin to absorb the selling pressure. The result is a small candle where neither side wins — complete indecision. The "star" represents the moment where the seller army runs out of momentum and the first buyers begin to appear.
Day 3 psychology: Buyers take decisive control. The strong green close — erasing more than half of Day 1's decline — signals that the transition is complete. Those who were short are now covering (adding buying pressure). New buyers are entering aggressively. The Morning Star announces: the night is ending.
Pro Tip: The most powerful Morning Stars have a Day 2 that gaps below Day 1's close on both sides — a gap down from Day 1 and a gap up to Day 3. These gaps isolate Day 2 in its own price island, creating what is technically called the "Morning Doji Star" variant. When gaps appear on both sides of Day 2, the pattern signals a more complete and sudden shift in sentiment — and typically produces sharper and more sustained rallies.
Part 2: The Morning Star Variants
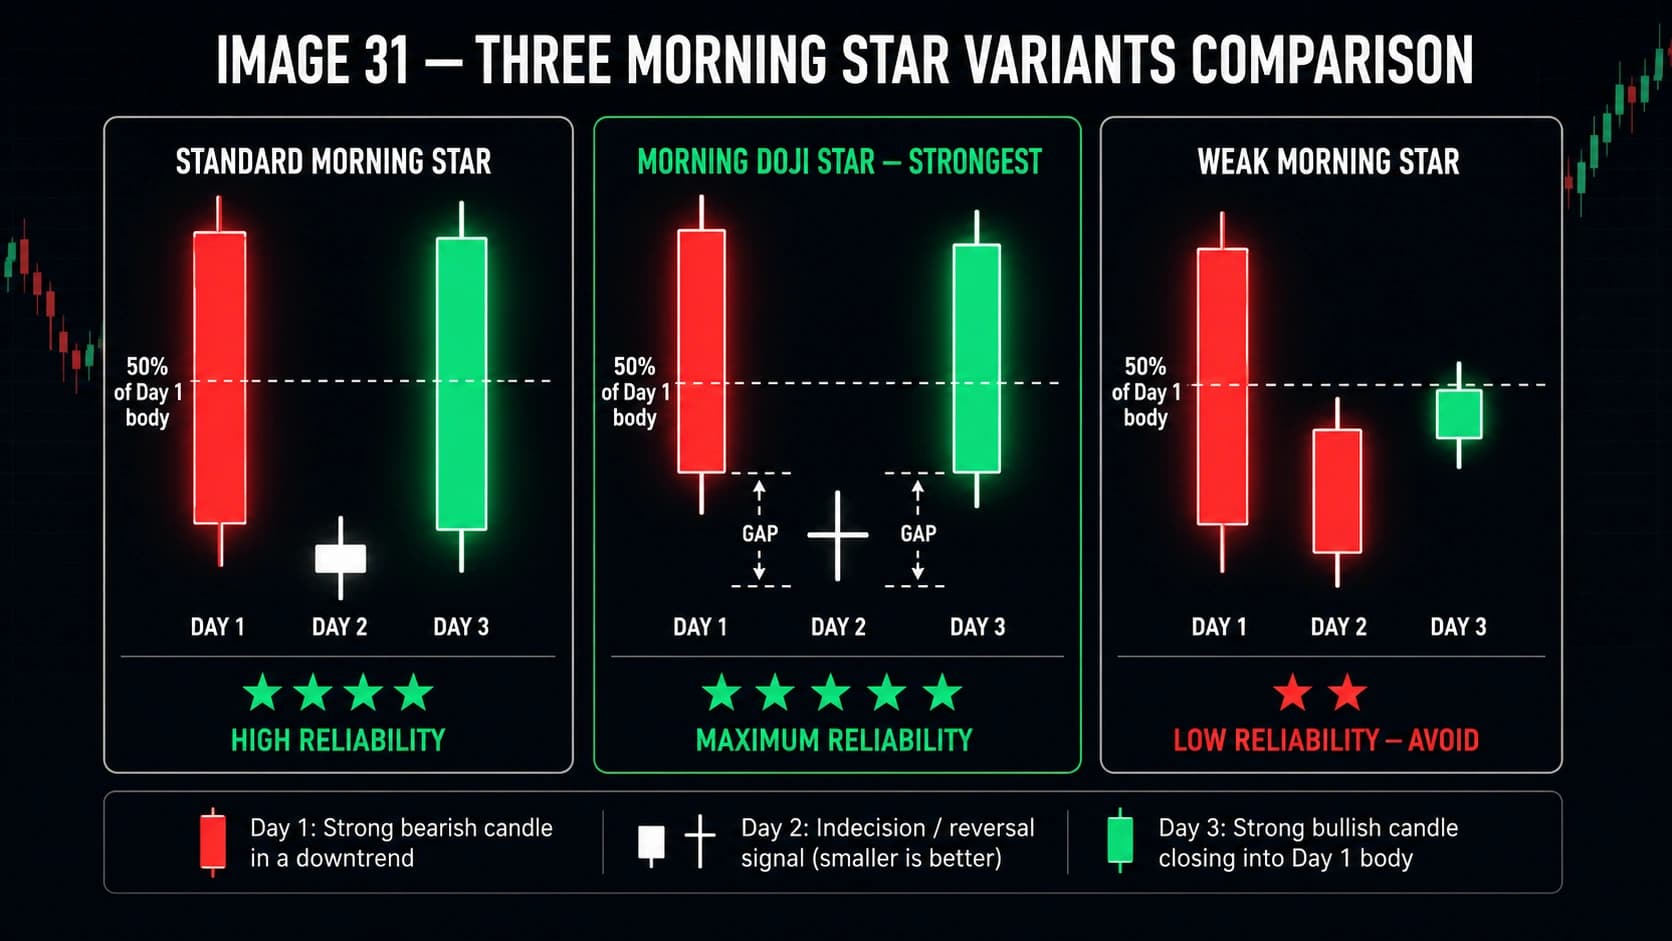
The Standard Morning Star
The most common version where Day 2 has a small but visible body. The body can be bullish or bearish — colour is irrelevant for pattern validity. What matters is that Day 2's body is significantly smaller than both Day 1 and Day 3, representing the pause in directional momentum.
Signal strength: High
The Morning Doji Star (Strongest Version)
When Day 2 is specifically a Doji — where the Open and Close are at almost exactly the same price — the pattern becomes the Morning Doji Star.
The Doji on Day 2 shows perfect equilibrium — the exact moment where buying and selling forces are equal. Combined with the large bearish candle before it and the large bullish candle after it, the Doji represents the precise pivot point of the reversal. The sellers had complete control (Day 1), then found perfect equilibrium (Day 2 Doji), then buyers took complete control (Day 3).
Signal strength: Maximum — the Morning Doji Star is the most powerful version of this pattern. The complete indecision on Day 2 followed by the decisive buyer takeover on Day 3 produces the strongest statistical reversal signal.
The Abandoned Baby (Extreme Variant)
The rarest and most powerful variant. Both sides of Day 2 have gaps — a gap below Day 1 (the star gaps below Day 1's close) AND a gap above Day 3 (Day 3 opens above Day 2's close). Day 2 is completely isolated, surrounded by empty space.
The complete gap isolation of Day 2 represents an extraordinary psychological moment — sellers abandoned the downtrend so completely and buyers embraced the recovery so enthusiastically that no overlapping trades occurred in either direction.
Signal strength: Maximum — the Abandoned Baby is considered one of the most reliable single reversal signals in candlestick analysis. Rare on daily charts but more common in Indian markets where overnight gaps occur regularly.
The Weak Morning Star (Avoid Trading)
Day 3 closes below the midpoint of Day 1's body. The visual structure exists (three candles, small Day 2) but the buyer strength is insufficient to qualify the pattern.
A Candle 3 close below the Day 1 midpoint signals that buyers tried but failed to demonstrate full control. This version produces significantly lower win rates and should be classified as a "failed reversal attempt" requiring additional days of confirmation before acting.
Part 3: The Data — Morning Star Win Rate and Statistics
What the Research Shows
An extensive study of over 4.7 million candles found that a Morning Star pattern predicted a reversal 78% of the time in bull market conditions with proper context. This is one of the highest documented win rates of any candlestick pattern when properly filtered.
The key qualifier is "with proper context." The Morning Star at a major support level after a 10+ session downtrend, with Day 3 volume significantly above average, achieves these top-tier win rates. The same three-candle visual structure in the middle of a trading range, without volume confirmation, without a prior downtrend, achieves results much closer to random.
The Confluence Effect
| Morning Star Configuration | Win Rate (Approximate) |
|---|---|
| Standalone (no context filters) | 55–60% |
| After confirmed downtrend (7+ sessions) | 63–68% |
| At recognised support level | 68–72% |
| With above-average volume on Day 3 | 70–75% |
| With RSI below 40 (oversold) | 72–76% |
| All filters: downtrend + support + volume + oversold RSI | 75–78% |
| Morning Doji Star + all filters | 76–80%+ |
The progression is clear: each additional filter adds measurable probability. The fully filtered Morning Doji Star at a major support with volume and RSI confirmation is among the highest-probability single setups available to retail traders.
Why the Morning Star Outperforms Single-Candle Patterns
Three-candle patterns inherently contain more information than single-candle patterns. The Morning Star requires:
- A downtrend to reverse (context)
- A confirmed momentum pause (Day 2 — the star)
- A confirmed buyer takeover (Day 3 — the reversal candle)
This three-session confirmation requirement filters out many of the false signals that single-candle patterns produce. By Day 3's close, the reversal has been confirmed by three consecutive sessions of market behaviour — not just one session's price action.
Part 4: How to Identify a Valid Morning Star — The Complete Checklist
The 8-Point Morning Star Checklist
Check 1 — Prior Downtrend: A definite downtrend must be present before this pattern forms. At minimum, 5–7 consecutive bearish sessions. The stronger and more established the prior downtrend, the more meaningful the reversal signal.
Check 2 — Candle 1 Is a Large Bearish Candle: Day 1 must be a clearly bearish candle with a substantial body. Small or ambiguous Day 1 bodies weaken the pattern significantly — the contrast between the large bearish Day 1 and the small Day 2 is part of what makes the pattern visually and psychologically significant.
Check 3 — Candle 2 Is Significantly Smaller Than Candle 1: Day 2's body must be visibly smaller than Day 1's body — ideally less than 50% of Day 1's body size. A Day 2 that is nearly as large as Day 1 lacks the indecision required for a genuine Morning Star.
Check 4 — Candle 2 Sits Below Candle 1 (Low Range): Day 2 should trade in the lower portion of the overall range — ideally gapping below Day 1's close (on daily charts) or simply opening at a lower level. This downward position of the "star" shows that selling continued briefly before indecision set in.
Check 5 — Candle 3 Is a Large Bullish Candle: Day 3 must be clearly bullish — a large green body with the close near the session high. A small or ambiguous Day 3 body weakens the pattern.
Check 6 — Candle 3 Closes Above the Midpoint of Candle 1: The non-negotiable mathematical requirement. Day 3's close must be above the 50% level of Day 1's body. Calculate the midpoint and verify the close exceeds it. If it doesn't, the pattern is not a valid Morning Star.
Check 7 — Volume Expansion on Candle 3: Volume must be noticeably higher on Day 3 than on Day 1 or Day 2 — ideally 1.5× to 2× the 20-period average. Volume expansion confirms institutional buying, not just retail optimism. Without volume, the Day 3 bounce may be temporary.
Check 8 — Key Level Proximity: The pattern forms at or near a significant support level: prior swing low, round number, moving average support, Fibonacci retracement level, or an SMC order block/FVG in the discount zone. Location validates the structural reason for buyers to appear.
Minimum for trading: Checks 1, 5, 6, and 7 are mandatory. With all eight, the setup is Grade A.
Part 5: Five Complete Morning Star Trading Strategies
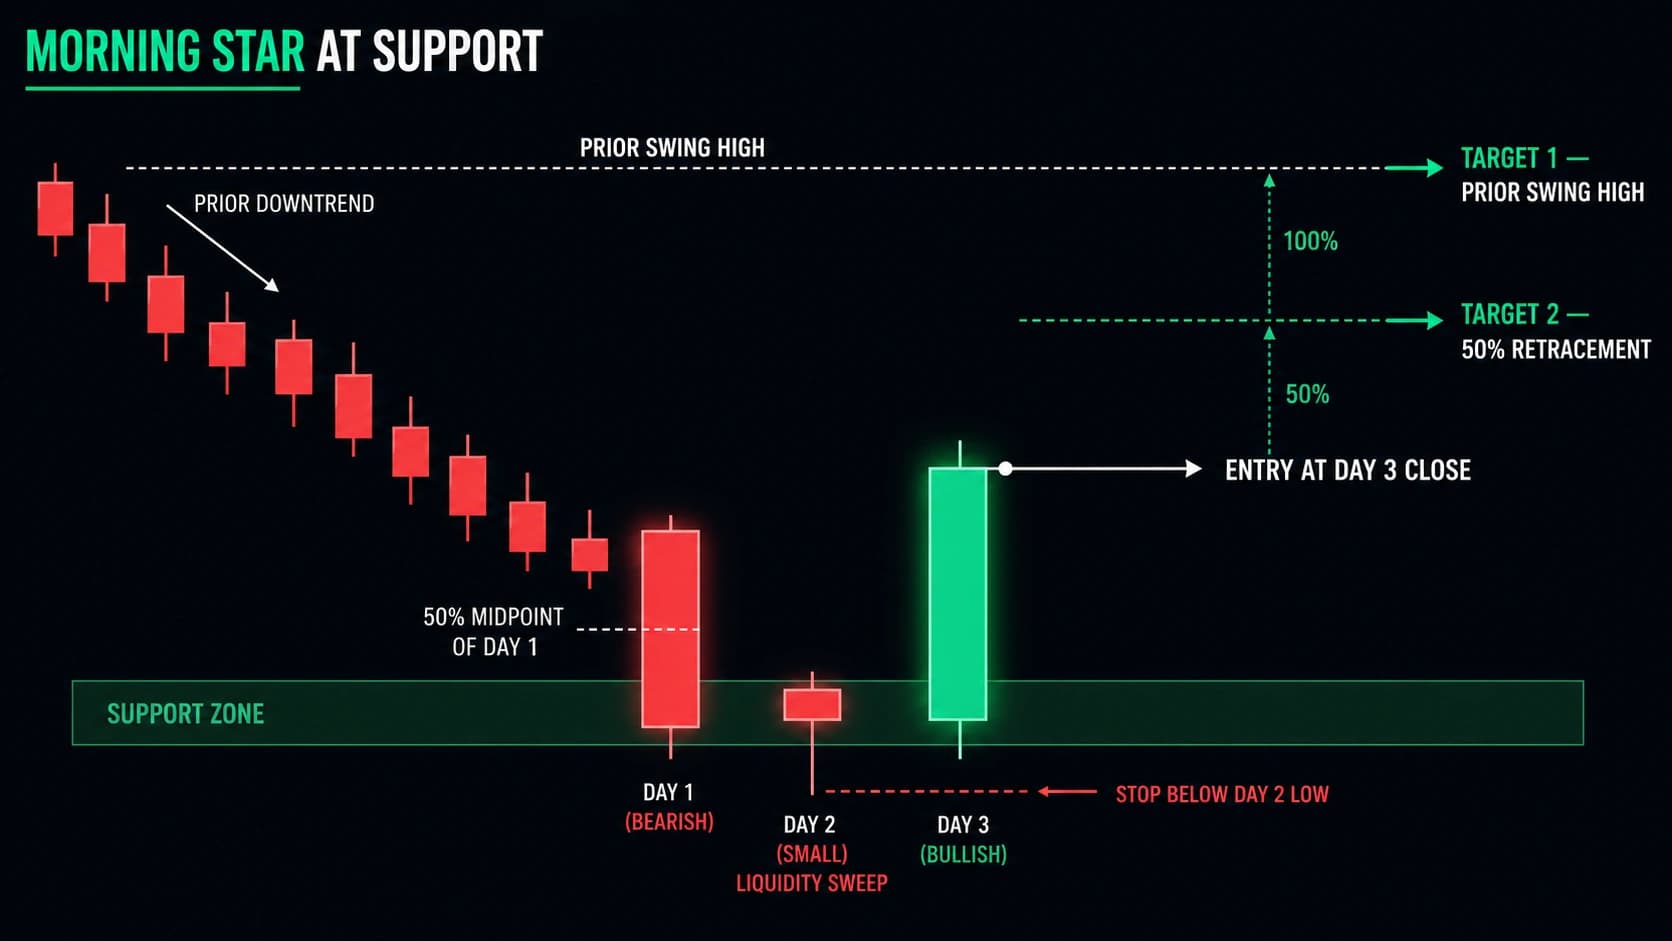
Strategy 1 — Morning Star at Support (The Foundation Strategy)
The most reliable Morning Star strategy and the most widely traded version. The support level provides the structural reason for buyers to appear; the Morning Star provides the visual confirmation that they have.
A Morning Star pattern will often appear near an important support level because these are areas of the market that have attracted buying activity in the past.
Setup conditions:
- Identify a significant support level on the daily chart (prior swing low, horizontal support zone, round number)
- Price declines toward this support over 7+ sessions
- The Morning Star forms as price reaches the support zone — ideally with Day 2 sitting exactly at or briefly below the support
- The Day 1 or Day 2 low briefly penetrates below the support (liquidity sweep of stop orders below the level) before Day 3 recovers above it
- Volume on Day 3 is significantly above average
Why the brief penetration below support makes the pattern stronger: When the Morning Star's Day 2 (or Day 1's closing low) briefly dips below a key support level, it triggers the stop losses of traders who placed stops just below the support. This forced selling provides additional downward price pressure — but when buyers step in and Day 3 closes strongly above the support, the pattern confirms that buyers overwhelmed not just normal selling pressure but also the surge of triggered stop orders. This double-confirmation of buyer strength is what makes the support-penetrating Morning Star particularly powerful.
Entry:
- Standard: At the close of Day 3 (after confirming it meets the 50% requirement)
- Conservative: At the open of Day 4 — confirms the reversal held through the night
Stop Loss: Below the low of Day 2 (the star candle). Patient traders who wait for Candle 3 to close past Candle 1's midpoint, size positions at 1–2% risk, and place stops below Candle 2's low consistently extract the best risk-reward from morning star setups.
Target:
- Take Profit 1: The previous swing high (where the current downtrend began)
- Take Profit 2: 50% retracement of the prior downtrend (minimum standard)
Real NSE example (conceptual): A Nifty 50 stock declines from ₹750 to ₹640 over 9 sessions. Key support at ₹640 (prior swing low). Day 1: closes at ₹638 (briefly below support). Day 2: small Doji at ₹637, the star. Day 3: opens at ₹641, rallies strongly to close at ₹668 (above the midpoint of Day 1 at ₹655). Volume on Day 3: 2.1× the 20-day average.
- Entry: ₹668 (Day 3 close)
- Stop: ₹633 (below Day 2 low)
- Risk: ₹35 per share
- Target: ₹720 (prior swing high) — ₹52 above entry
- Risk-Reward: 1.49:1 — borderline; look for a prior swing high that provides at least 2:1
Pro Tip: The Morning Star is most reliable at the third or later test of a support level. The first test of support collects the most cautious buyers. The second test tests the conviction of both buyers and sellers. By the third test — when retail traders have nearly given up on the support — institutional buyers step in decisively, producing the large Day 3 volume and close that makes the Morning Star actionable.
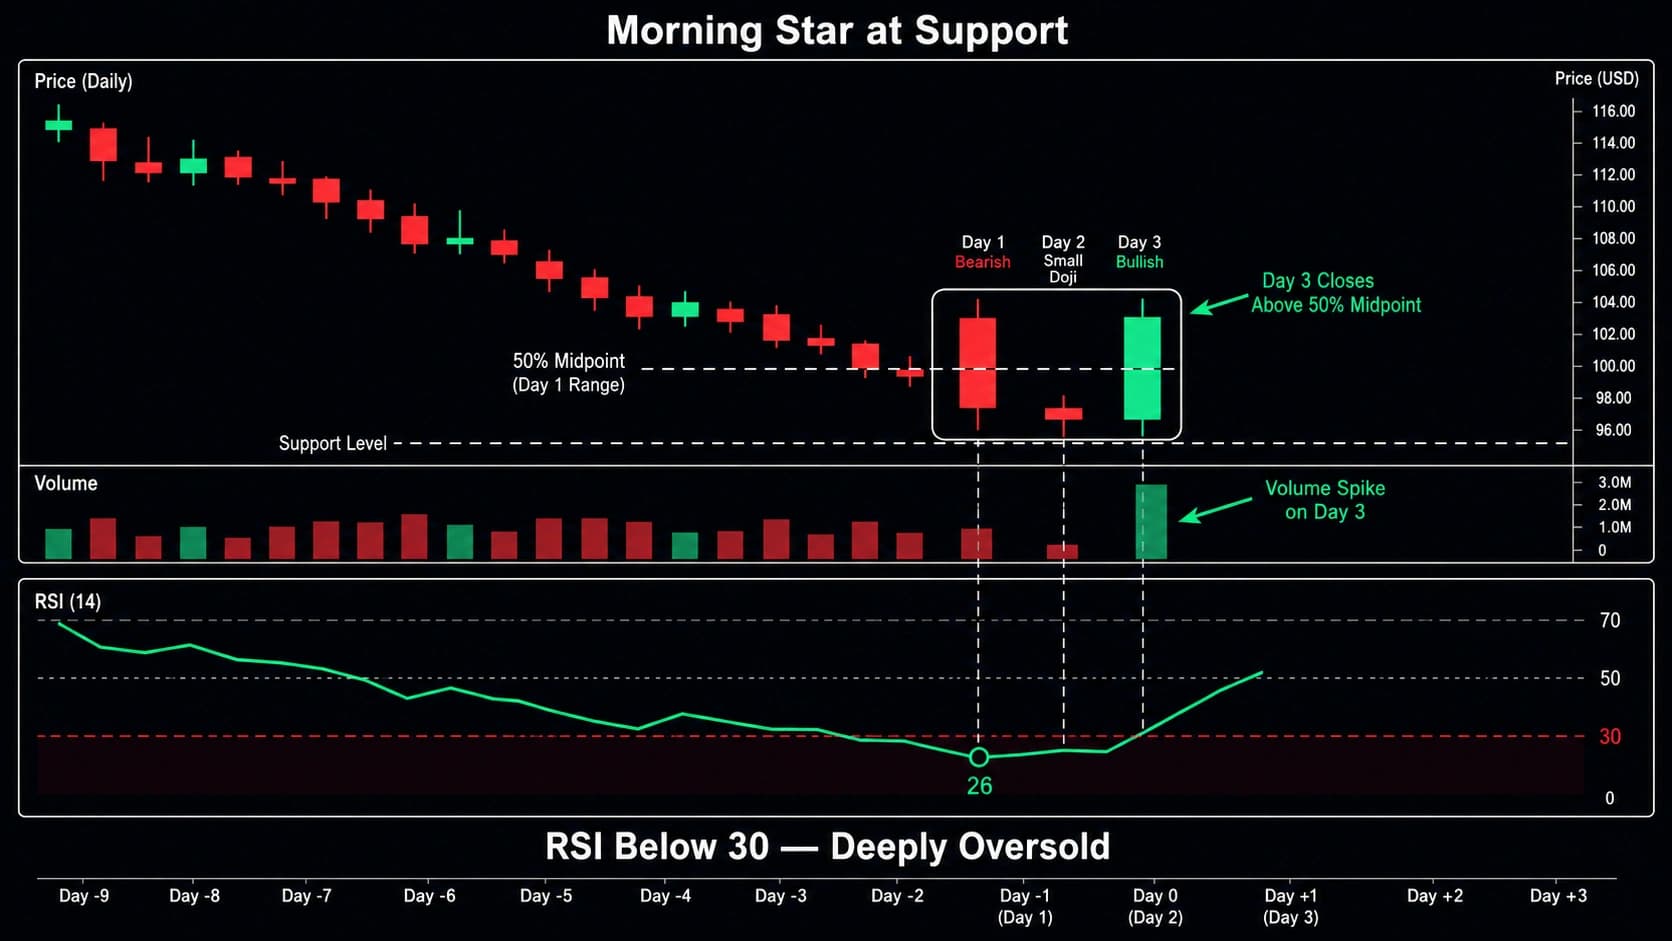
Strategy 2 — Morning Star + RSI (Oversold Confirmation)
Adding RSI to the Morning Star setup provides an independent momentum confirmation that the selling has reached a statistically extreme level — making a reversal more probable regardless of the candle pattern.
Two RSI configurations:
Configuration A — RSI Below 30 (Deeply Oversold): When RSI drops below 30 at the time the Morning Star forms, two independent measurements confirm the same thesis: selling has reached an extreme (RSI < 30) and the three-candle structure shows it is ending (Morning Star). The combination pushes the probability substantially above either signal alone.
Configuration B — RSI Positive Divergence: Price makes a new low (during the Morning Star formation or in the days leading to it). RSI makes a higher low — it did not confirm the new price extreme. This divergence shows that underlying selling momentum was weakening before the Morning Star even appeared. The three-candle formation is the price action confirmation of what RSI's divergence already implied.
Entry: At the close of Day 3
Stop: Below Day 2's low
Targets:
- RSI returning to 50 as a momentum reference
- Previous swing high as the price target
Post-entry RSI management: Once in the trade, if RSI crosses above 50, bullish momentum has firmly shifted. Consider trailing the stop behind each new swing low for extended moves.
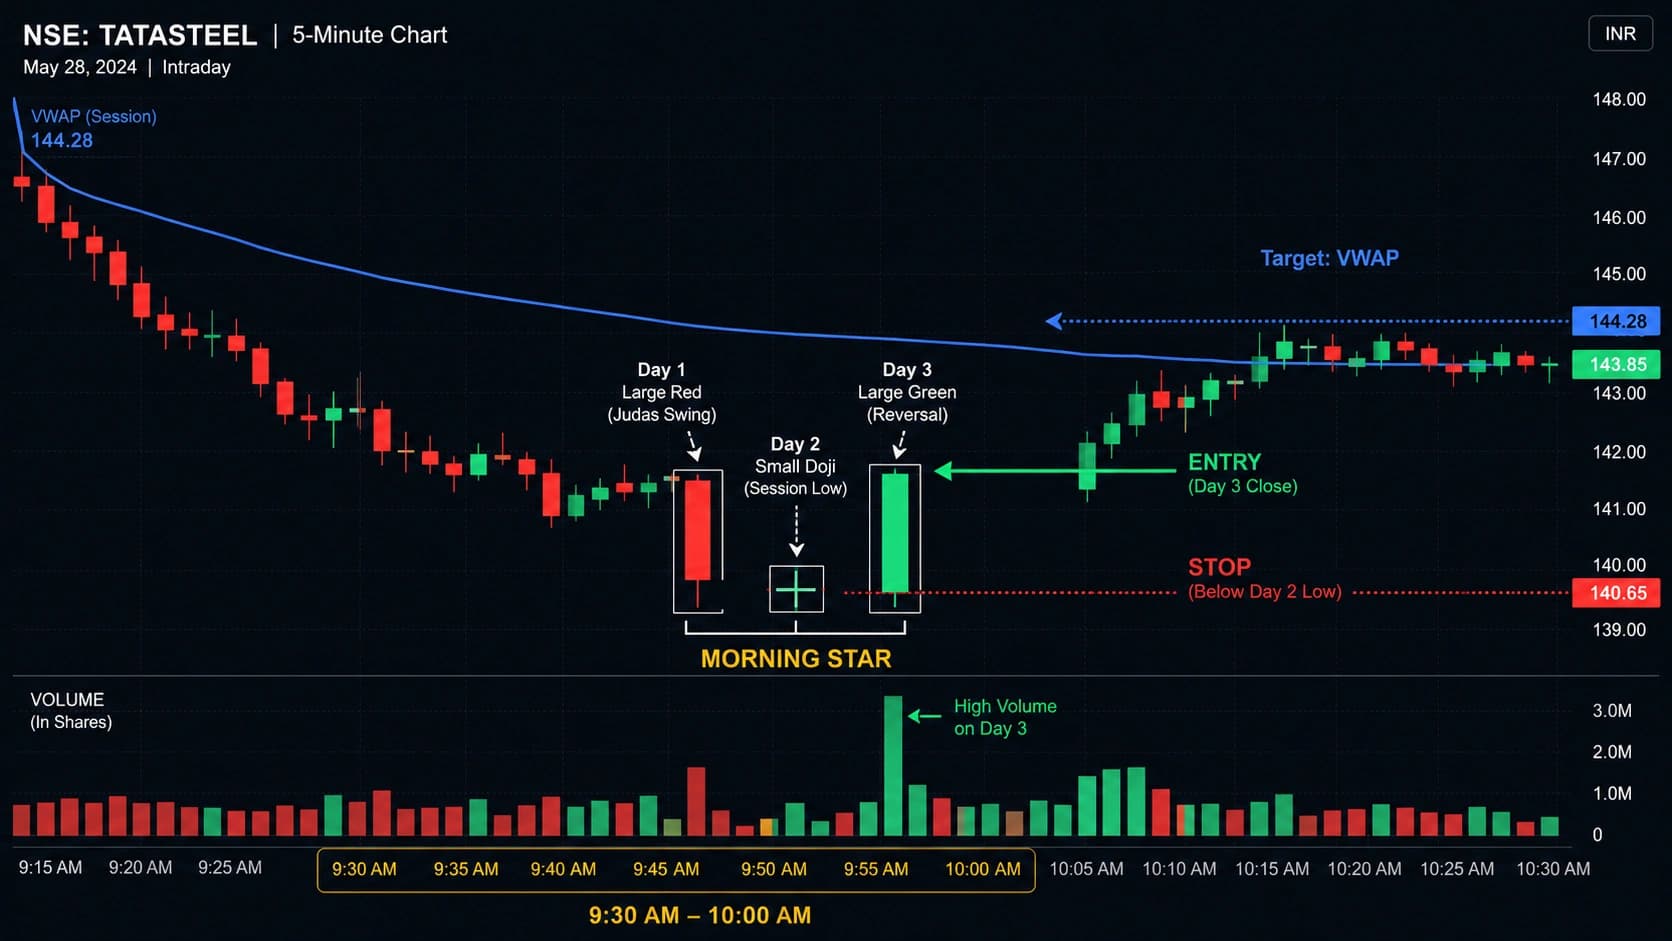
Strategy 3 — Morning Star + VWAP (Intraday NSE Strategy)
For Indian intraday traders, a Morning Star pattern below VWAP provides a powerful three-candle bullish reversal signal during the intraday session — particularly when the pattern forms during the AMD cycle's post-manipulation phase.
The intraday Morning Star below VWAP:
In the AMD intraday cycle, after the Judas Swing manipulation phase drives price below VWAP, the real distribution begins from below VWAP back toward and above it. A three-candle Morning Star that forms below VWAP during this post-sweep phase — with Day 3 pushing back above VWAP — represents the intraday equivalent of the daily Morning Star at support.
Setup conditions:
- Daily bias is bullish (GIFT Nifty positive, FII net buyers, sector aligned)
- Stock from the Dhanith Intraday Screener (high momentum, volume breakout confirmed)
- Opening Judas Swing has driven price below VWAP (manipulation phase complete)
- On the 5-minute chart, a three-candle Morning Star forms below VWAP:
- Day 1: Large bearish 5-min candle below VWAP
- Day 2: Small indecision candle at the post-sweep low
- Day 3: Strong bullish candle closing back above VWAP or into the VWAP zone
- Day 3 volume significantly above session average
Timeframe: 5-minute chart
Entry: At the close of Day 3 (the bullish candle pushing back above or toward VWAP)
Stop: Below Day 2's low (the lowest point of the three-candle pattern)
Target: VWAP as first target; previous intraday high as second target. Minimum 2:1 risk-reward.
Session timing: This setup is most reliable in the 9:45–10:30 AM window — after the opening Judas Swing has completed and the distribution phase is beginning.
The Dhanith Intraday Screener pre-filters the NSE stocks where these intraday Morning Star setups appear with the highest momentum and follow-through. Find your candidates before the session opens — so you're ready when the pattern forms.
Strategy 4 — Morning Star at Moving Average Support (Swing Trading)
Moving averages act as dynamic support during established uptrends. When price corrects down to the 20 EMA, 50 SMA, or 200 SMA and forms a Morning Star, it signals the correction is ending and the primary trend is resuming.
The key moving average levels:
20 EMA — Momentum uptrend support: In a strong uptrend, the 20 EMA catches every meaningful correction. A Morning Star at the 20 EMA is a momentum re-entry signal — the strongest hands (institutions) have defended the trend at the standard pullback level.
50 SMA — Intermediate trend support: In a medium-term uptrend, the 50 SMA provides support during deeper corrections. A Morning Star here signals the medium-term trend is intact and the deeper correction has found institutional buyers.
200 SMA — Long-term trend support: The most powerful Morning Star location. When a stock has been in a long-term uptrend and corrects all the way to the 200 SMA, a Morning Star at this level — the most widely watched moving average in global finance — with above-average volume signals that long-term institutional buyers are defending the trend.
Setup conditions:
- Stock in an established uptrend (higher highs and higher lows on the daily chart)
- Price corrects toward the 20 EMA, 50 SMA, or 200 SMA
- A Morning Star forms at the moving average — ideally with Day 2 touching or briefly closing below the moving average before Day 3 recovers above it
- Volume on Day 3 is above average
- RSI has pulled back to 40–55 (healthy correction within uptrend, not breakdown)
Entry: At the close of Day 3
Stop: Below Day 2's low (and below the moving average — if price closes below the MA, the trend support is broken)
Target: Most recent swing high above. In strong trends, consider the next Fibonacci extension level.
| Moving Average | Trend Context | Signal Power | When to Use |
|---|---|---|---|
| 20 EMA | Strong short-term uptrend | High | Aggressive momentum re-entry |
| 50 SMA | Moderate medium-term uptrend | Very High | Standard swing trade entry |
| 200 SMA | Long-term uptrend correction | Maximum | Rare but highest conviction |
Strategy 5 — Morning Doji Star Variant (Maximum Power Entry)
The Morning Doji Star — where Day 2 is specifically a Doji — is the strongest, rarest, and most high-conviction version of the Morning Star. When Day 2 is a true Doji (Open = Close), the indecision on Day 2 is complete and absolute, making Day 3's decisive buyer takeover particularly significant.
Identification requirements for the Morning Doji Star:
- All standard Morning Star requirements apply
- Day 2 must be a genuine Doji — Open and Close are at the same or nearly the same price
- Ideally, Day 2 gaps below Day 1's close AND Day 3 opens above Day 2's close — creating gap isolation of the Doji
- Day 3 closes deep into Day 1's body — above the midpoint (50%) and ideally in the upper third
Why the Doji makes it stronger: The Doji on Day 2 shows perfect market equilibrium — the exact mathematical moment where buyers and sellers are precisely balanced. After the overwhelming seller dominance of Day 1, this perfect balance is profound: it means sellers have exhausted themselves completely. Not just slowing — completely balanced. When Day 3 then shows decisive buyer control, the contrast with Day 2's perfect equilibrium and Day 1's seller dominance makes the three-session reversal narrative completely compelling.
Entry: Same as standard Morning Star — at Day 3's close
Stop: Below Day 2's low (the Doji's low — which is also the lowest point of the entire pattern in most cases)
Target: Previous swing high. Given the Morning Doji Star's higher win rate, consider using a slightly more aggressive position size within your risk management framework.
The Abandoned Baby upgrade: When the Morning Doji Star also has gaps on both sides of Day 2 (true Abandoned Baby), the pattern achieves maximum strength. In Indian equity markets, overnight gaps from positive global cues frequently create these gap-isolated Doji formations. When the Doji is gap-isolated and the pattern appears at a major support level — that is a high-priority, maximum-conviction setup.
Part 6: Stop Loss and Target — The Complete Rules
Stop Loss Placement
The universal Morning Star stop loss rule: Place your stop loss below the low of Day 2 (the star candle) — the lowest point the pattern touched during its indecision phase — with a small buffer.
While trading a Morning Star candlestick pattern, place your stop-loss just below the low of the second candle of the pattern because if price drops below this candle, the pattern has failed.
Why Day 2's low is the correct stop level:
Day 2 (the star) represents the turning point of the pattern — the moment where seller momentum paused and the power transition began. If price drops back below Day 2's low after the Morning Star has formed, it means:
- The buyer surge of Day 3 was temporary
- Sellers have regained enough force to push below the indecision zone
- The reversal has failed
- The downtrend may be resuming
Placing the stop below Day 2's low ensures you exit the trade precisely when the logical basis for being in it (the turning point has held) is invalidated.
Alternative stop placement — below the pattern's overall low: Some traders place the stop below the lowest wick of the entire three-candle pattern (which may be Day 1's low in some cases). This is slightly wider but provides extra buffer against wicks that briefly dip below Day 2's low before the recovery continues.
Buffer sizing for NSE stocks:
- Large-cap NSE stocks: 0.2–0.3% below Day 2's low
- Mid-cap stocks: 0.3–0.5% buffer
- 5-minute intraday chart: 0.3–0.5% of stock price below Day 2's low
Target Setting Rules
Primary target — previous swing high: The level from which the current downtrend began. This is the first significant supply (sellers) above the current price and the natural first target for the Morning Star recovery.
A common strategy is to place your take-profit target at the previous resistance level or swing high. This level represents where the trend shifted from bullish to bearish — and the target of the Morning Star recovery.
Secondary target — full downtrend retracement: For stocks in established uptrends where the Morning Star appears as a pullback correction entry, the full retracement of the downtrend — returning to and exceeding the prior high — is the ultimate target.
Minimum risk-reward: 2:1. The distance from Day 3 close to Day 2 low (your stop) is the risk. The distance from Day 3 close to the previous swing high is the reward. If the ratio is below 2:1, either the stop is too wide or the target is too close. Both conditions call for skipping the trade.
Scale-out approach:
- At 1:1 (risk covered): Close 25% of position, move stop to breakeven
- At 2:1: Close another 40%
- Let remaining 35% run with trailing stop below each new swing low
Calculate your exact position size before entering any Morning Star trade. Use the Dhanith Risk Management Calculator — enter your stop distance and account size to get your exact share count and maximum loss instantly.
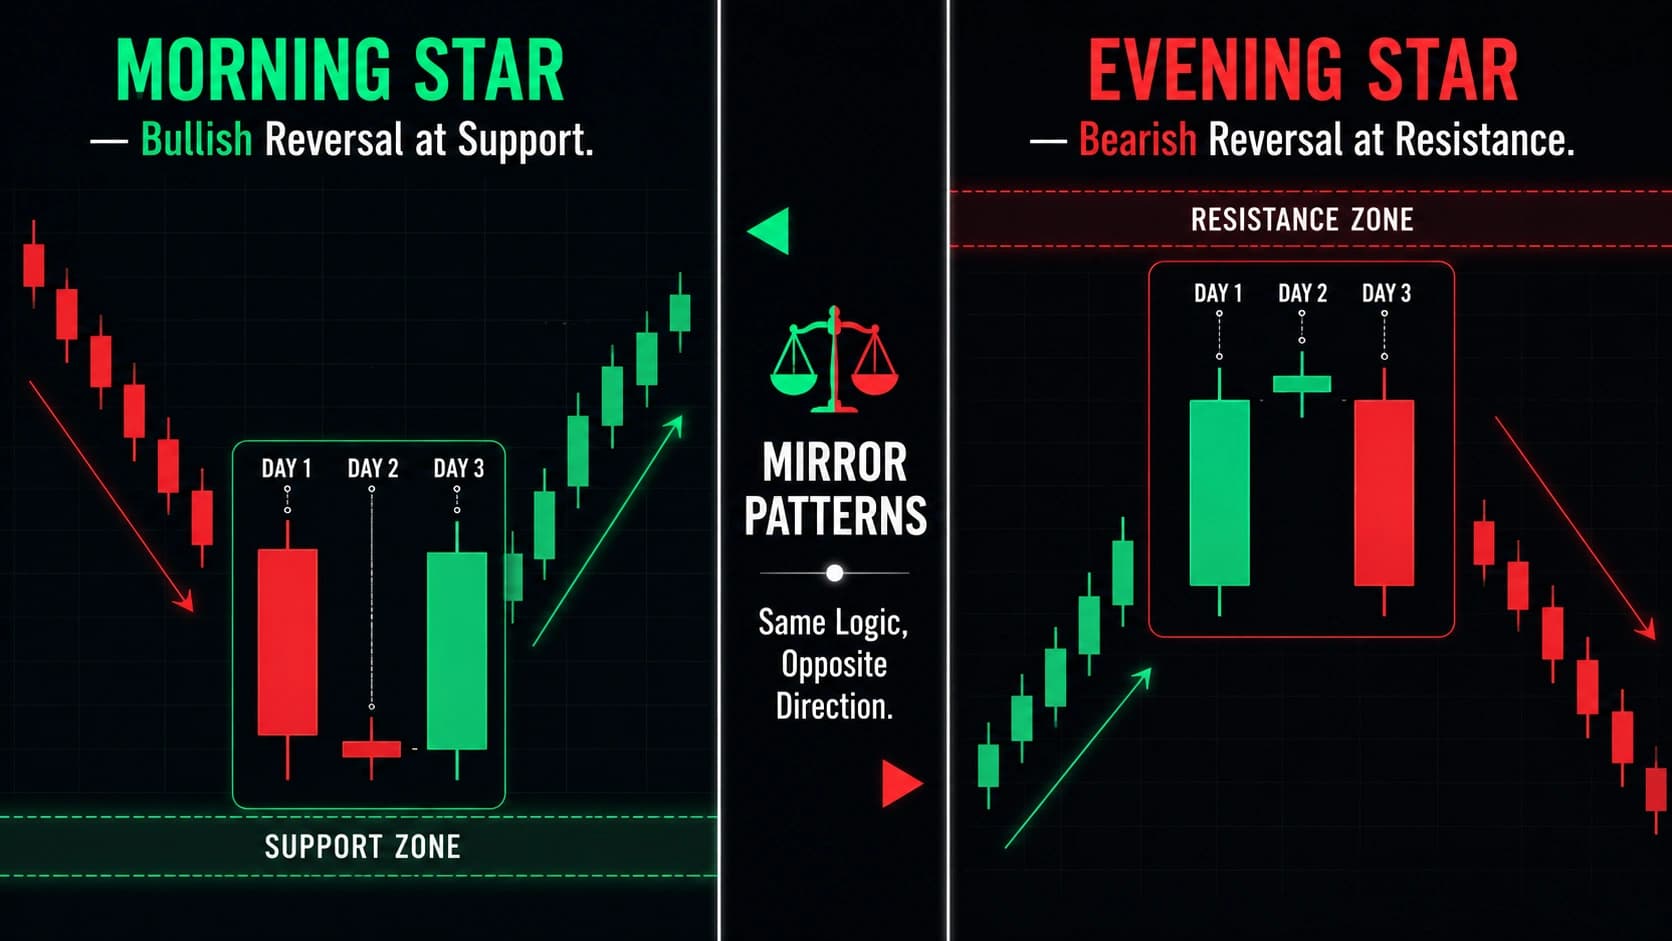
Part 7: Morning Star vs. Evening Star
The Morning Star and Evening Star are perfect mirror images — they share the identical three-candle structure but appear in opposite trend contexts and signal opposite directions.
| Feature | Morning Star | Evening Star |
|---|---|---|
| Prior trend | Downtrend | Uptrend |
| Candle 1 | Large bearish (red) | Large bullish (green) |
| Candle 2 (Star) | Small body, indecision | Small body, indecision |
| Candle 3 | Large bullish (green) | Large bearish (red) |
| Signal | Bullish reversal | Bearish reversal |
| Location | At support | At resistance |
| Day 3 requirement | Close above Day 1 midpoint | Close below Day 1 midpoint |
| Stop | Below Day 2 low | Above Day 2 high |
| Psychology | Seller exhaustion — buyer takeover | Buyer exhaustion — seller takeover |
Why They Are Equally Reliable
The three-session structure of the Morning Star applies equally to the Evening Star — the requirement for a prior trend, an indecision session, and a decisive reversal session with volume is the same. The mathematical symmetry of these patterns is what makes them the most powerful three-candle reversal pair in technical analysis.
When you fully understand the Morning Star — its psychology, its identification rules, its entry and stop logic — the Evening Star is immediately intuitive. The same framework, reversed.
Part 8: Morning Star on Different Timeframes
Daily Chart — Primary Application
The daily Morning Star is the standard use case for swing traders. Each candle represents a full trading session — three days of genuine institutional buyer-seller battle. The pattern's three-session structure ensures that the reversal has been tested and confirmed across multiple intraday sessions.
For NSE swing traders, a daily Morning Star at a key support level with RSI below 40 and expanded Day 3 volume is a primary entry signal. The trade typically plays out over 5–15 sessions.
Weekly Chart — Highest Institutional Weight
A weekly Morning Star represents three full weeks of buyer-seller battle. The scale of the conviction demonstrated over three weeks — seller dominance, equilibrium, buyer takeover — is extraordinary. Weekly Morning Stars at major support zones often mark the beginning of multi-month rallies.
The weekly Morning Star is rare (perhaps 4–6 times per year on a given stock at meaningful support levels) but produces the largest risk-reward outcomes of any single candlestick setup.
5-Minute and 15-Minute Chart — NSE Intraday
Intraday Morning Stars on the 5-minute chart work best during the 9:30–11:00 AM NSE session. The pattern spans 15 minutes (three 5-minute candles) and provides precise intraday reversal entries.
Key requirements for intraday Morning Stars:
- Day 2 volume must contract visibly (the "star" session has lower volume than Day 1)
- Day 3 volume must expand clearly — at least 1.5× the session average
- The pattern should align with the daily bias (bullish sessions produce more reliable intraday Morning Stars)
- VWAP should be within reachable distance of Day 3's close for the first target
Part 9: Common Morning Star Mistakes and Exact Fixes
Mistake 1 — Day 3 Does Not Close Above the Day 1 Midpoint
The most fundamental error — entering the trade when Day 3 closes only slightly above Day 2's level, well below the Day 1 midpoint. The recovery is insufficient to qualify as a Morning Star.
The fix: Calculate the Day 1 midpoint before entering any Morning Star trade. The close of Day 3 must be above this level. If it is not — the pattern does not qualify and the setup should be watched for an additional day or not taken at all.
Mistake 2 — Ignoring Volume on Day 3
A visually perfect three-candle structure with a large, beautiful Day 3 — but on below-average volume. The rally is retail enthusiasm without institutional backing, and it fades quickly.
The fix: Volume on Day 3 must be above average — ideally 1.5× to 2× the 20-period average. Below-average Day 3 volume patterns produce significantly more false Morning Stars. Make it a hard requirement.
Mistake 3 — Day 2 Is Too Large
Day 2 has a body that is nearly as large as Day 1 — it barely qualifies as "small." The indecision required for a Morning Star is absent; the "star" looks more like a continuation candle.
The fix: Day 2's body must be noticeably smaller than Day 1 — ideally less than 50% of Day 1's body size. The visual contrast between the large Day 1 and the small Day 2 is part of what makes the pattern psychologically significant. If Day 2 is large, wait for a cleaner setup.
Mistake 4 — Trading Without a Prior Downtrend
Finding a three-candle pattern in a sideways market where the first candle happens to be bearish and the third bullish — entering long when there is no actual downtrend to reverse.
The fix: Before acting on any Morning Star, identify the clear prior downtrend — at least 5–7 consecutive bearish candles making lower lows. The Morning Star reverses something. Without a clear downtrend, it is not a reversal signal.
Mistake 5 — Stop Below Day 1's Low Instead of Day 2's Low
Placing the stop below the entire pattern's maximum low (Day 1's low) instead of below Day 2's low. This creates an unnecessarily wide stop that produces poor risk-reward ratios even when the pattern is valid.
The fix: Stop below Day 2's low — the specific turning point candle, not the maximum of the entire pattern. Day 2's low is the logical invalidation point: if price drops below where indecision turned to buyer interest, the reversal has failed. Day 1's low is often too far away for meaningful risk-reward.
Mistake 6 — Entering Before Day 3 Closes
Seeing the Day 3 candle forming strongly and entering before it closes — before verifying the 50% recovery requirement. Day 3 then fades and closes below the Day 1 midpoint, invalidating the pattern you entered.
The fix: Wait for Day 3 to fully close before entering. Calculate the Day 1 midpoint. Verify Day 3's close exceeds it. Then enter at Day 3's close or Day 4's open. The patience of waiting for the close eliminates the most common false Morning Star entries.
FAQ
Q: What is the Morning Star candlestick pattern? The Morning Star is a three-candle bullish reversal pattern that forms after a downtrend. Day 1 is a large bearish candle confirming the downtrend. Day 2 is a small indecision candle (the "star") where neither buyers nor sellers dominate. Day 3 is a large bullish candle that closes above the midpoint of Day 1's body, confirming buyer takeover. An extensive study of 4.7 million candles found the pattern predicted reversals 78% of the time in context — making it one of the highest win-rate candlestick patterns when properly filtered.
Q: What is the 50% rule in the Morning Star pattern? The 50% rule states that Candle 3 (the bullish reversal candle) must close above the midpoint of Candle 1's body. The midpoint is the exact middle of Candle 1's body. A Day 3 close above this midpoint confirms that buyers have recovered more than half of Day 1's decline — demonstrating genuine buyer dominance. A Day 3 close below the midpoint means the recovery is insufficient to qualify the pattern as a valid Morning Star.
Q: What is the difference between Morning Star and Evening Star? They are perfect mirror images. The Morning Star appears after a downtrend (Day 1 bearish, Day 2 small star, Day 3 large bullish) and signals a bullish reversal at support. The Evening Star appears after an uptrend (Day 1 bullish, Day 2 small star, Day 3 large bearish) and signals a bearish reversal at resistance. Both require the same context filters, the same volume confirmation, and the same 50% penetration rule — just in opposite directions.
Q: Where should I place the stop loss on a Morning Star trade? Below the low of Day 2 (the star candle) — the lowest point of the indecision session — with a small buffer of 0.2–0.3% for large-cap NSE stocks. Day 2's low represents the turning point of the pattern. If price drops below this level after the Morning Star has formed, the reversal has failed and the position must be exited. Never place the stop below Day 1's low as this creates unnecessarily wide risk and poor risk-reward ratios.
Q: What is the Morning Doji Star pattern? The Morning Doji Star is the strongest version of the Morning Star where Day 2 is specifically a Doji — the Open and Close are at or near the same price. The Doji's perfect indecision (complete buyer-seller balance) followed by Day 3's decisive buyer takeover makes the psychological reversal narrative more complete than a standard Morning Star. The Morning Doji Star achieves higher win rates than the standard version, particularly when the Doji on Day 2 is gap-isolated (gap below from Day 1 and gap above to Day 3 — the Abandoned Baby pattern).
Q: How do I confirm a Morning Star pattern before entering? Three confirmation requirements: (1) Day 3 must close above the midpoint of Day 1's body — calculate this before entering; (2) Day 3's volume must be above the 20-period average — ideally 1.5× or more; (3) the pattern must appear after a confirmed downtrend at or near a significant support level. Additionally, RSI below 40 (oversold) on or near Day 2 provides independent momentum confirmation. With all three confirmations present, the pattern is Grade A and ready to trade.
Q: What is the best timeframe for the Morning Star pattern? Daily and weekly charts produce the most reliable Morning Star signals due to full institutional participation. A daily Morning Star represents three full trading sessions of genuine buyer-seller battle. Weekly Morning Stars, representing three full weeks, are rarer but produce the largest risk-reward outcomes. For NSE intraday traders, the 5-minute chart during the 9:30–11:00 AM session produces actionable Morning Stars — particularly when the pattern forms below VWAP after the opening Judas Swing completes.
Conclusion
The Morning Star is the most complete and most psychologically compelling bullish reversal signal in single-timeframe candlestick analysis. Its three-session narrative — seller dominance, complete indecision, decisive buyer takeover — is a story that requires three chapters to tell fully, and the reader (the chart) leaves no ambiguity about the ending.
When a Morning Star forms at a key support level after a sustained downtrend, with an RSI reading below 40, and Day 3 closes above the Day 1 midpoint on significantly above-average volume — you have one of the highest-probability long entries available to technical traders. An extensive study of 4.7 million candles validating a 78% reversal prediction rate is not a number to dismiss.
The three principles to carry forward from this guide:
1. The 50% rule is non-negotiable. Day 3 must close above the Day 1 midpoint. This single mathematical requirement is what separates a valid Morning Star from a three-candle shape that looks similar. Calculate it every time before entering.
2. Day 3 volume is the institutional proof. The Morning Star's story is psychologically compelling. But without volume expansion on Day 3, it is a retail story with no institutional backing. Volume 1.5× or more above average on Day 3 is the confirmation that the buyers stepping in have real capital and real conviction.
3. Location determines significance. A Morning Star at a major support level has structural backing. The support provides the reason for buyers to appear; the Morning Star provides the evidence they did. A Morning Star floating mid-range, away from any structural level, is a visually interesting pattern with no fundamental reason to hold.
Further reading: Bullish Candle Anatomy: How to Read a Bullish Candlestick | Bearish Candle Anatomy: How to Read a Bearish Candlestick | Important Candlestick Patterns: The Complete Guide | Shooting Star Candlestick Pattern: Complete Trading Guide | Bullish Engulfing Pattern: Complete Trading Guide | RSI Trading Strategy: Complete Guide | Support and Resistance: The Complete Trading Guide | Volume Analysis Trading Strategy | Bollinger Bands Trading Strategy | Hammer Candlestick Pattern: Complete Trading Guide | Bearish Engulfing Pattern: Complete Trading Guide | How to Trade Intraday Stocks in India | Technical Analysis Mastery: The Complete Guide | Smart Money Concepts: The Complete Mastery Guide | 5 Best Intraday Trading Strategies for NSE India
Ready to Trade the Morning Star on Real Stocks?
→ Open the Dhanith Intraday Screener — find today's NSE stocks where Morning Star setups are forming at VWAP and key support levels on above-average volume
→ Calculate Your Position Size Before Every Trade — know your exact share count, stop distance, and maximum loss before entering
→ Log Every Morning Star Trade in the Dhanith Journal — track your win rate by pattern configuration and improve with every session
Disclaimer: This article is for educational purposes only and does not constitute financial or investment advice. Trading in stocks and financial markets involves significant risk of capital loss. Past performance does not guarantee future results. Always use proper risk management and stop losses.
Have a question about this article?
Comment on our latest Instagram post or send us a DM — we reply to every one.
@dhanith_officialWas this article helpful?
Click to rate
Founder, Dhanith Trading
7+ years trading Nifty, Bank Nifty, NSE stocks, and commodities — specializing in Smart Money Concepts (SMC) and ICT price action. Founder of Dhanith — a trading journal, intraday screener, and risk tools platform built for retail traders.
Dhanith Newsletter
Enjoyed this article? Get more like it.
New trading guides, candlestick patterns, SMC strategies, and tool updates — straight to your inbox. Free, for Indian traders.
No spam. Unsubscribe anytime.
Continue Reading