On this page
- Why 90% of Traders Never Journal (And Pay the Price)
- Introducing the Dhanith Trading Journal — Free Excel Download
- What Makes This the Best Free Trading Journal?
- What's Inside the Dhanith Trading Journal
- 1. Dashboard — Your Real-Time Performance Cockpit
- 2. Trade Log — Where You Enter Your Trades
- 3. Monthly Report — Your Monthly Performance Review
- 4. Setup — Customise Your Dropdowns
- How to Use the Dhanith Trading Journal — Step by Step
- Step 1: Download and Open the File
- Step 2: Go to the Trade Log Tab
- Step 3: Start Filling in Your Trades
- Step 4: Use the Dropdown Menus
- Step 5: Write Your Trade Notes
- Step 6: Check Your Dashboard After Every Week
- The 5 Metrics You Must Track as a Trader
- 1. Win Rate
- 2. Profit Factor
- 3. Average Risk:Reward
- 4. Equity Curve
- 5. Net P/L by Strategy
- Smart Money Concepts Strategies Pre-Loaded
- Demo Data Inside — See It Working Immediately
- Who Is This For?
- Frequently Asked Questions
- The Honest Truth About Trading Journals

Free Trading Journal Excel Download — The Only Sheet You'll Ever Need (2026)
Download the best free trading journal in Excel — the Dhanith Trading Journal. Track every trade, auto-calculate P&L, risk/reward, win rate & more. Free download inside.
If you've been trading for more than a month and you're still not maintaining a trading journal, this article is going to change everything for you.
Most traders lose money not because they don't know how to trade. They lose money because they don't know why they're losing. A trading journal fixes exactly that.
Today, I'm sharing the Dhanith Trading Journal — a professional-grade, completely free trading journal in Excel format, built specifically for Indian retail traders trading on NSE, BSE, and multi-market instruments. No subscriptions. No paywalls. Just download, fill in your trades, and let it do the rest.
Why 90% of Traders Never Journal (And Pay the Price)
Let's be honest. Most traders skip journaling because:
- It feels like extra homework after an already exhausting trading day
- They don't know what to track
- Generic templates from the internet are too basic or too complicated
- Paid apps charge ₹500–₹2,000/month for something that should be free
The result? They repeat the same mistakes every week. They get emotional on their loss days. They can't identify which setup is actually working for them. They don't know their real win rate, profit factor, or average R:R.
A trading journal is not a nice-to-have. It is the single most important habit separating profitable traders from losing ones. Every successful trader — retail or institutional — keeps a journal. Period.
Introducing the Dhanith Trading Journal — Free Excel Download
The Dhanith Trading Journal is a completely free, professionally designed Excel trading journal built for serious Indian retail traders. It's the same kind of tracking system that prop traders and fund managers use — now available as a free trading journal Excel download for anyone.
What Makes This the Best Free Trading Journal?
- Zero manual calculations — every metric auto-computes the moment you enter a trade
- Dark fintech dashboard UI — actually looks professional, not like a 2005 spreadsheet
- SMC/ICT strategy tags — built around Smart Money Concepts, Order Blocks, FVG, Liquidity Sweeps and more
- Real performance analytics — Win Rate, Profit Factor, Avg R:R, Equity Curve, breakdown by market and strategy
- 500 trade rows — ready to use for years
- Completely free — no subscription, no upsell, no email required
What's Inside the Dhanith Trading Journal
The journal has 4 sheets, each with a specific purpose.
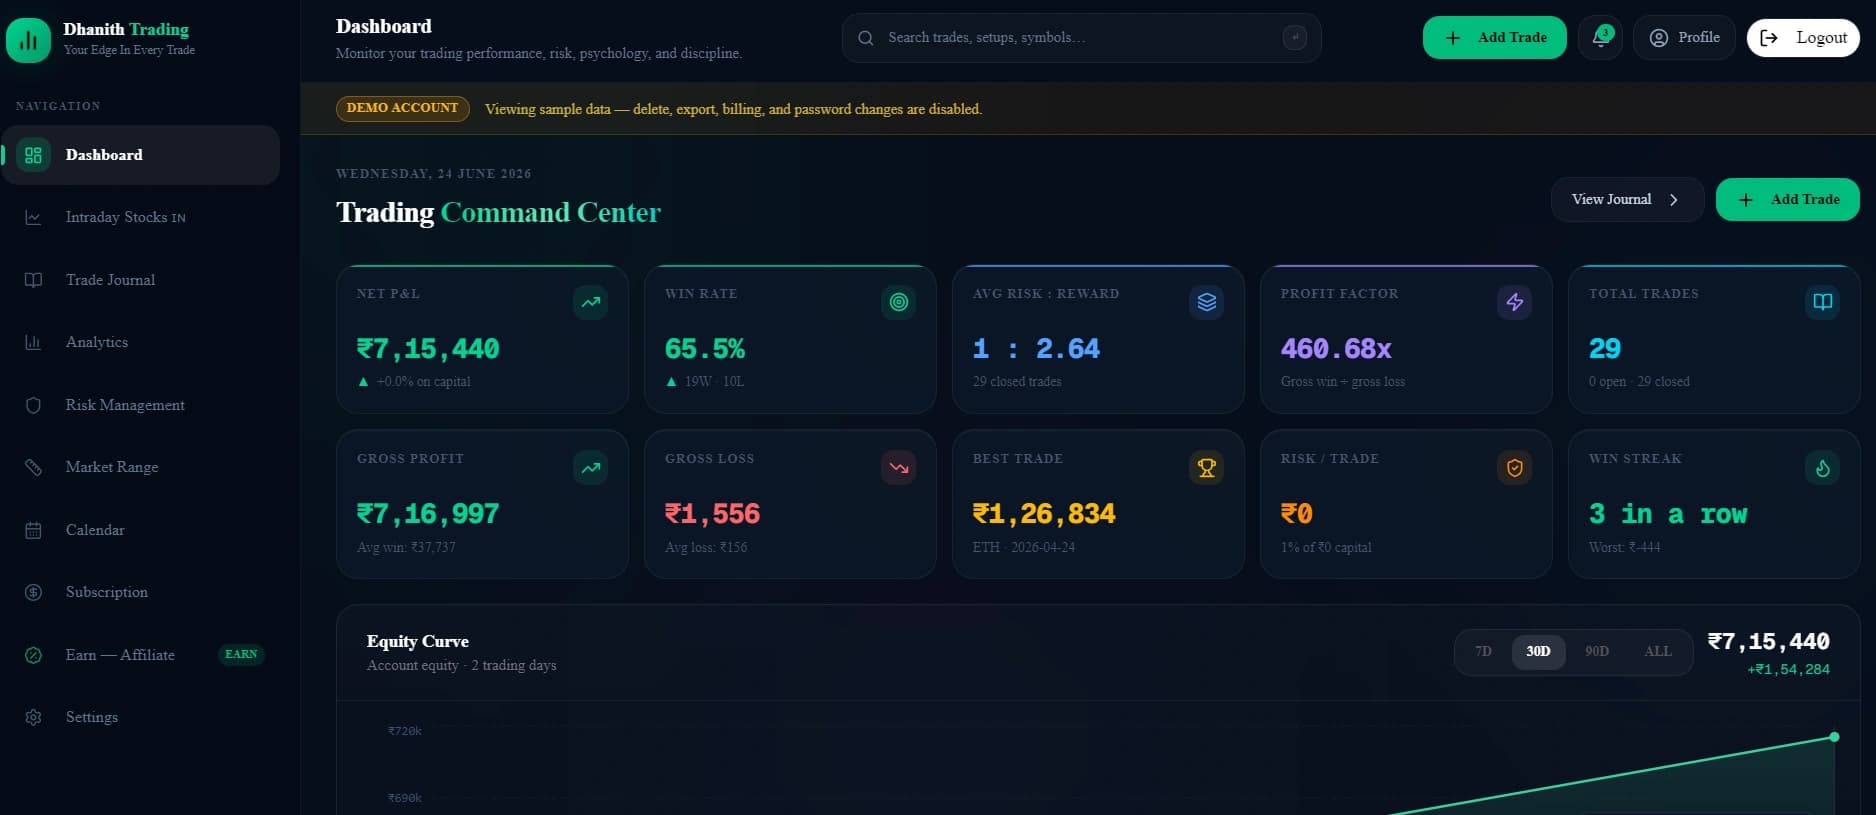
1. Dashboard — Your Real-Time Performance Cockpit
This is the first thing you see when you open the file. It's a live analytics dashboard that updates automatically as you log trades.
KPI Cards (10 key metrics, always visible):
| Metric | What It Shows |
|---|---|
| Total Trades | Total number of trades logged |
| Win Rate | Percentage of winning trades |
| Net P/L | Total profit or loss after brokerage |
| Profit Factor | Gross profit ÷ gross loss (above 1.5 is excellent) |
| Avg Risk:Reward | Average R:R across all your trades |
| Best Trade | Your single biggest winning trade |
| Worst Trade | Your single biggest losing trade |
| Avg Win | Average size of a winning trade |
| Avg Loss | Average size of a losing trade |
| Capital Deployed | Total capital put to work |
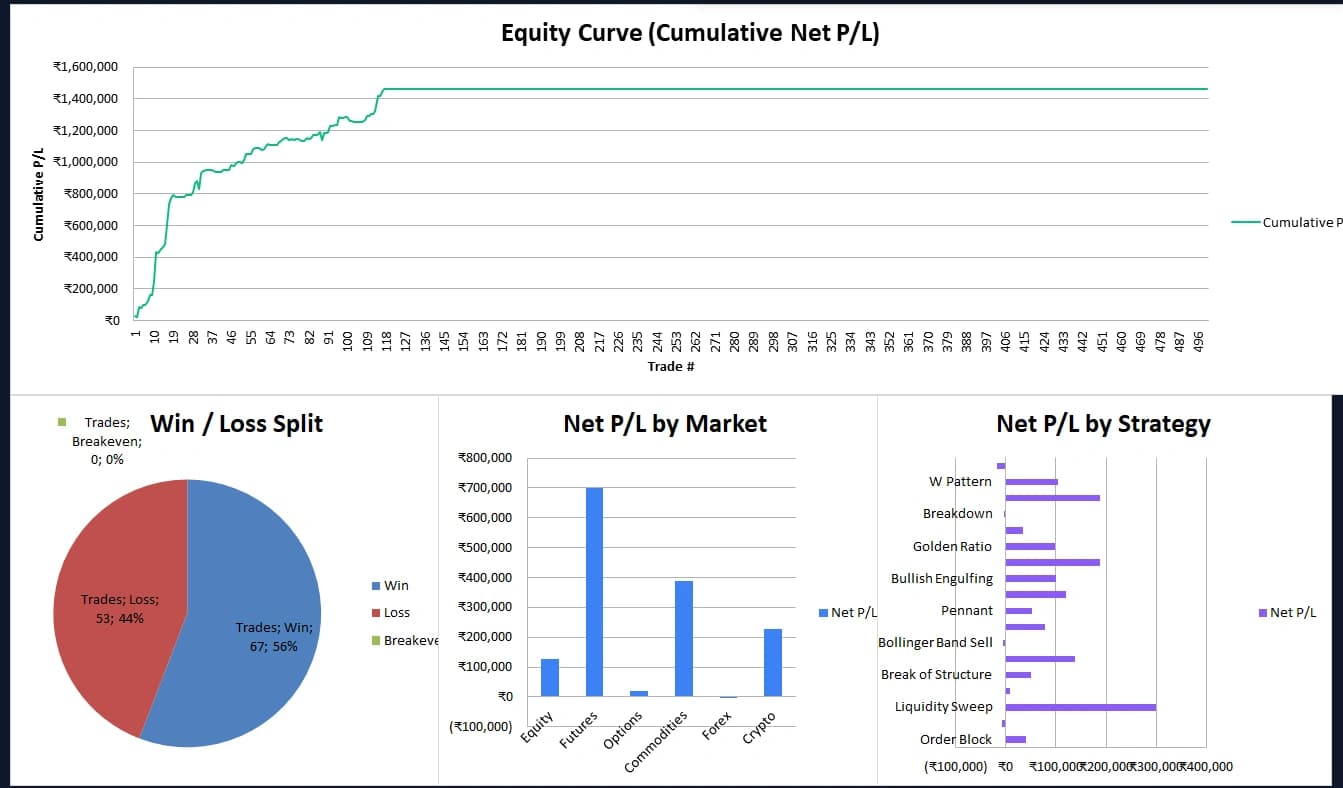
Charts (4 live charts, auto-updating):
- Equity Curve — your cumulative net P/L plotted trade by trade. A rising equity curve = you have an edge. Choppy or falling = something needs to change.
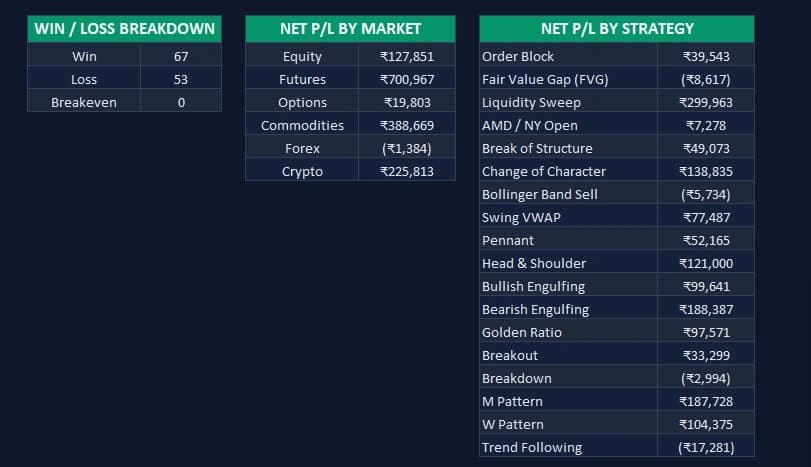
- Win/Loss Split — pie chart showing your win/loss/breakeven distribution
- Net P/L by Market — which markets (Equity, Futures, Options, Commodities, Forex, Crypto) are making you money and which are draining you
- Net P/L by Strategy — which setups are actually working (Order Block? FVG? Breakout?) and which ones you should stop trading
2. Trade Log — Where You Enter Your Trades
The Trade Log is the only sheet where you enter data. Everything else pulls from here automatically.
You fill in these 15 fields:
| Column | What You Enter |
|---|---|
| Date | Trade date (dd-mmm-yyyy) |
| Entry Time | When you entered |
| Exit Time | When you exited |
| Trading Type | Scalping / Intraday / Swing etc. |
| Market | Equity / Futures / Options etc. |
| Symbol / Asset | Reliance, Nifty-50, Gold, BTC etc. |
| Strategy | Order Block, FVG, BOS, Breakout etc. |
| Direction | Buy or Sell |
| Qty | Number of shares / lots / units |
| Entry Price | Your entry price |
| Stop Loss | Your stop loss level |
| Target Price | Your target level |
| Exit Price | Actual price you exited at |
| Fees/Brokerage | Your actual brokerage paid |
| Trade Notes | What you saw, why you took the trade |
Everything else calculates automatically:
| Calculated Column | What It Does |
|---|---|
| Hold Time | Exit Time — Entry Time |
| Risk Amount | |Entry — SL| × Qty |
| Reward Amount | |Target — Entry| × Qty |
| Risk : Reward | Reward ÷ Risk |
| Capital Deployed | Entry Price × Qty |
| Gross P/L | (Exit — Entry) × Qty (direction-aware) |
| Net P/L | Gross P/L — Brokerage |
| Return % | Net P/L ÷ Capital Deployed |
| Result | Auto Win / Loss / Breakeven (color-coded) |
| Cumulative P/L | Running total of Net P/L |
3. Monthly Report — Your Monthly Performance Review
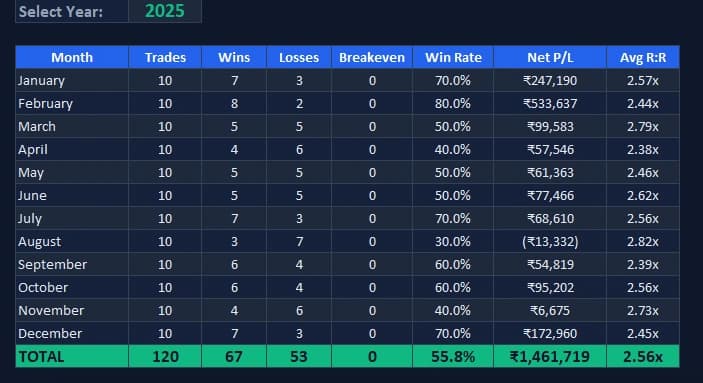
Set the year at the top, and the Monthly Report automatically builds a full year-by-year breakdown:
- Trades per month and Win/Loss/Breakeven per month
- Win Rate and Net P/L per month
- Avg Risk:Reward per month
- Annual totals row
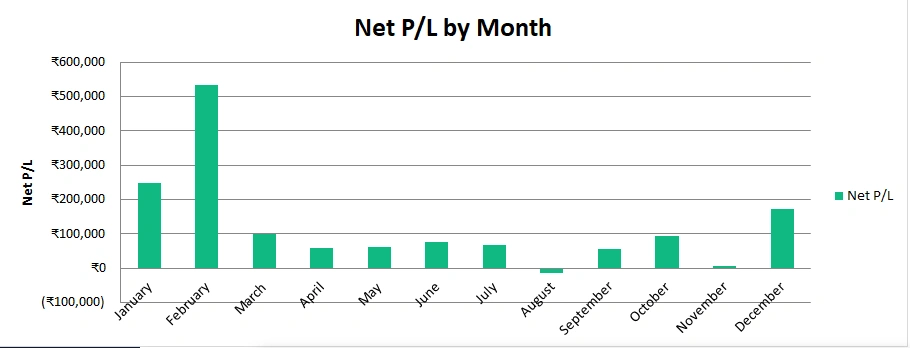
- Net P/L by Month bar chart — makes it immediately obvious which months you're consistently profitable in
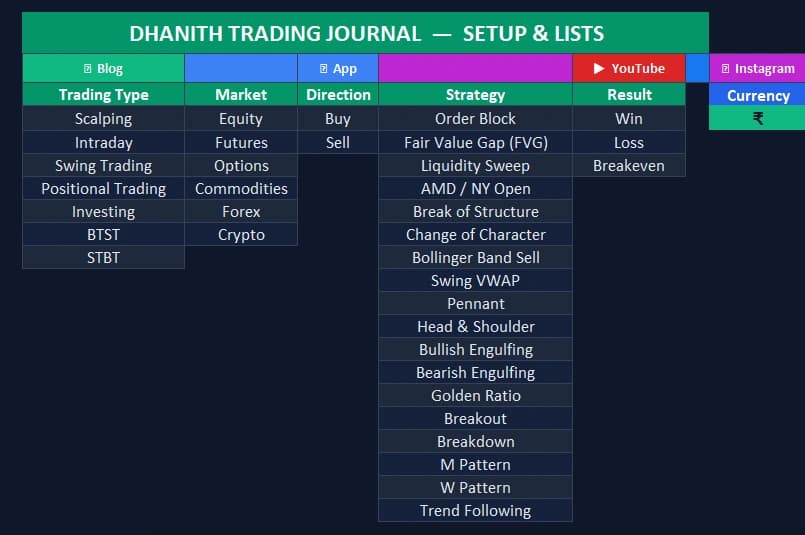
4. Setup — Customise Your Dropdowns
This is the backend configuration sheet. It contains the master lists that power all the dropdowns in the Trade Log:
- Trading Type — Scalping, Intraday, Swing Trading, Positional, Investing, BTST, STBT
- Market — Equity, Futures, Options, Commodities, Forex, Crypto
- Direction — Buy, Sell
- Strategy — 18 strategies pre-loaded (Order Block, FVG, Liquidity Sweep, AMD/NY Open, BOS, ChoCh, M Pattern, W Pattern, Head & Shoulder, Bollinger Band, Swing VWAP, Breakout, Breakdown, Trend Following and more)
You can add your own strategies or instruments to these lists. The dropdowns in Trade Log will update automatically.
How to Use the Dhanith Trading Journal — Step by Step
Step 1: Download and Open the File
The file is password protected. Download it below — once your download starts, the password to open it will be shown right there on the page.
Step 2: Go to the Trade Log Tab
Click the Trade Log tab at the bottom. This is where all your trade data goes.
Step 3: Start Filling in Your Trades
Start from row 5 (the first data row). Fill in columns B through P only. Everything from column Q onwards fills in automatically — don't touch those.
Pro tip for options traders: When trading options, your "Entry Price" is the premium paid per lot, and Qty is the number of lots × lot size. For Nifty options, if you buy 1 lot at ₹180 premium, enter Qty as 75 (Nifty lot size) and Entry Price as 180. The capital deployed and P/L will calculate correctly.
Step 4: Use the Dropdown Menus
Click any cell in the Trading Type, Market, Direction, or Strategy columns — you'll see a dropdown arrow appear. Select from the pre-loaded options for consistency. Consistent tagging is what makes the dashboard analytics meaningful.
Step 5: Write Your Trade Notes
Don't skip the Trade Notes column. This is where the real learning happens. Write:
- Why you took the trade
- What the setup looked like (e.g., "Clean 4H Order Block retest, session open long")
- What the market was doing when you entered
- What happened and what you'll do differently
Step 6: Check Your Dashboard After Every Week
Click the Dashboard tab and review your metrics weekly. Ask yourself:
- Is my equity curve trending up or down?
- Which market is eating my profits?
- Which strategy has the highest win rate?
- What's my actual profit factor this month?
The dashboard cannot lie. Numbers don't have emotions. Use them.
The 5 Metrics You Must Track as a Trader
Most traders only look at one metric — total profit or loss. Here's what actually matters:
1. Win Rate
Your percentage of winning trades. A 40% win rate can still be extremely profitable if your R:R is 3:1. And a 70% win rate can still blow your account if you let losses run bigger than wins.
2. Profit Factor
Gross profit ÷ Gross loss. Anything above 1.0 means you're net positive. Professional traders target 1.5 to 2.5. If your profit factor is below 1.0, you're losing money on net regardless of what your win rate looks like.
3. Average Risk:Reward
Are you actually following your trading plan? If you're setting 1:2 R:R trades but your journal shows 0.8 average R:R, you're cutting winners early and holding losers too long. The journal reveals this.
4. Equity Curve
The shape of your equity curve tells you everything about your trading psychology and system consistency. A smooth, rising curve = disciplined, systematic trader. A volatile, jagged curve = emotional, inconsistent trader.
5. Net P/L by Strategy
This is the one that will genuinely change your trading. You may think Order Blocks are your best setup. Your journal may reveal that FVG+OB confluence is actually where all your edge comes from, while plain OB trades are a net negative. Double down on what works. Cut what doesn't.
Smart Money Concepts Strategies Pre-Loaded
The Dhanith Trading Journal is specifically built for traders following Smart Money Concepts (SMC) and ICT methodology. All 18 pre-loaded strategies come from this framework:
- Order Block (OB) — institutional order flow zones
- Fair Value Gap (FVG) — imbalance zones in price
- Liquidity Sweep — engineering liquidity above highs/below lows
- AMD / NY Open — Accumulation, Manipulation, Distribution model
- Break of Structure (BOS) — market structure confirmation
- Change of Character (ChoCH) — trend reversal signal
- Swing VWAP — volume-weighted average price as dynamic S/R
- Pennant / Head & Shoulder / M Pattern / W Pattern — classic price action
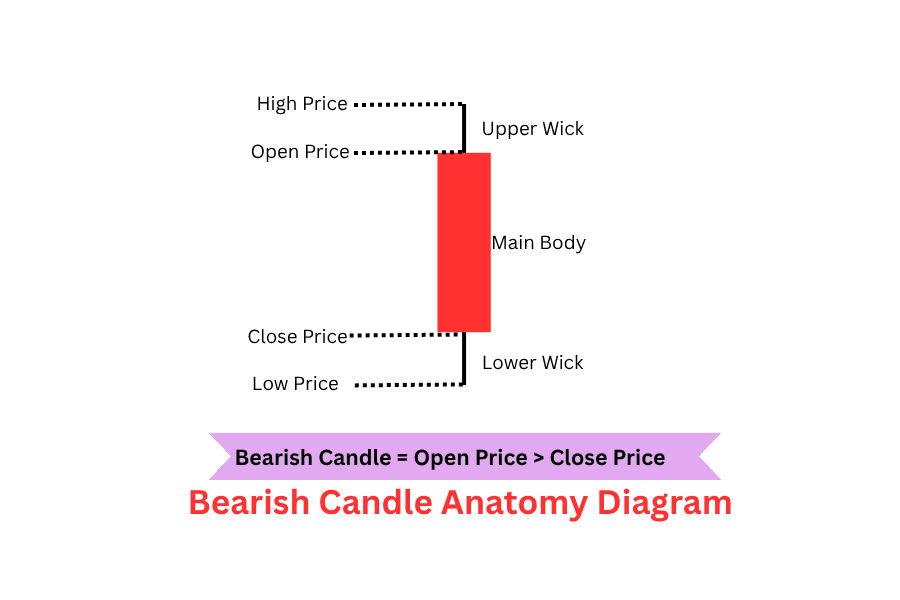
- Bullish/Bearish Engulfing — candlestick confirmation
- Golden Ratio — Fibonacci-based entry zones
- Breakout / Breakdown / Trend Following — structural and momentum setups
You can add your own custom strategies in the Setup sheet and they'll appear in the dropdown immediately.
Demo Data Inside — See It Working Immediately
The journal comes pre-loaded with 120 demo trades (10 per month across all 12 months) across real Indian market instruments — Nifty, Banknifty, Reliance, HDFC, Gold, Crude Oil, Bitcoin and more. This means:
- You can see exactly how the journal looks with real data before adding your own
- The Dashboard charts and metrics are fully populated so you understand what you're looking at
- The Monthly Report shows a full year's performance breakdown
To start fresh: Select rows 5 to 124 in the Trade Log, delete the data in columns B to P only (don't delete the formula columns Q onwards), and start logging your own trades.
Who Is This For?
The Dhanith Trading Journal is built for:
- Intraday traders on NSE/BSE who need to track daily performance
- Options traders tracking CE/PE premium buying and selling strategies
- Swing traders holding positions for 2–5 days
- SMC/ICT traders who use Order Blocks, FVG, and liquidity analysis
- Positional traders and investors tracking multi-week positions
- Commodity traders in Gold, Silver, Crude Oil, Natural Gas
- Beginners who want to build the journaling habit from day one
- Experienced traders who have been trading without a journal and want to fix that
Frequently Asked Questions
Is this trading journal really free? Yes, 100% free. No subscription, no hidden cost. Download it and use it forever.
What is the password to open the file? The file is password protected. The password is shown automatically on the page right after you download it — you don't need to look it up separately. The Dashboard and Monthly Report sheets are also view-locked to protect the formulas, but you don't need to unlock them to use the journal.
Can I add more rows for trades? Yes. The journal supports 500 trades (rows 5 to 504 in the Trade Log). If you need more, you can extend the formulas by copying the last formula row downward.
Can I add my own strategies to the dropdown? Yes. Go to the Setup tab, find the Strategy column, and add your strategy below the existing list. It will automatically appear in the Trade Log dropdown.
Does it work on Google Sheets? The journal is built for Microsoft Excel (2016 and above, or Microsoft 365). Google Sheets will open it but some formatting (like the ₹ symbol format and conditional formatting) may not render perfectly. For best results, use Excel.
Does it work on Mac? Yes. Excel for Mac (2016+) fully supports the journal.
Is my data safe? Your data never leaves your computer. This is a local Excel file — nothing is uploaded or synced anywhere.
The Honest Truth About Trading Journals
Here's something most trading educators won't tell you.
A trading journal doesn't make you profitable overnight. It doesn't give you a magic strategy. It doesn't guarantee you won't have losing months.
What it does is give you data instead of feelings. It replaces "I think I'm profitable" with "I know my profit factor is 1.8." It replaces "I feel like I'm good at Nifty options" with "My Nifty options trades are +₹2.3L and my Bank Nifty trades are -₹80K so let me focus where my edge actually is."
The best traders I know are obsessed with their journals. They review every trade. They look for patterns in their losses. They double-check their psychology on their winning trades because overconfidence after a good run is just as dangerous as fear after a bad one.
Start today. Log your very next trade. Do it consistently for 30 days. The data will tell you exactly what you need to change.
Free Download
Download Your Free Trading Journal Excel Sheet
Professional-grade, 100% free. Enter your email to get the Dhanith Trading Journal — no subscription, no paywall.
No spam. Unsubscribe anytime. Your email is only used to send you the download and occasional trading tips.
Dhanith Trading Journal
Track every trade. Find your real edge.
Log your setups, grade your entries, and review your trading patterns — all in one place. The journal built for serious SMC traders.
Further reading: Best Online Trading Journal: Why Serious Traders Track Every Trade | Smart Money Concepts: The Complete Mastery Guide | How to Trade Intraday Stocks in India
Disclaimer: This trading journal is a free educational tool. Trading involves substantial risk of capital loss. Always use proper risk management and never risk more than you can afford to lose.
Was this article helpful?
Click to rate
Trader & Founder, Dhanith Trading
Full-time trader focused on price action, Smart Money Concepts, and intraday strategies for Indian markets. Founder of Dhanith — a trading journal, intraday screener, and risk tools platform built for retail traders.
Dhanith Newsletter
Enjoyed this article? Get more like it.
New trading guides, candlestick patterns, SMC strategies, and tool updates — straight to your inbox. Free, for Indian traders.
No spam. Unsubscribe anytime.
Continue Reading