On this page
- Introduction
- Part 1: What Is Volume? — The Complete Foundation
- The Basic Definition
- Why Volume Matters More Than Price Alone
- Volume as an Institutional Footprint
- Part 2: The Key Volume Concepts Every Trader Must Know
- Relative Volume (RVOL) — The Volume Benchmark
- Volume Divergence — The Early Warning System
- Volume Climax — The Exhaustion Signal
- Volume Dry-Up — The Coiling Spring
- Volume and the NSE FII/DII Data
- Part 3: Volume Indicators — The Complete Toolkit
- 1. Standard Volume Bars (Foundation)
- 2. On Balance Volume (OBV) — Cumulative Flow
- 3. VWAP (Volume Weighted Average Price)
- 4. Volume Profile (Point of Control and Value Area)
- Part 4: How to Set Up Volume on Your Charts
- TradingView Setup
- Zerodha Kite Setup
- The Visual Volume Reading Rule
- Part 5: Five Complete Volume Trading Strategies
- Strategy 1 — Volume Breakout Confirmation
- Strategy 2 — OBV Divergence Strategy
- Strategy 3 — Volume Climax Reversal
- Strategy 4 — Volume Dry-Up Breakout
- Strategy 5 — Volume + Candlestick Confirmation
- Part 6: Volume Analysis for NSE — India-Specific Considerations
- FII/DII Data as Macro Volume Context
- Pre-Market Volume Shockers
- Volume Patterns Specific to NSE Sessions
- Part 7: Volume Mistakes and Exact Fixes
- Mistake 1 — Ignoring Volume Entirely
- Mistake 2 — Treating Every Volume Spike as a Signal
- Mistake 3 — Trading Low-Volume Breakouts
- Mistake 4 — Confusing OBV Direction with Price Direction
- Mistake 5 — Missing the Volume Dry-Up
- Mistake 6 — Using Volume in Isolation
- FAQ
- Conclusion
- Ready to Trade These Signals on Real Stocks?
Volume Analysis: The Complete Trading Guide with Strategies (2026)
Master volume analysis in 2026. Learn volume basics, relative volume (RVOL), OBV divergence, volume climax, and 5 complete strategies — with NSE India examples, FII/DII institutional flow context, and common mistakes with exact fixes.
Introduction
There are two true indicators when trading stocks — price and volume. Everything else is derived from them. Price tells you what happened. Volume tells you how much conviction was behind it.
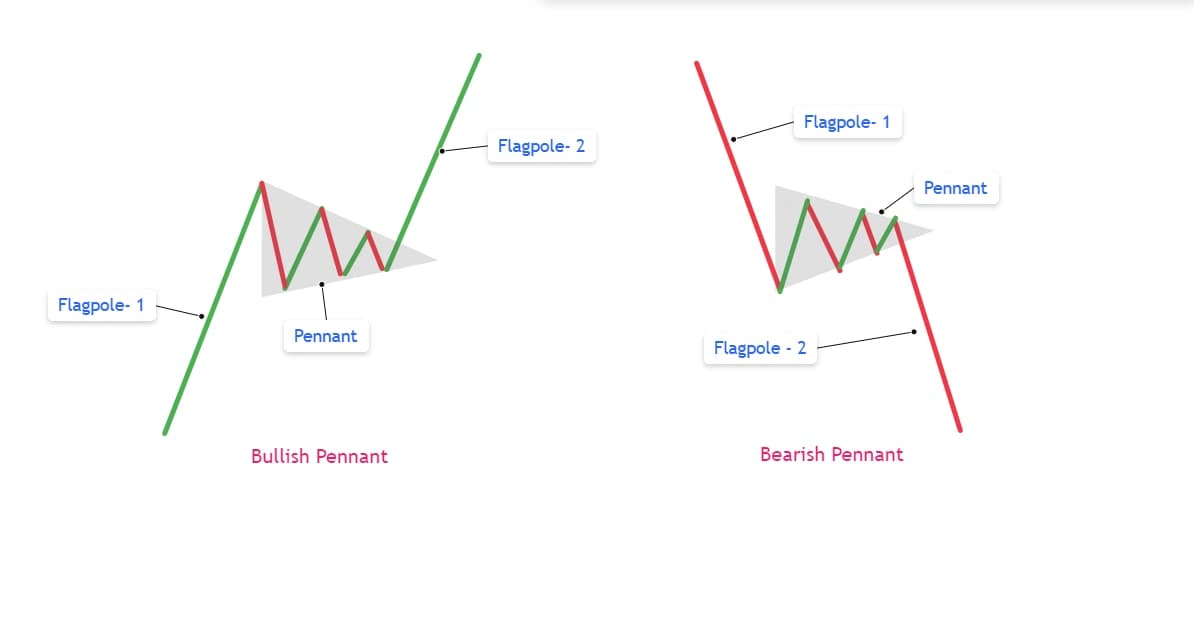
You can have the most beautiful chart pattern — a textbook Bullish Engulfing at a major support level, a Morning Star forming after a 10-session decline, a clean resistance breakout. But without volume, these patterns are visual noise. When price breaks above resistance on below-average volume, the breakout is more likely to fail. When price bounces from support on thin volume, the bounce is likely temporary.
Volume is the market's truth detector. It cannot be faked. If price is rising, eventually it must actually rise. And if it is rising with conviction — with real institutional money behind it — volume will confirm it. This is the core of volume analysis.
Volume analysis trading uses traded share or contract volume to confirm whether a price move has real institutional participation behind it. For Indian equity traders on NSE and BSE, where over ₹50,000 crore in daily F&O turnover flows through the market, understanding volume is the difference between entering a move backed by institutional capital and entering retail noise that reverses within hours.
This guide covers the complete volume analysis framework — from understanding what volume actually measures, to reading relative volume (RVOL), to five complete trading strategies using volume as the primary confirmation tool, to the volume-specific indicators (OBV, Volume Profile, VWAP) that transform raw volume data into precise trade signals.
TL;DR — Key Takeaways
- Volume measures the number of shares traded during a period — it is the "fuel" that sustains price moves
- High volume confirms price moves; low volume questions them — a price move on thin volume is suspect
- Relative Volume (RVOL) compares the current session's volume to the average — RVOL above 2.0 signals a tradable, news-driven move
- Volume divergence: price makes new highs on falling volume = exhaustion warning; price makes new lows on falling volume = potential reversal ahead
- Volume climax: a single bar printing 3–10× average volume at the end of a trend = exhaustion and likely reversal
- Volume dry-up: very low volume during consolidation = energy building, breakout approaching
- Five strategies: Volume Breakout Confirmation, OBV Divergence, Volume Climax Reversal, Dry-Up Breakout, Volume + Candlestick
- For NSE: always check FII/DII institutional flow data alongside technical volume for the full picture
Part 1: What Is Volume? — The Complete Foundation
The Basic Definition
Volume is the total number of shares (or contracts) that changed hands during a specific time period. On a 5-minute chart, each volume bar shows the total shares traded in those five minutes. On a daily chart, it shows the entire day's activity.
The colour of the volume bar typically mirrors the corresponding price candle:
- Green volume bar: The period closed higher than it opened — the dominant direction was bullish
- Red volume bar: The period closed lower than it opened — the dominant direction was bearish
This colour coding does not mean there was more buying or selling in absolute terms — it simply reflects the net direction. A green bar could have had massive selling; buyers just happened to win the session by a small margin.
Why Volume Matters More Than Price Alone
Consider two identical-looking 2% price increases in a Nifty 50 stock:
Move A: Price rises 2% on 50,000 shares traded (half the daily average) Move B: Price rises 2% on 300,000 shares traded (3× the daily average)
The price chart looks identical. But Move B tells a fundamentally different story — institutional traders are actively buying at this level. The move has genuine backing. Move A may simply be thin-market movement in the absence of sellers.
This is the core insight of volume analysis: price tells you what happened; volume tells you whether to believe it.
A price movement accompanied by high volume is more trustworthy than one with low volume. High volume confirms that many participants agreed with the price change — making it more likely to persist. Low volume suggests the move was driven by few participants — making it more likely to reverse.
Volume as an Institutional Footprint
Institutions — mutual funds, FIIs (Foreign Institutional Investors), DIIs (Domestic Institutional Investors), and proprietary trading desks — cannot hide. When they buy, volume rises. When they sell, volume rises. The footprint of large-order execution always appears in the volume data.
For Indian traders, this institutional footprint is particularly visible because of the concentrated participation of large FIIs in NSE-listed large-cap stocks. When FII net buying surges — visible in the daily FII/DII data on the NSE website — the volume in banking, IT, and large-cap stocks typically rises simultaneously. The FII/DII data and the volume bars tell the same story from two different angles.
The institutional volume principle: When you see unexplained volume spikes — significantly above-average volume without obvious news — institutional positioning is occurring. They are accumulating (buying on high volume quietly) or distributing (selling into buying interest). Recognising this early gives you the opportunity to follow institutional direction rather than trade against it.
Part 2: The Key Volume Concepts Every Trader Must Know
Relative Volume (RVOL) — The Volume Benchmark
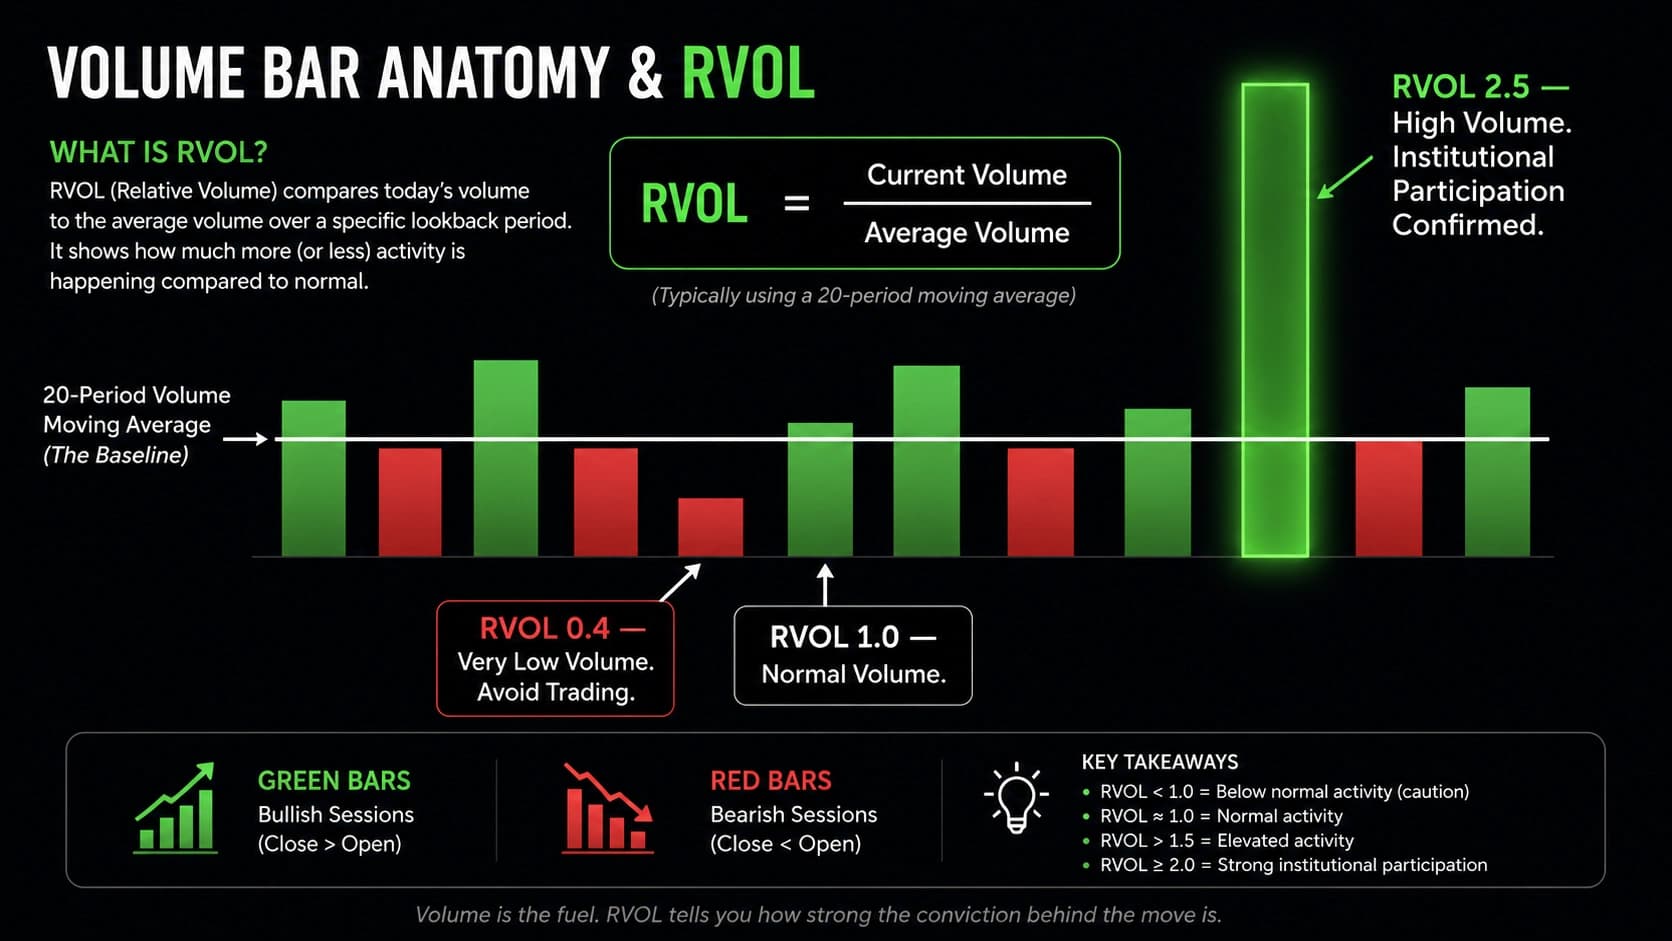
Absolute volume numbers are meaningless without context. A stock trading 500,000 shares might be extremely active or below average depending on its normal volume. Relative Volume (RVOL) provides the context.
RVOL = Current Volume ÷ Average Volume (20-period)
RVOL interpretation:
- RVOL < 0.5: Very low volume — avoid trading; moves lack conviction
- RVOL 0.5–1.0: Below-average volume — proceed with caution
- RVOL 1.0–1.5: Average to slightly above — normal conditions
- RVOL 1.5–2.0: Above average — meaningful institutional participation
- RVOL > 2.0: High volume — likely news-driven, strong institutional involvement; RVOL above 2.0 typically signals a tradable, news-driven day
For NSE intraday traders, RVOL is most useful when calculated against the same time-of-day average — comparing the first 30 minutes' volume against the average first 30 minutes' volume from the past 20 sessions. This accounts for the natural volume pattern of NSE sessions (high at open, declining at midday, recovering at close).
Volume Divergence — The Early Warning System
Volume divergence is the disagreement between price direction and volume direction. It is one of the most powerful early-warning signals in technical analysis.
Bearish Volume Divergence: Price makes a new high. Volume on the move to that new high is lower than the volume on the previous high.
Meaning: Buyers reached a new price extreme but with less participation than before. The rally is weakening. Fewer institutions are driving the price to the new high — the uptrend is running on fading fuel.
Signal: Potential trend reversal or significant correction approaching
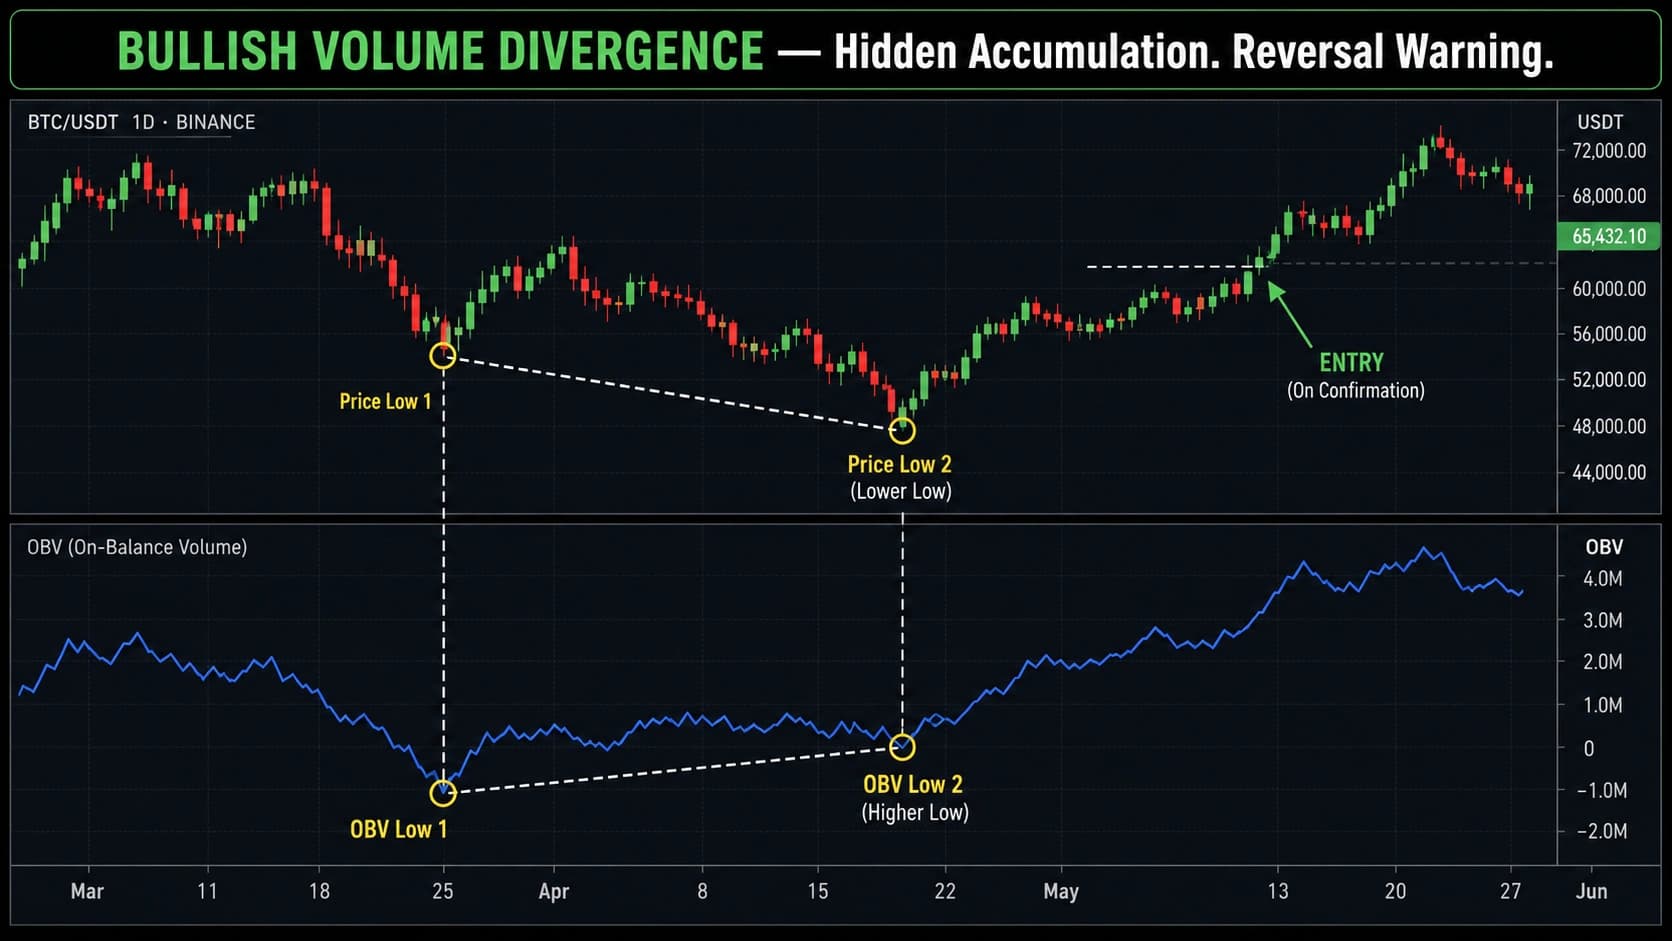
Bullish Volume Divergence: Price makes a new low. Volume on the move to that new low is lower than the volume on the previous low.
Meaning: Sellers reached a new price extreme but with less participation than before. The decline is weakening. Fewer institutions are actively selling — the downtrend is losing momentum.
Signal: Potential trend reversal or bounce approaching
The critical warning: Volume divergence is an early warning, not an immediate trigger. Divergence can persist for multiple sessions before the reversal materialises. Always require a price confirmation signal (candlestick pattern, support break, or trendline break) before acting on a divergence.
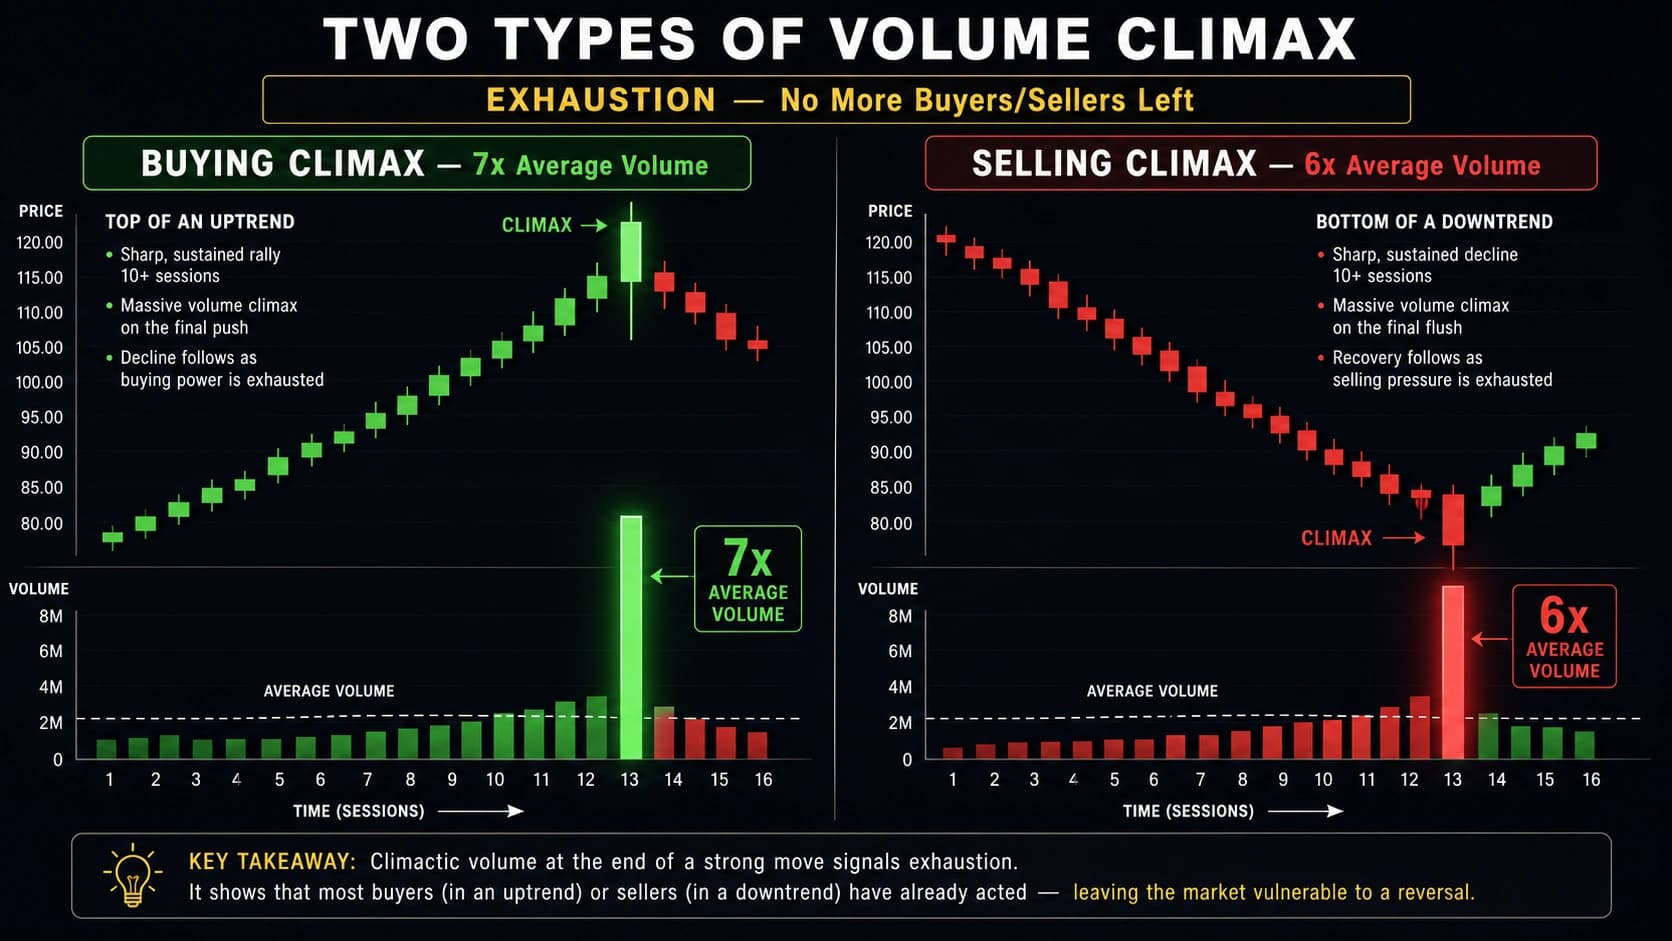
Volume Climax — The Exhaustion Signal
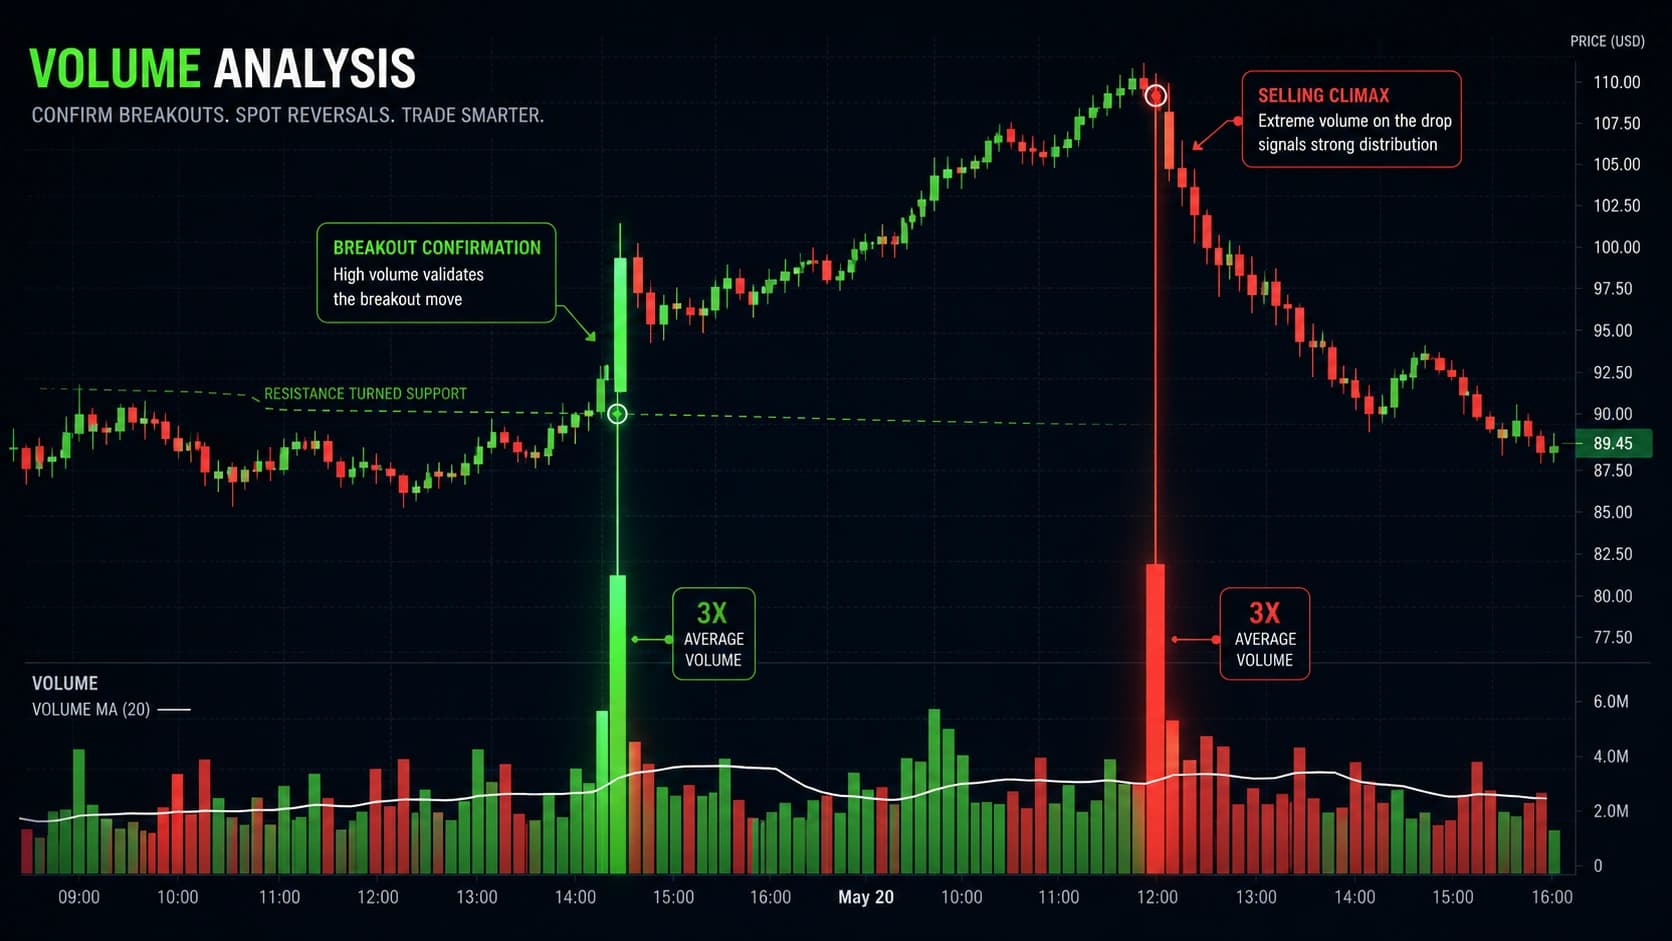
A volume climax is a single bar (or short cluster of bars) that prints far above average volume — typically 3–10× the recent average — at the end of an extended price move.
The climax logic: When volume explodes to extreme levels at the end of a trend, it signals that the final wave of participants is entering the trade simultaneously — a panic-buying top or a capitulation-selling bottom. After the climax, there are no more buyers (at a top) or sellers (at a bottom) willing to continue driving price in that direction. Exhaustion has set in.
Buying climax (top signal): At the end of an extended uptrend, a single session with extreme volume (3–10× average) as price reaches new highs. The next session often shows reversal — the last buyers have entered and there is no one left to continue buying.
Selling climax (bottom signal): At the end of an extended downtrend, a single session with extreme volume (3–10× average) as price reaches new lows. The next session often reverses — all the panic sellers have exited and buying interest absorbs the remaining selling pressure.
A volume climax bar after a long trend is the tape's loudest reversal signal.
Volume Dry-Up — The Coiling Spring
Volume dry-up occurs during a consolidation phase when volume declines to significantly below-average levels — often 50–70% below the 20-day average — for multiple consecutive sessions.
The logic: When price consolidates on very low volume, sellers are not pressing the position lower (which would require volume) and buyers are not aggressively accumulating yet. The market is in equilibrium — but the low volume means the equilibrium is fragile. When the next catalyst arrives, the breakout direction will be decisive because it is breaking from a position of maximum compression.
A consolidation on very low volume often precedes a breakout. The longer and more sustained the dry-up, the more explosive the subsequent breakout tends to be.
Visual identification: A period of narrowing price range with declining volume bars — each bar shorter than the previous — followed by a sudden volume expansion.
Volume and the NSE FII/DII Data
Indian equity traders have a unique additional volume resource that global traders lack: the daily FII (Foreign Institutional Investor) and DII (Domestic Institutional Investor) provisional data published by NSE.
This data shows the net buying (positive) or net selling (negative) by these two major institutional categories in the equity cash segment, derivatives segment, and total combined. When FII net buying is surging (strongly positive numbers, consistently positive for 3–5 sessions), institutional accumulation is occurring across the market. When FII net selling is surging, institutional distribution is in progress.
Combining technical volume analysis (what the chart's volume bars show) with FII/DII flow data (what the institutional reports show) gives NSE traders a two-dimensional view of institutional participation that chart volume alone cannot provide.
Part 3: Volume Indicators — The Complete Toolkit
1. Standard Volume Bars (Foundation)
The basic volume histogram shown at the bottom of every chart. Each bar's height represents the number of shares traded during that period.
How to read them:
- Height = magnitude of participation
- Colour = net direction of the session
- Trend in bar heights = whether participation is increasing or decreasing
Most traders overlook the simple volume bar in favour of more complex indicators — which is a mistake. The basic volume bars, when read correctly with reference to the recent average, provide most of the information needed for volume-based trading decisions.
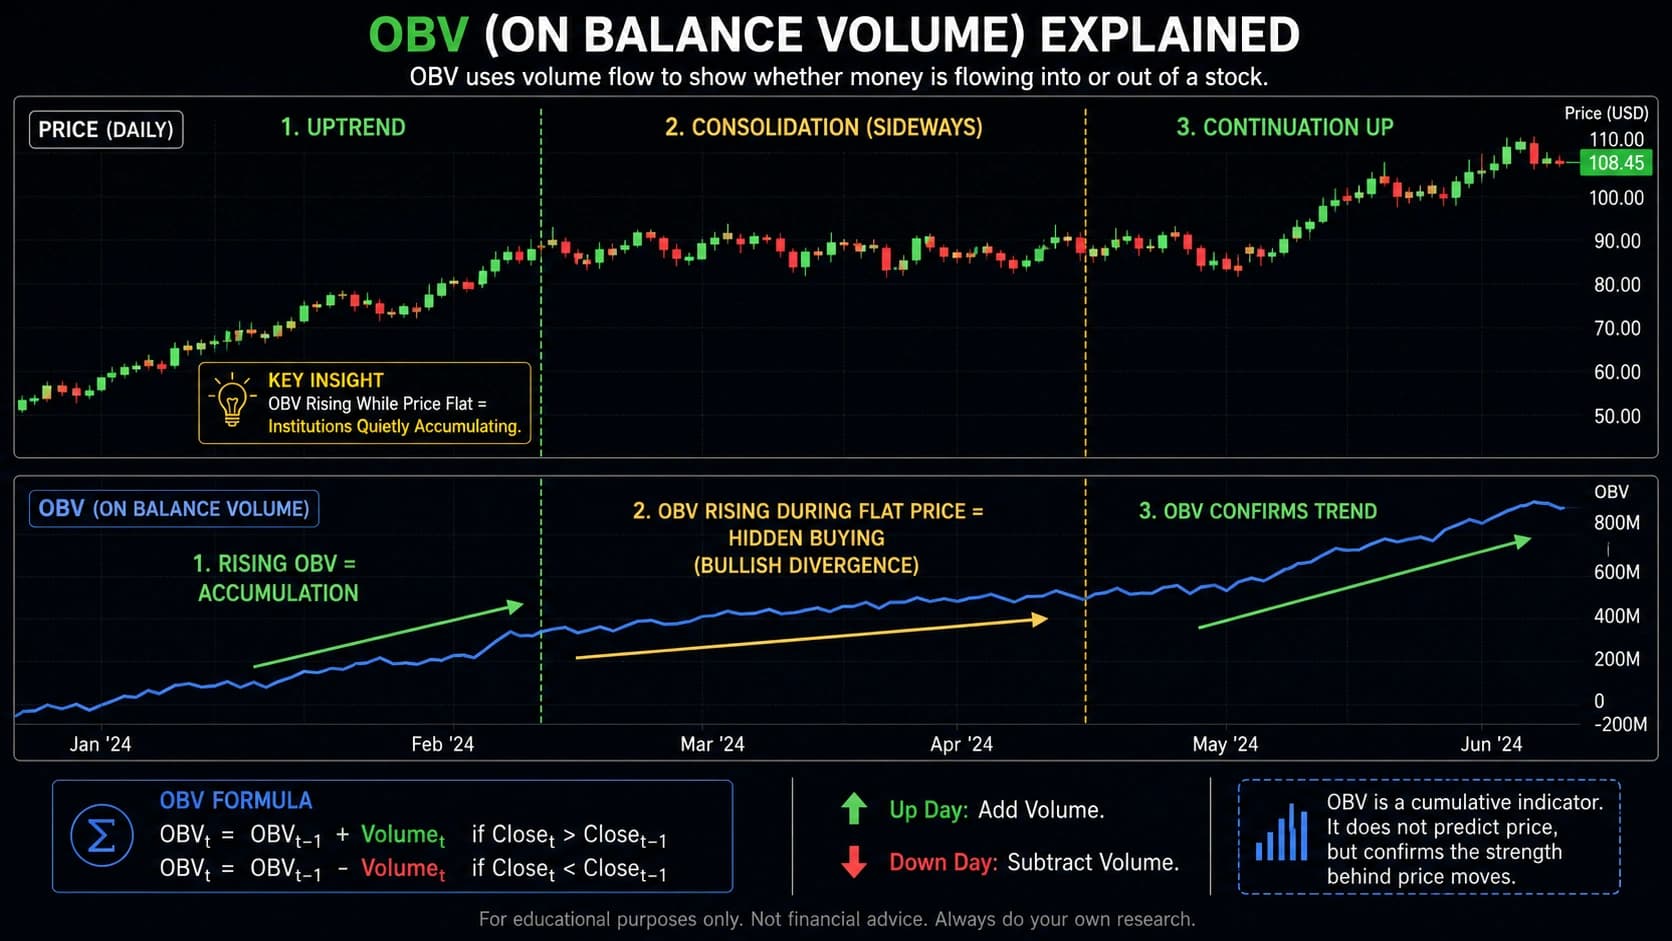
2. On Balance Volume (OBV) — Cumulative Flow
Developed by Joseph Granville in 1963 and introduced in his book Granville's New Key to Stock Market Profits, OBV is a cumulative volume indicator that adds volume on up-days and subtracts volume on down-days.
OBV Formula:
If Close > Prior Close: OBV = Prior OBV + Volume
If Close < Prior Close: OBV = Prior OBV − Volume
If Close = Prior Close: OBV = Prior OBV
OBV interpretation:
- Rising OBV: Volume is flowing in on up-days more than leaving on down-days — accumulation (buying pressure)
- Falling OBV: Volume is leaving on down-days more than coming in on up-days — distribution (selling pressure)
- OBV divergence (bullish): Price makes a new low but OBV makes a higher low — buying pressure is quietly building despite declining prices
- OBV divergence (bearish): Price makes a new high but OBV makes a lower high — the rally lacks volume conviction
A rising OBV means volume on up days consistently exceeds down-day volume, suggesting accumulation. A falling OBV means distribution.
OBV is a leading indicator. It often shows accumulation or distribution before price reflects it — giving early warning of upcoming directional moves.
3. VWAP (Volume Weighted Average Price)
VWAP is simultaneously a price and volume indicator — the single most important intraday volume tool for NSE traders. VWAP acts as a dynamic mean: price above VWAP with rising volume favours buyers; price below VWAP with rising volume favours sellers.
Volume + VWAP reading:
- Price above VWAP + volume increasing — strong bullish intraday momentum
- Price below VWAP + volume increasing — strong bearish intraday momentum
- Price at VWAP + volume declining — indecision, wait for resolution
- Price at VWAP + volume spike — institutional decision point — watch for direction
4. Volume Profile (Point of Control and Value Area)
Volume Profile plots volume traded at each price level over a specified period, rather than across time. This reveals:
High Volume Nodes (HVN): Price levels where enormous volumes were traded. These areas act as magnets — price tends to return to them and consolidate around them. They represent strong support or resistance because many participants are anchored to those prices.
Low Volume Nodes (LVN): Price levels where very little volume was traded. Price tends to move rapidly through these zones — they represent price vacuum areas where supply and demand are both thin.
Point of Control (POC): The single price level with the highest volume in the Profile. This is the "fairest price" of the measured period — the level where the most agreement (most trades) occurred. Price gravitates toward the POC.
Value Area: The price range containing 70% of the total volume. Price inside the Value Area is considered "at fair value." Price outside the Value Area is considered either expensive (above) or cheap (below).
Pro Tip: On NSE, the daily Volume Profile's Point of Control often aligns with VWAP by midday — both reflect the volume-weighted fair value of the session. When the POC and VWAP coincide at the same price level, that level becomes the strongest intraday support or resistance reference available, backed by two independent volume-based measures.
Part 4: How to Set Up Volume on Your Charts
TradingView Setup
Volume is built into TradingView and appears at the bottom of every chart by default.
Customising volume display:
- Click on the "Volume" label in the bottom panel
- In Settings, change bar colours if needed (standard: green for bullish sessions, red for bearish)
- Optionally add a Volume MA (volume moving average): In the Volume indicator settings, enable "Volume MA" and set to 20 periods — this shows the average volume line, making it easy to visually identify above/below average bars
Adding OBV:
- Click Indicators → Search "OBV"
- Add "On Balance Volume" — it appears as a separate panel
- No settings adjustment needed; the formula applies automatically
Adding Volume Profile: Available on TradingView Pro and above. Indicators → Search "Volume Profile Fixed Range" or "Volume Profile Visible Range." Apply to any selected range on the chart. The POC appears as the highest horizontal bar.
Zerodha Kite Setup
Volume bars are displayed by default on all Zerodha Kite charts. To add a volume moving average:
- Right-click on volume bars → Add Indicator on Volume
- Select "Moving Average" → set to 20 periods
- The volume average line appears within the volume panel
The Visual Volume Reading Rule
Before any trade, spend 5 seconds looking at the volume panel:
- Is the recent volume above or below the 20-period average? (Is the bar taller or shorter than the average line?)
- Is volume trending up or down over the last 5–10 bars? (Rising volume = increasing participation; falling volume = declining participation)
- Is the current bar's volume exceptional? (More than 2× the average = significant institutional activity)
These three questions take 5 seconds and provide the volume context for every price action decision.
Part 5: Five Complete Volume Trading Strategies
Strategy 1 — Volume Breakout Confirmation
The most fundamental volume strategy — only trading resistance breakouts or support breakdowns when volume confirms the move.
A valid breakout should be accompanied by volume at least 1.5× to 2× the average daily volume. If price breaks above resistance on below-average volume, the breakout is more likely to fail.
Setup conditions:
Step 1 — Identify a significant resistance level: Prior swing high, round number, or horizontal resistance zone that has held 2+ times.
Step 2 — Watch for the breakout: Price approaches and closes above the resistance level.
Step 3 — Check the volume bar: The breakout candle's volume must be at least 1.5× the 20-session average. Ideally 2× or more. RVOL > 1.5 is the minimum; RVOL > 2.0 is confirmation of institutional breakout participation.
Step 4 — Confirm with the breakout candle: The candle should close near its high (minimal upper wick) — showing buyers maintained control throughout the session, not just briefly spiked above resistance.
Entry: At the close of the confirmed breakout candle, or on the next session's open
Stop Loss: Below the resistance level (now new support via Role Reversal). If price falls back below the broken resistance, the breakout has failed regardless of the initial volume.
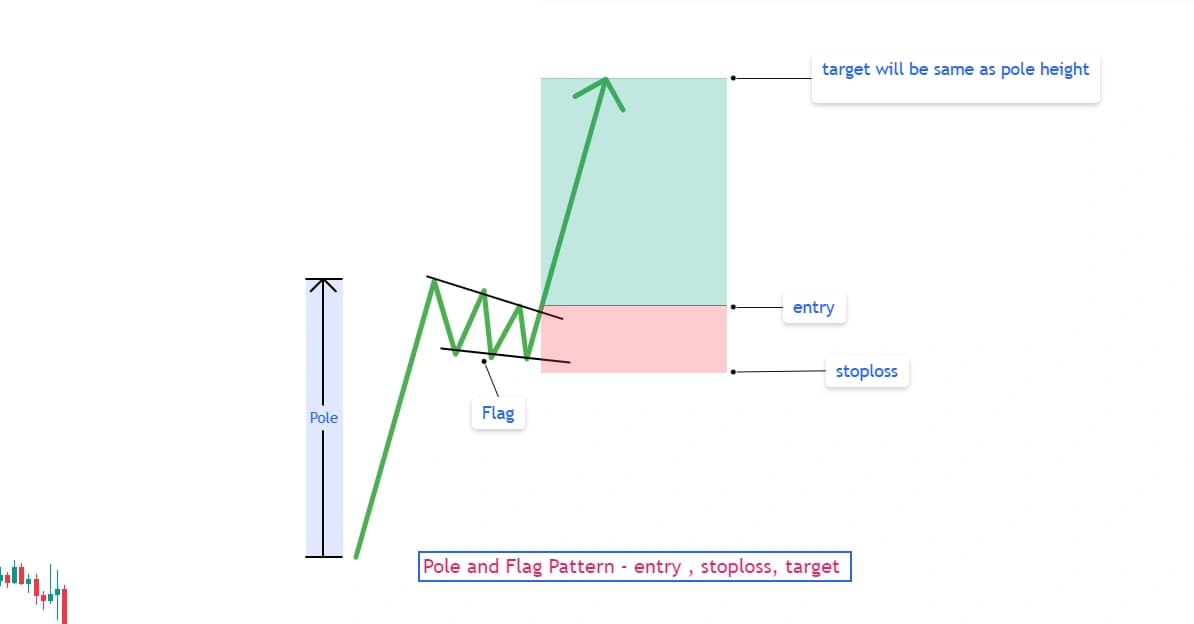
Target: Measured move — the width of the preceding consolidation projected above the breakout point. Alternatively, the next significant resistance level above.
The failed breakout pattern: When stocks break critical levels without volume, consider the breakout suspect and prime for a reversal off the highs/lows. Low-volume breakouts attract stop-hunt reversals — institutions drive price above resistance to trigger buy-stop orders, collect that liquidity, then reverse downward. The volume filter eliminates the majority of these false breakouts.
NSE example: Reliance Industries (₹2,800+ crore daily turnover — highest on NSE) breaks above a 3-month resistance at ₹2,950 with RVOL of 2.8 and a large bullish candle closing near its high.
- Entry: ₹2,955 (breakout candle close)
- Stop: ₹2,925 (below the broken resistance zone)
- Target: ₹3,070 (measured move from prior consolidation width ₹120)
- R:R: 3.8:1 ✓
Pro Tip: For NSE stocks, always check whether a high-RVOL breakout coincides with a positive FII net-buying session (from the NSE FII/DII provisional data). A technical breakout confirmed by both RVOL > 2.0 and FII net buying > ₹1,000 crore in the stock's sector is the highest-conviction long entry available to Indian equity traders.
Strategy 2 — OBV Divergence Strategy
Using the On Balance Volume (OBV) indicator to detect hidden accumulation or distribution before price reflects it — catching reversals early with the advantage of an early warning signal.
Bullish OBV Divergence setup (potential bottom):
Condition 1: Price is in a downtrend, making lower lows Condition 2: OBV makes a higher low as price makes a new low — OBV does not confirm the new price low Condition 3: This divergence suggests that down-day selling volume is being exceeded by up-day buying volume — accumulation is occurring quietly while price still appears bearish
Confirmation required: A divergence is a warning, not a trade trigger. Wait for:
- A bullish candlestick pattern at the price new low (Hammer, Bullish Engulfing, Morning Star)
- OBV breaking above a minor high in the OBV panel
- Price breaking above a minor price high (the most recent swing high between the two divergence points)
Entry: At the candlestick confirmation signal, after OBV has confirmed the divergence Stop: Below the new low in price (below the divergence point) Target: The previous swing high (where the downtrend began)
Bearish OBV Divergence setup (potential top):
Condition 1: Price is in an uptrend, making higher highs Condition 2: OBV makes a lower high as price makes a new high — OBV does not confirm the new price high Condition 3: This suggests that up-day buying volume is being exceeded by down-day selling volume — distribution is occurring while price appears bullish
When price makes a new high but OBV makes a lower high, the rally lacks volume conviction. Sellers are gradually gaining control even as price rises, warning that the uptrend may be running on fading participation.
Confirmation: Bearish candlestick at the price new high (Shooting Star, Bearish Engulfing) + OBV breaking below a prior OBV low
Entry: At the bearish candlestick confirmation Stop: Above the price new high Target: Previous swing low below
Strategy 3 — Volume Climax Reversal
Identifying the volume climax — the extreme volume spike at the end of a trend — and trading the subsequent reversal.
Identifying a genuine volume climax:
Criteria:
- Extended trend: The price has been trending in one direction for at least 7–10 sessions
- Climax volume: A single session prints 3–10× the recent average volume
- Price behaviour on the climax day: For a buying climax (top), the session shows wide range and closes near the high but the next session gaps down or opens lower; for a selling climax (bottom), the session shows wide range closing near the low but the next session reverses strongly
Buying Climax Reversal (Bearish Setup):
The sequence:
- Price has been rallying for 7–10+ sessions
- One session shows extreme volume (3–10× average) with a large bullish candle
- The following session opens lower or shows a bearish reversal (Shooting Star, Bearish Engulfing)
- Volume on the reversal session is also above average
Entry: At the close of the bearish confirmation candle the session after the climax Stop: Above the climax session's high (the absolute peak of the buying climax) Target: A measured retracement of the prior trend — minimum 38.2% Fibonacci retracement of the entire rally
Selling Climax Reversal (Bullish Setup):
The sequence:
- Price has been declining for 7–10+ sessions
- One session shows extreme volume (3–10× average) with a large bearish candle (the capitulation)
- The following session opens higher or shows a bullish reversal (Hammer, Bullish Engulfing, Morning Star Day 2)
- Volume on the reversal session is above average
Entry: At the close of the bullish confirmation candle the session after the climax Stop: Below the climax session's low (the absolute bottom of the selling climax) Target: 50% retracement of the prior downtrend as a minimum
Why the climax reversal is high-probability: The extreme volume spike at the end of a trend represents the final, panicked wave of participants entering in the trend direction. After this exhaustion point, the remaining pool of potential buyers (at tops) or sellers (at bottoms) has been depleted. The subsequent reversal has no more fuel to fight it.
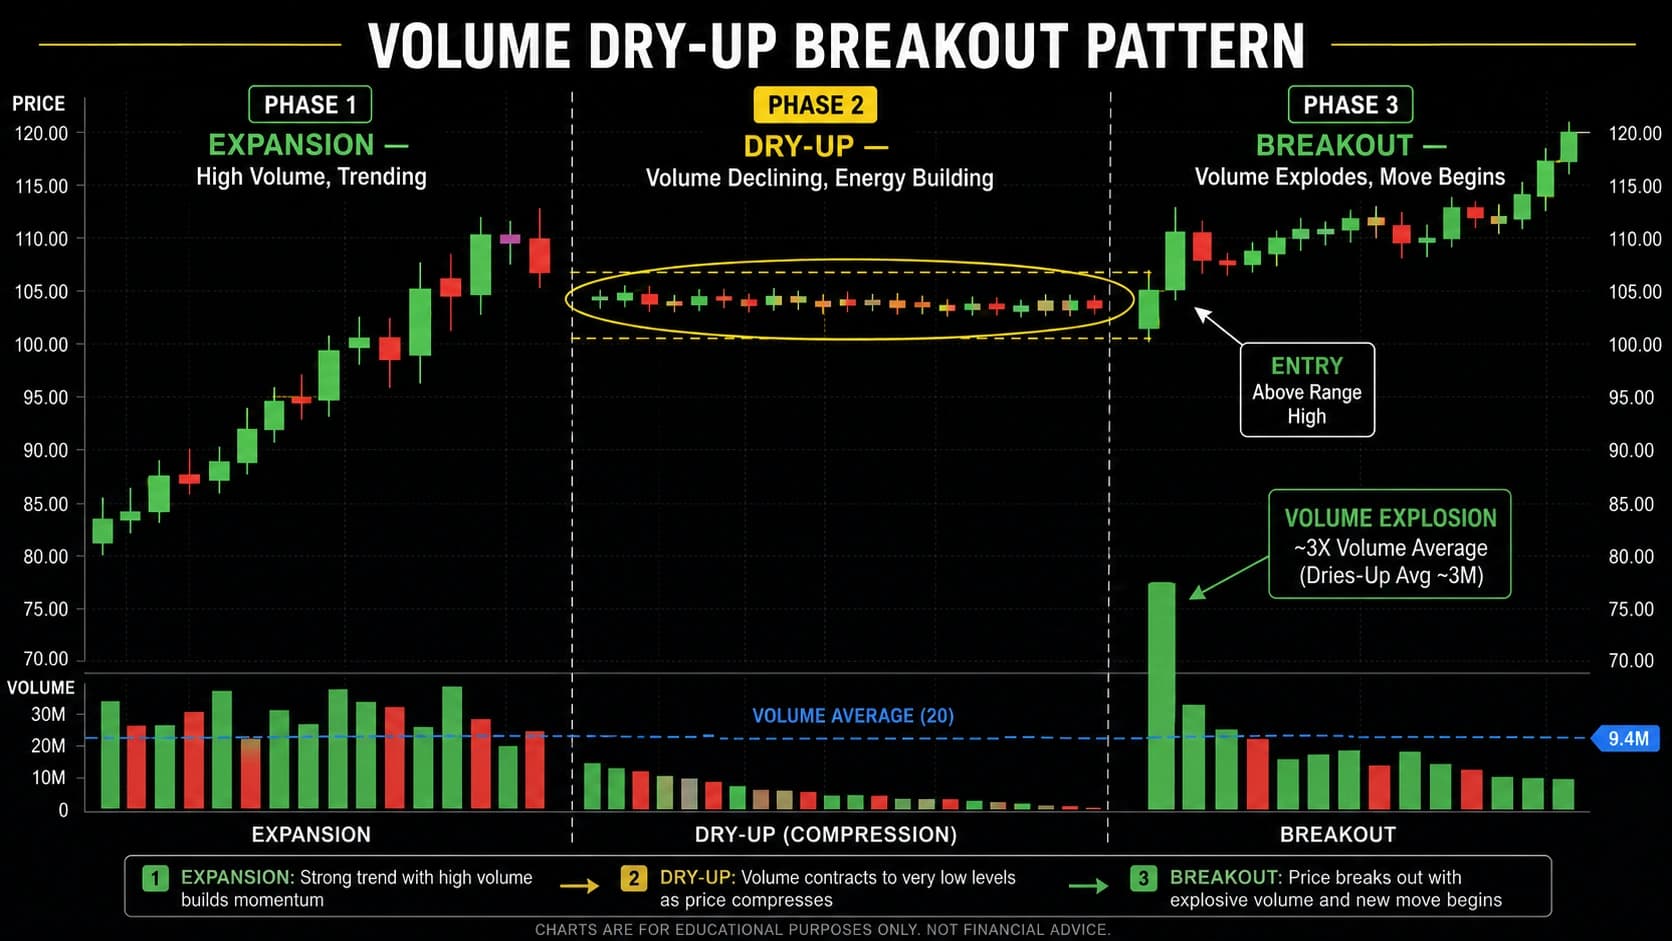
Strategy 4 — Volume Dry-Up Breakout
Identifying the volume dry-up period during consolidation and positioning for the subsequent breakout when volume returns.
The three-phase pattern:
- Phase 1 — Expansion: Price makes a significant move (trend) with high volume
- Phase 2 — Dry-Up: Price consolidates in a tight range; volume declines to 50–70% below average for 5–15 sessions
- Phase 3 — Breakout: Volume suddenly expands (2× or more above average) and price breaks out of the consolidation range
Identifying the dry-up phase:
- Volume bars are progressively getting shorter (each session's volume lower than the previous)
- Price range is tightening (both high and low prices converging toward a narrow band)
- BBW (Bollinger BandWidth) is also contracting — the Bollinger Squeeze and Volume Dry-Up often coincide
The directional bias during dry-up: The dry-up itself doesn't tell you which direction the breakout will go. Use these signals to determine bias:
- Prior trend direction (most dry-up breakouts resolve in the direction of the trend that preceded the consolidation)
- RSI during the dry-up (above 50 = bullish bias; below 50 = bearish bias)
- OBV during the dry-up (rising OBV during flat/declining price = accumulation = bullish breakout likely)
Entry: On the first session where volume expands significantly (RVOL > 1.5) AND price closes clearly in one direction beyond the consolidation range
Stop: Below the low of the consolidation range (for bullish breakouts) or above the high (for bearish breakouts)
Target: The width of the consolidation range projected from the breakout point
Strategy 5 — Volume + Candlestick Confirmation
The highest-precision strategy — combining volume analysis with specific candlestick patterns at key S/R levels to create three-factor confirmation entries.
Why three-factor confirmation works: Every major strategy in this cluster — RSI, Bollinger Bands, Support/Resistance — works better when combined with volume confirmation. Adding volume as the third factor (after price location and candlestick pattern) creates the highest-probability trade setups available.
The three-factor confirmation framework:
| Factor | What It Provides | Example |
|---|---|---|
| S/R Level | Location — where to trade | Horizontal support at ₹1,600 |
| Candlestick Pattern | Timing — when buyers/sellers step in | Hammer forming at ₹1,600 |
| Volume Confirmation | Conviction — institutional backing | RVOL > 2.0 on Hammer session |
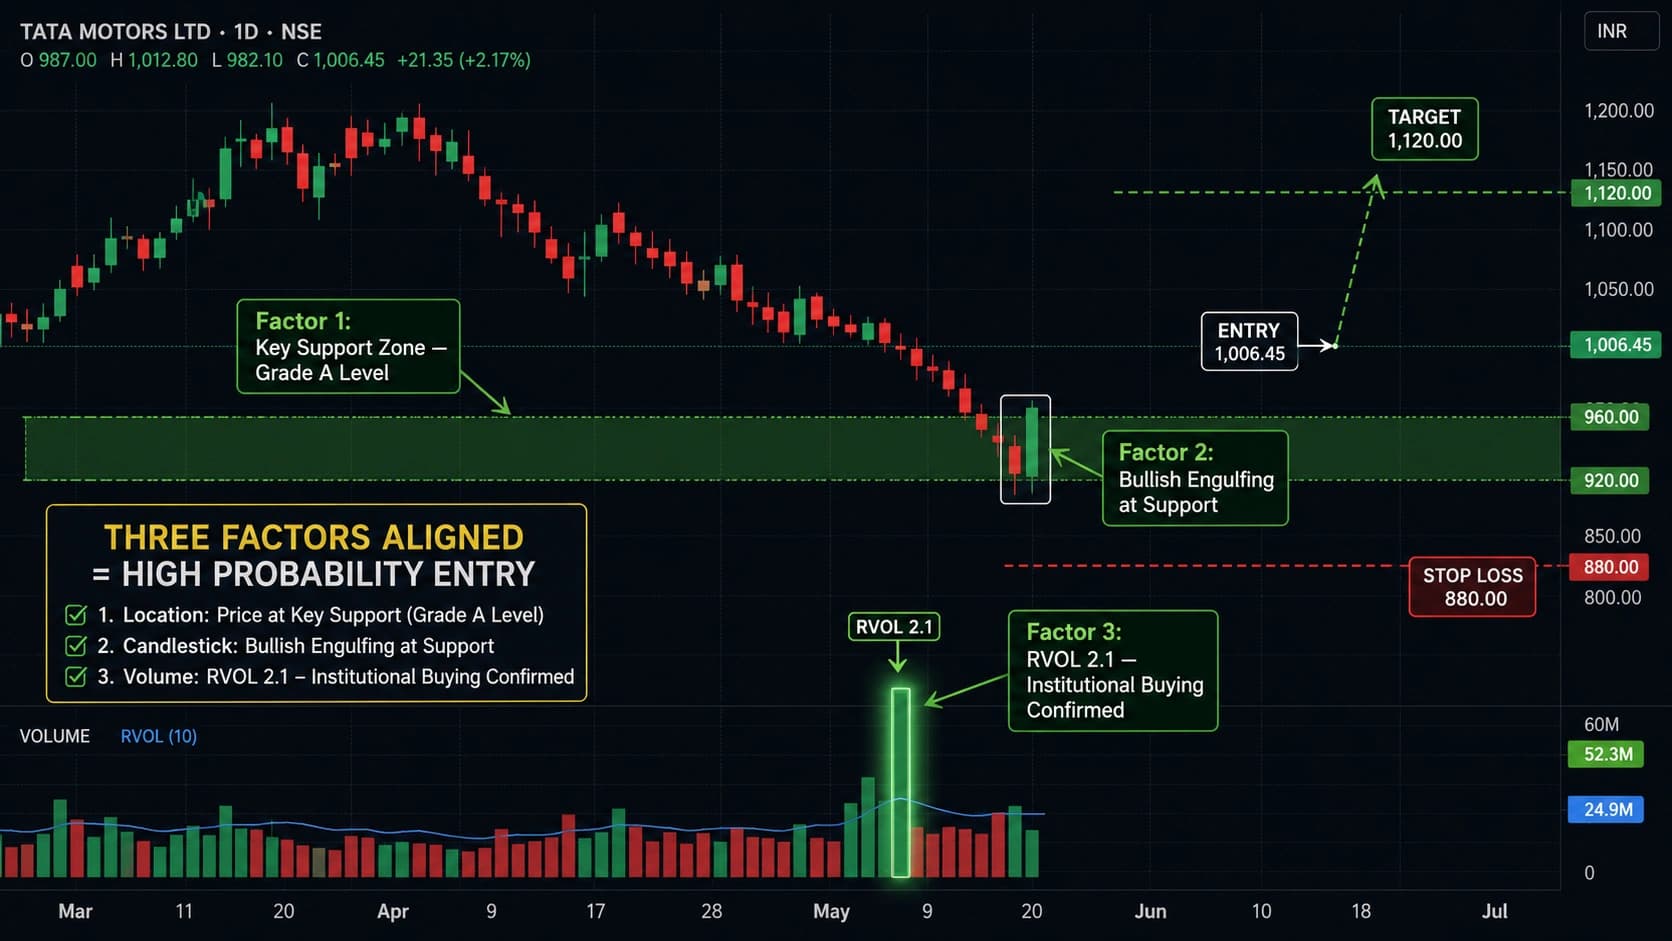
Complete bullish three-factor setup:
Factor 1 — Location: Price is at a confirmed Grade A support level (3+ prior touches, tested on high volume)
Factor 2 — Candlestick: A Hammer, Bullish Engulfing, or Morning Star forms at the support level
Factor 3 — Volume: The confirmation candle (Hammer or Day 3 of Morning Star) has volume at least 1.5× the 20-session average. Volume should be visibly above average — the bar should stand clearly taller than recent bars
Entry: At the close of the confirming candlestick
Stop: Below the support zone's lower boundary (below the pattern low)
Target: The next resistance level above — minimum 2:1 risk-reward
Complete bearish three-factor setup:
Factor 1: Price at a confirmed resistance level Factor 2: Shooting Star or Bearish Engulfing at resistance Factor 3: RVOL > 1.5 on the bearish candle session
Entry: At the close of the bearish candle Stop: Above the resistance zone high Target: Next support below
The NSE three-factor setup in action: Heavy volume during a breakout (150% of the 20-day average) signals institutional involvement and reliable momentum. Conversely, weak volume may indicate a false move. The three-factor framework turns this principle into a precise, repeatable entry checklist.
Part 6: Volume Analysis for NSE — India-Specific Considerations
FII/DII Data as Macro Volume Context
Indian equity traders have an advantage over global traders: the NSE publishes provisional FII and DII buying/selling data every day after market hours. This macro institutional volume data should be the first thing checked every evening for the next session's preparation.
How to read FII/DII data for volume context:
FII Net Buying > ₹2,000 crore: Strong institutional demand in the market. Technical volume signals (RVOL, breakouts) are more reliable the following day — institutional tailwind supports the moves.
FII Net Selling > ₹2,000 crore: Institutional distribution. Volume breakouts on individual stocks are more suspect — even high-RVOL breakouts can reverse when broader FII selling pressure dominates.
FII and DII divergence: When FII is net selling but DII is net buying (domestic institutional support), the market often shows a tug-of-war with choppy, less directional price action. Technical volume signals have lower reliability on these days.
Pre-Market Volume Shockers
On NSE, the pre-open session (9:00–9:15 AM IST) shows call auction volumes for individual stocks. A stock showing pre-open volume 5× or more above its normal first-30-minutes average is a "volume shocker" — a significant event (results, news, analyst action) has triggered early institutional positioning.
These pre-market volume shockers are among the best intraday trading candidates because:
- The high pre-open volume confirms genuine institutional interest
- The direction of the gap (up or down) provides a directional bias
- The subsequent intraday session often continues the gap direction after the initial volatility settles
Screen for pre-open volume shockers using the NSE website's "Pre-Open Market" data or your broker's platform at 9:00 AM daily.
Volume Patterns Specific to NSE Sessions
Opening volume (9:15–9:20 AM): Always highest of the session as overnight orders clear. Don't interpret the first 5-minute candle's volume as "high interest" — it is structurally elevated.
First 30 minutes (9:15–9:45 AM): The most institutionally active window. RVOL above 3.0 in this window suggests major news or event-driven activity. This is the window where selling climaxes (if bearish session) or buying climaxes (if bullish gap with reversal) are most likely.
Midday (11:30 AM–1:30 PM): Volume always drops. RVOL typically falls to 0.3–0.5. Low volume breakouts during this period are the most unreliable of the session.
Closing volume (2:30 PM–3:30 PM): Volume surges as institutional desks close positions and index rebalancing occurs. High-RVOL moves in the last 30 minutes of the session can be significant or simply mechanical (index constituent rebalancing). Always check for news context.
Part 7: Volume Mistakes and Exact Fixes
Mistake 1 — Ignoring Volume Entirely
Many traders focus exclusively on price patterns, candlesticks, and indicator readings — never checking whether a trade setup has volume backing.
The fix: Make RVOL checking a mandatory step before every trade. Before entering any position, look at the volume bar of the entry candle and compare it to the 20-session average. Require RVOL ≥ 1.0 as the minimum for any entry. For breakouts, require RVOL ≥ 1.5.
Mistake 2 — Treating Every Volume Spike as a Signal
Assuming every high-volume session represents a directional signal — buying when any volume spike occurs, regardless of whether it is a breakout, a climax, or random noise.
The fix: Context determines what a volume spike means. A volume spike at the end of an extended trend (climax) is a potential reversal signal. A volume spike at a breakout of resistance is a continuation signal. A volume spike at the peak of a news announcement on a random day is noise. Always interpret volume within its price and trend context.
Mistake 3 — Trading Low-Volume Breakouts
Entering a resistance breakout when the breakout candle has below-average volume, rationalising that "price broke the level so it must be valid."
The fix: Low-volume breakouts fail at a much higher rate than high-volume breakouts. Without volume above the 20-session average, the breakout lacks institutional backing. It is likely a false breakout designed to trigger stop orders before reversing. Require RVOL ≥ 1.5 on every breakout candle — without it, skip the trade.
Mistake 4 — Confusing OBV Direction with Price Direction
Seeing OBV rising and concluding the stock will go up without verifying whether price is confirming or diverging from OBV.
The fix: OBV is most useful when it DIVERGES from price — not when it moves with it. Rising OBV during rising price is confirmation (meaningful but expected). Rising OBV during falling or flat price is divergence (the real signal — hidden accumulation). Always compare OBV direction to price direction to determine whether you have confirmation or divergence.
Mistake 5 — Missing the Volume Dry-Up
Noticing price consolidation but not checking whether volume is declining during the consolidation — missing the setup for the explosive breakout that follows.
The fix: Add a 20-period volume moving average to your chart. When multiple consecutive volume bars are below this average AND the bars are getting progressively shorter — that is the dry-up setup. Set an alert for when volume expands back above the average in the consolidation zone. When that alert fires, watch for the breakout candle.
Mistake 6 — Using Volume in Isolation
Building an entire trading system around volume signals without incorporating price structure, S/R levels, or candlestick confirmation.
The fix: Volume is a confirmation tool, not a standalone trading system. It answers "was there institutional conviction behind this move?" — not "should I buy or sell here?" Always combine volume analysis with at least one other element: a key S/R level (location), a candlestick pattern (timing), or an indicator (RSI for momentum context).
FAQ
Q: What is volume analysis in trading? Volume analysis is the study of trading volume — the number of shares changing hands during a period — to assess the conviction behind price moves. High volume confirms that a price move has genuine institutional participation; low volume suggests the move lacks backing. Volume analysis uses techniques including relative volume (RVOL) comparison, OBV divergence, volume climax identification, volume dry-up detection, and Volume Profile analysis to provide context for every price action decision.
Q: What is relative volume (RVOL) and how do I use it? Relative Volume (RVOL) compares the current session's volume to the average volume over a recent period (typically 20 sessions). Formula: RVOL = Current Volume ÷ Average Volume. RVOL above 2.0 typically signals a tradable, news-driven day with significant institutional participation. For breakout trading, require RVOL of at least 1.5 on the breakout candle. RVOL below 0.5 indicates very low-conviction moves that should be avoided.
Q: What is OBV (On Balance Volume) and how do I trade it? OBV is a cumulative volume indicator that adds volume on up-days and subtracts on down-days. Rising OBV suggests accumulation (buying exceeds selling); falling OBV suggests distribution. The most powerful OBV signal is divergence: bullish divergence (price makes a new low but OBV makes a higher low) signals hidden accumulation before a reversal. Bearish divergence (price makes a new high but OBV makes a lower high) signals distribution before a decline. Always wait for a price confirmation signal before acting on OBV divergence alone.
Q: What is a volume climax and what does it signal? A volume climax is a single bar printing 3–10× the average volume at the end of an extended trend. A buying climax (at the top of an uptrend) represents the final wave of eager buyers entering simultaneously — after which no more buyers remain and the trend reverses. A selling climax (at the bottom of a downtrend) represents capitulation — after which no more sellers remain and the trend reverses. Climax bars are among the strongest single-bar reversal signals in technical analysis.
Q: How do I use volume to confirm breakouts in NSE stocks? For NSE breakout confirmation: the breakout candle must close above resistance with RVOL of at least 1.5× the 20-session average. If RVOL is below 1.0 on the breakout candle, treat the breakout as suspect — it may be a false breakout. For additional confirmation in Indian markets, check the FII/DII provisional data on the NSE website — if FII is net buying in the stock's sector while the breakout occurs, the institutional tailwind adds further conviction.
Q: What is the volume dry-up pattern? Volume dry-up is a period of multi-session low volume during price consolidation — typically volume at 50–70% below the 20-session average for 5–15 consecutive sessions. It signals that the market is in equilibrium and preparing for a significant directional move. The longer and more sustained the dry-up, the more explosive the subsequent breakout. Identify dry-up by watching volume bars progressively shrink below the average volume line. The breakout signal is when volume suddenly expands back above average — often 2× or more — as price exits the consolidation range.
Conclusion
Volume analysis is not an optional confirmation layer. It is the foundation upon which all reliable price action interpretation is built.
Price alone tells you what happened. Volume tells you whether institutions — the only participants with enough capital to sustain directional moves — participated in making it happen. A pattern without volume is a visual shape. A pattern confirmed by volume is a trade.
Three principles to carry forward from this guide:
1. RVOL is your institutional participation detector. Make it a mandatory check before every trade. RVOL above 1.5 on the key candle (breakout, reversal, or confirmation) means institutions are involved. RVOL below 1.0 means they are not — and moves without institutional participation rarely sustain.
2. OBV divergence is your early warning system. When price makes a new extreme but OBV does not confirm it, a reversal is building. You now have advance warning before the price chart shows any sign. Use this warning to look for confirmation — a candlestick pattern at the divergence point — and enter earlier than traders reading only price.
3. Volume context changes with price context. High volume at a breakout is continuation. High volume at the end of a trend is climax (exhaustion). Low volume in consolidation is dry-up (preparation). The same volume reading means completely different things in different contexts. Always identify the price context first, then interpret the volume within it.
Further reading: Support and Resistance: Complete Guide | RSI Trading Strategy | Bollinger Bands Trading Strategy | Important Candlestick Patterns | How to Trade Intraday Stocks in India | Dhanith Intraday Screener | Smart Money Concepts: The Complete Mastery Guide | Technical Analysis Mastery: The Complete Guide | Order Blocks: The Complete Mastery Guide | SMC Killzones: The Complete Trading Guide | 5 Best Intraday Trading Strategies for NSE India
Ready to Trade These Signals on Real Stocks?
→ Open the Dhanith Intraday Screener — find today's NSE stocks showing high RVOL breakouts and volume-confirmed setups
→ Calculate Your Risk Before Every Volume Trade — know your exact share count, stop distance, and maximum loss before you enter
→ Log Your Volume Trades in the Dhanith Journal — track which volume strategies and confirmation patterns produce your best win rate
Disclaimer: This article is for educational purposes only and does not constitute financial or investment advice. Trading involves significant risk of capital loss. Past performance does not guarantee future results. Always use proper risk management.
Have a question about this article?
Comment on our latest Instagram post or send us a DM — we reply to every one.
@dhanith_officialWas this article helpful?
Click to rate
Founder, Dhanith Trading
7+ years trading Nifty, Bank Nifty, NSE stocks, and commodities — specializing in Smart Money Concepts (SMC) and ICT price action. Founder of Dhanith — a trading journal, intraday screener, and risk tools platform built for retail traders.
Dhanith Newsletter
Enjoyed this article? Get more like it.
New trading guides, candlestick patterns, SMC strategies, and tool updates — straight to your inbox. Free, for Indian traders.
No spam. Unsubscribe anytime.
Continue Reading