On this page
- What Every Good Intraday Trading Strategy Needs
- Intraday Trading Strategy 1: Opening Range Breakout (ORB)
- How It Works
- Entry Rules
- Key Rules
- Intraday Trading Strategy 2: VWAP Breakout
- Entry Rules
- Key Rules
- Intraday Trading Strategy 3: 5 EMA / 15 EMA Rejection
- The 45-Degree Angle Filter
- Entry Rules
- Key Rules
- Intraday Trading Strategy 4: Bollinger Band Reversal
- Entry Rules
- Key Rules
- Intraday Trading Strategy 5: Candlestick Pattern at Previous Day Support / Resistance
- Entry Rules
- Key Rules
- Intraday Trading Strategy Comparison at a Glance
- How to select Stocks for Intraday Trading
- Using the Dhanith Stock Screener
- Risk Management Rules — Apply to All 5 Strategies
- Which Strategy to Start With
- Final Thoughts
- FAQ
- Related Articles
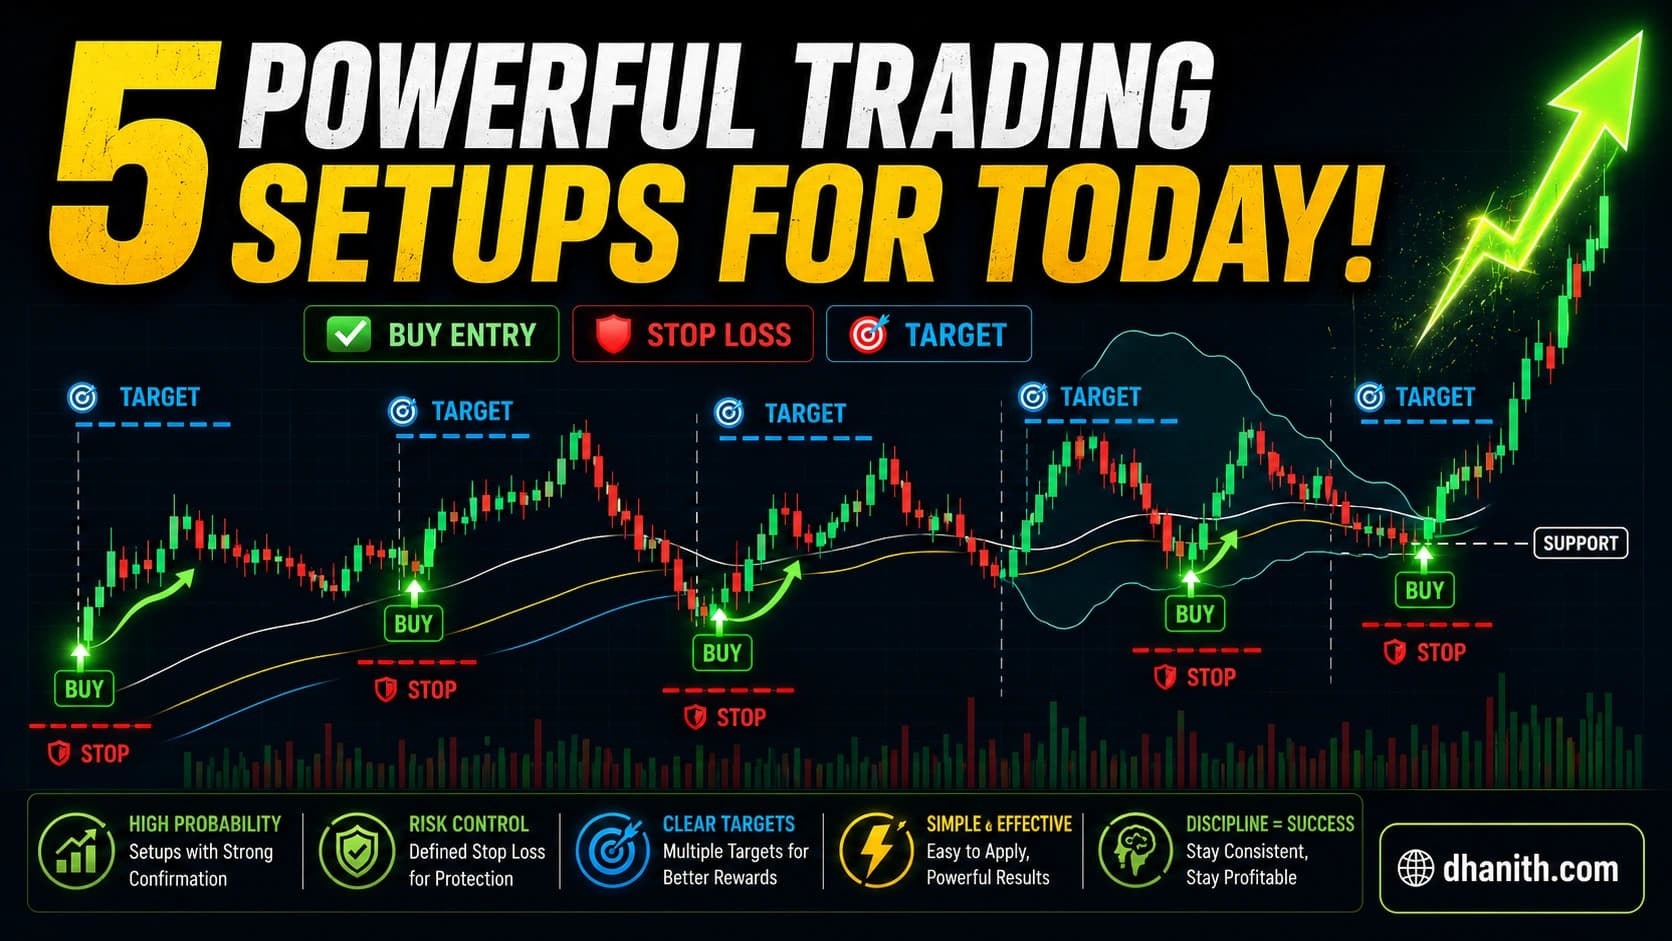
Discover the 5 best intraday trading strategies for NSE India — ORB, VWAP, EMA, Bollinger Band, and S/R patterns — with exact entry, stop loss, and target rules.
If you are trading stocks intraday on NSE, having a structured strategy is what separates consistent traders from those who guess their way through every session. The 5 best intraday trading strategies in this guide are each built around a specific, repeatable setup with a clear entry trigger, stop loss, and target — no ambiguity, no "it depends."
Each strategy is short, practical, and immediately applicable. If you want the full framework — session timing, position sizing, and a complete daily routine — see our complete guide to intraday trading in India first. The final section here covers how to find the right stocks for these setups every morning using the Dhanith Stock Screener, because having a great strategy and the wrong stock defeats the purpose.
Disclaimer: This article is for educational purposes only and does not constitute financial or investment advice. Intraday trading involves substantial risk of capital loss. Always use stop losses and consult a SEBI-registered advisor before trading with real capital.
What Every Good Intraday Trading Strategy Needs
Before the five strategies, here is the non-negotiable framework that applies to all of them:
✓ Specific, objective entry trigger
✓ Stop loss placed before entry — always
✓ Minimum 1:2 Risk:Reward ratio
✓ All positions closed before 3:15 PM
✓ Maximum 3 trades per day
If a setup does not offer a clean 1:2 R:R on a given stock that day — skip it. Move to the next one.
Intraday Trading Strategy 1: Opening Range Breakout (ORB)
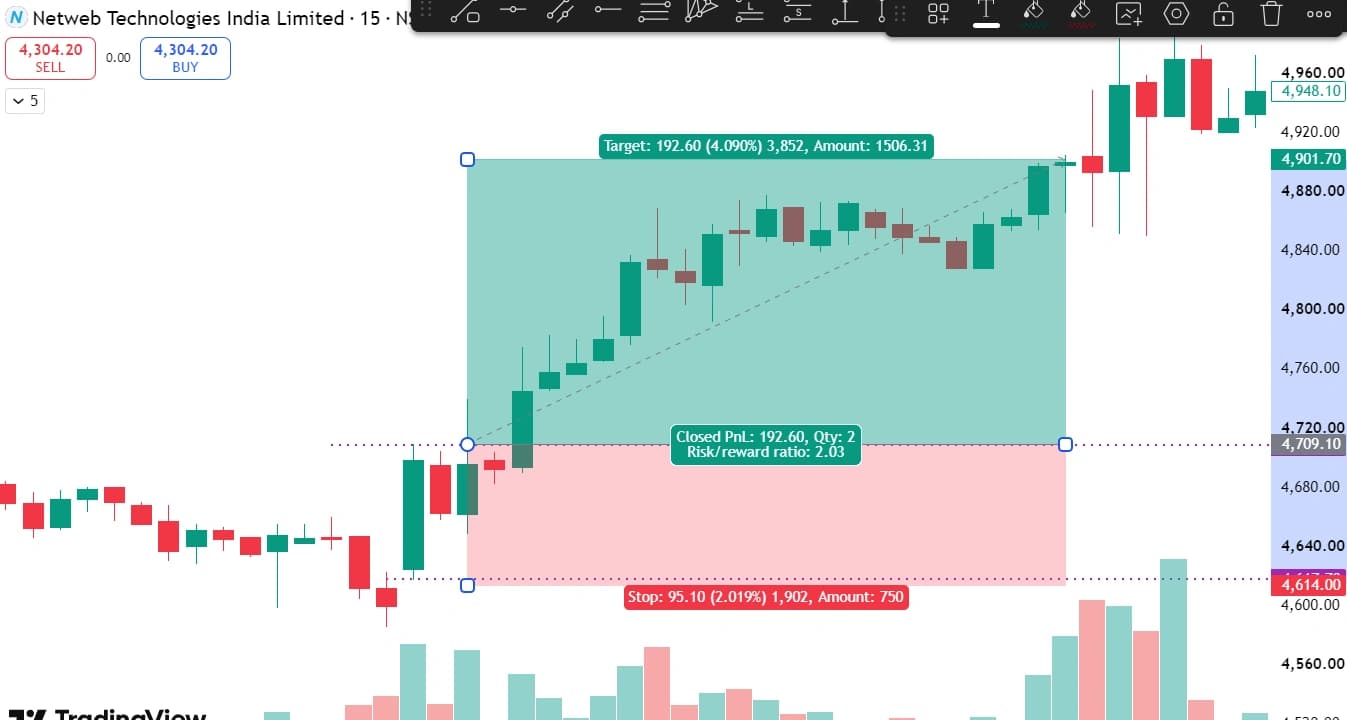
The Opening Range Breakout is one of the most effective intraday trading strategies for Indian markets. The first 15 minutes after 9:15 AM set the opening range — a sustained breakout above or below that range signals the day's directional bias.
How It Works
Opening Range = HIGH and LOW of the first 15-min candle
               (9:15 AM candle on NSE)

Do not trade during the first 15 minutes.
Observe only.
Entry Rules
Long Setup:
TRIGGER:    5-min candle closes ABOVE the 15-min
            candle high on above-average volume

ENTRY:      Close of that breakout candle

STOP LOSS:  High of the first 15-min candle
            (if price falls back inside range — exit)

TARGET:     Entry + (2 × Risk)  —  minimum 1:2 R:R
Short Setup:
TRIGGER:    5-min candle closes BELOW the 15-min
            candle low on above-average volume

ENTRY:      Close of that breakdown candle

STOP LOSS:  Low of the first 15-min candle

TARGET:     Entry - (2 × Risk)
Key Rules
- Volume on the breakout candle must be above average — no volume, no trade
- Works best when India VIX is between 12–18
- Do not trade ORB if the opening range is extremely wide (gap day)
Intraday Trading Strategy 2: VWAP Breakout
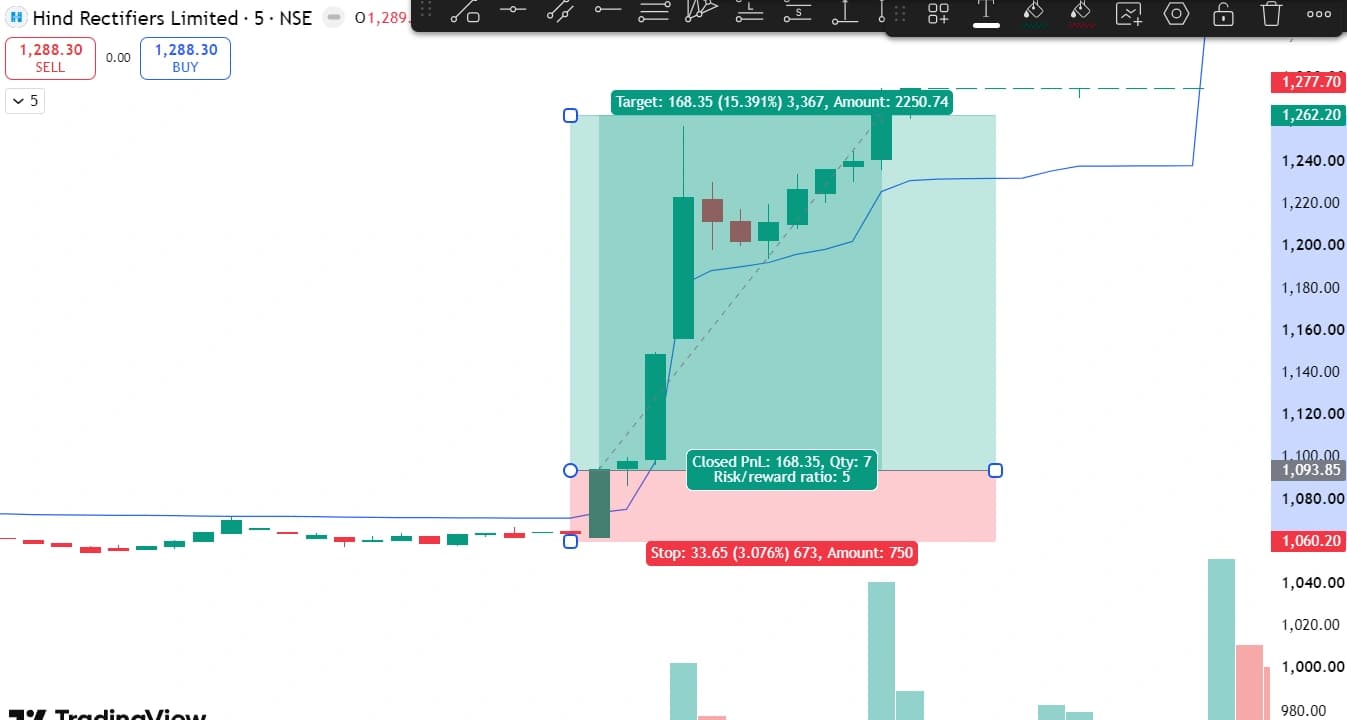
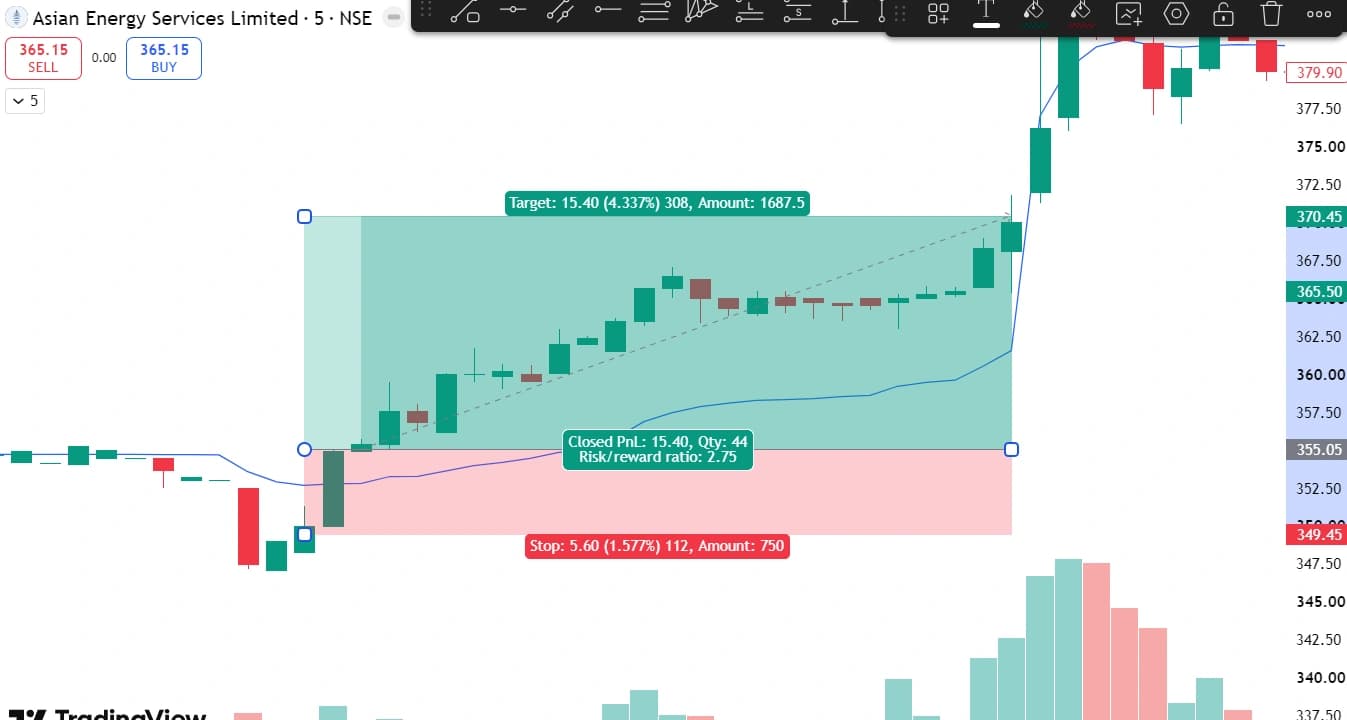
The VWAP intraday trading strategy uses the Volume Weighted Average Price as a dynamic reference line. Institutional traders use VWAP as a benchmark, which makes it a self-fulfilling intraday level. Price above VWAP signals bullish intraday bias. Price below VWAP signals bearish bias.
Entry Rules
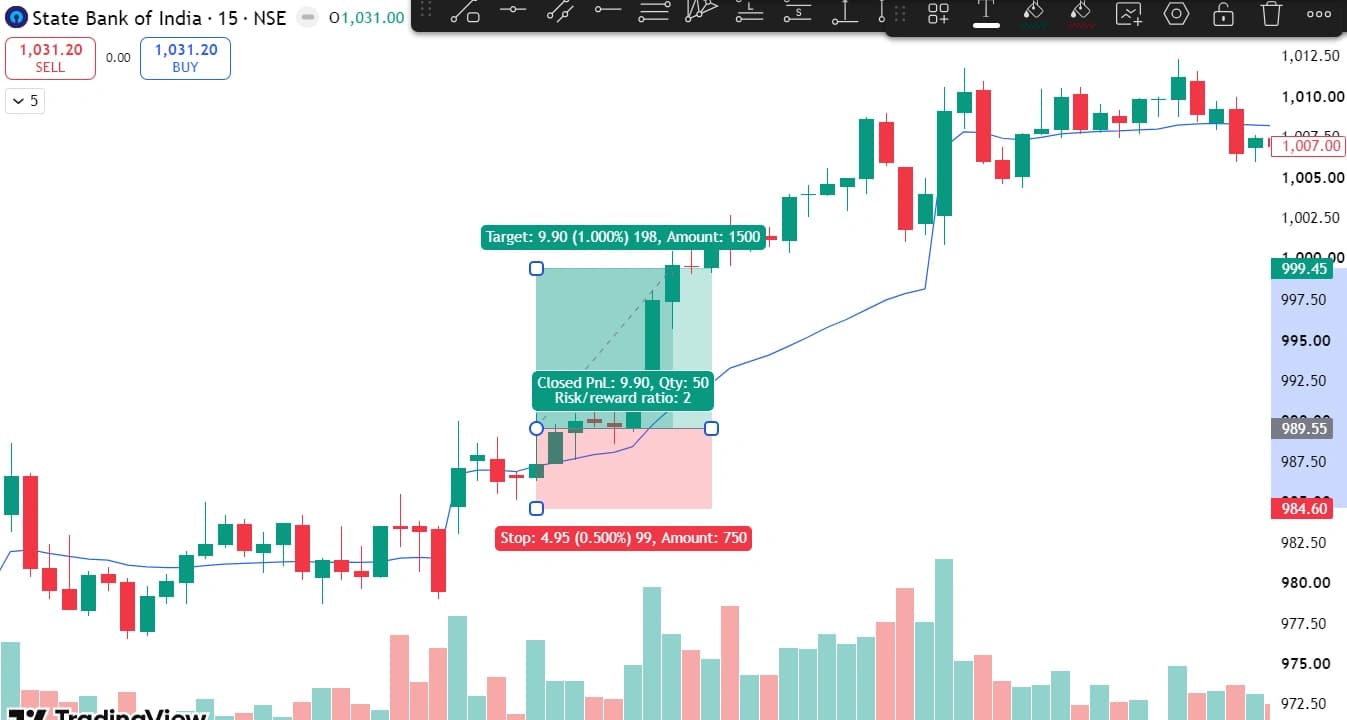
Long Setup:
SETUP:      Price was trading below VWAP earlier
            in the session

TRIGGER:    5-min candle closes ABOVE VWAP
            with RISING volume on that candle

ENTRY:      Close of the breakout candle

STOP LOSS:  Below VWAP (use 5–10 point buffer)

TARGET:     Next intraday resistance level
            Minimum 1:2 R:R required
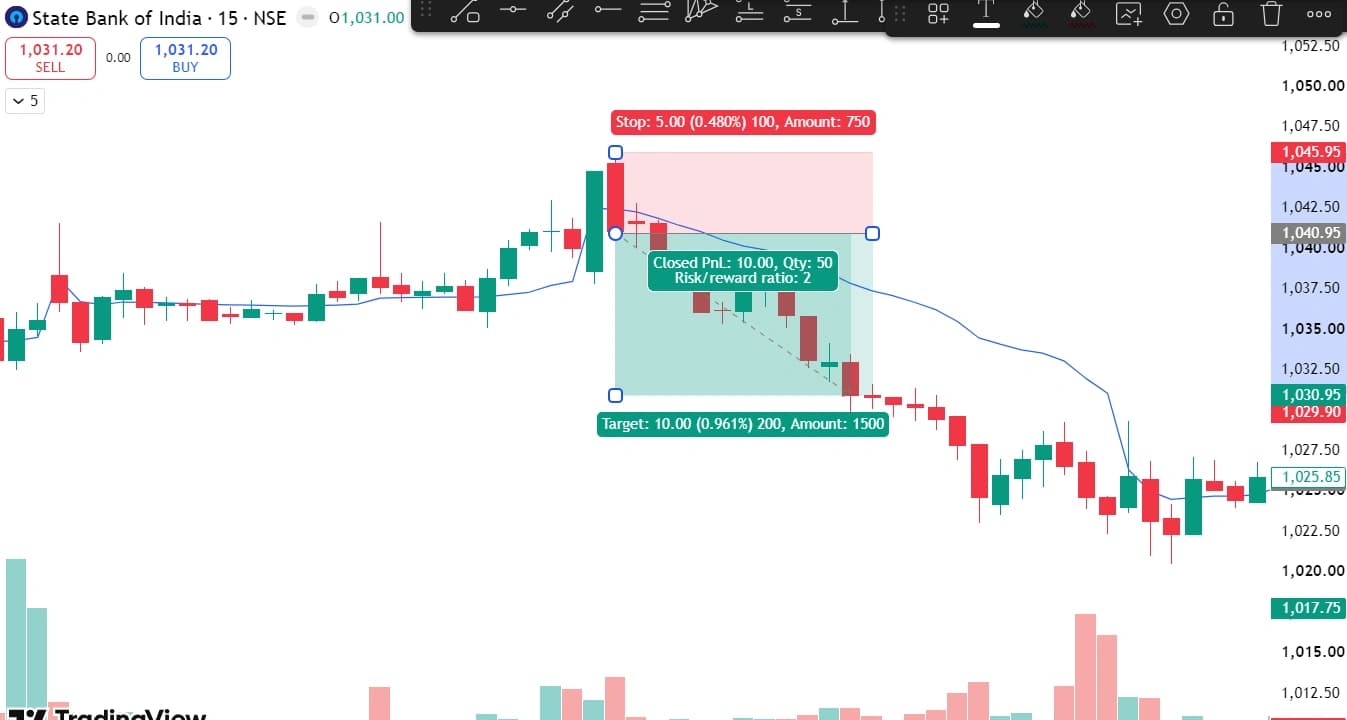
Short Setup:
TRIGGER:    5-min candle closes BELOW VWAP
            with rising volume

ENTRY:      Close of the breakdown candle

STOP LOSS:  Above VWAP

TARGET:     Next intraday support level
Key Rules
- Rising volume on the breakout candle is non-negotiable — see our volume analysis guide for how to read confirmation vs. noise
- Do not trade VWAP setups in the first 15 minutes
- The cleanest VWAP breakouts happen when the broader index is also above/below its own VWAP in the same direction
Intraday Trading Strategy 3: 5 EMA / 15 EMA Rejection
The EMA rejection intraday trading strategy uses the 5-period and 15-period Exponential Moving Averages as dynamic support and resistance within a trending move. The critical filter that separates this from random EMA touches is the 45-degree angle requirement — both EMAs must be sloping steeply to confirm genuine trend momentum.
The 45-Degree Angle Filter
BULLISH TREND:   5 EMA above 15 EMA
                 Both EMAs sloping upward at ~45 degrees
                 (steep slope = strong trend)

BEARISH TREND:   5 EMA below 15 EMA
                 Both EMAs sloping downward at ~45 degrees

IF EMAs are FLAT — skip. No trade.
Flat EMAs = choppy, range-bound market.
This strategy does not work in sideways conditions.
Entry Rules
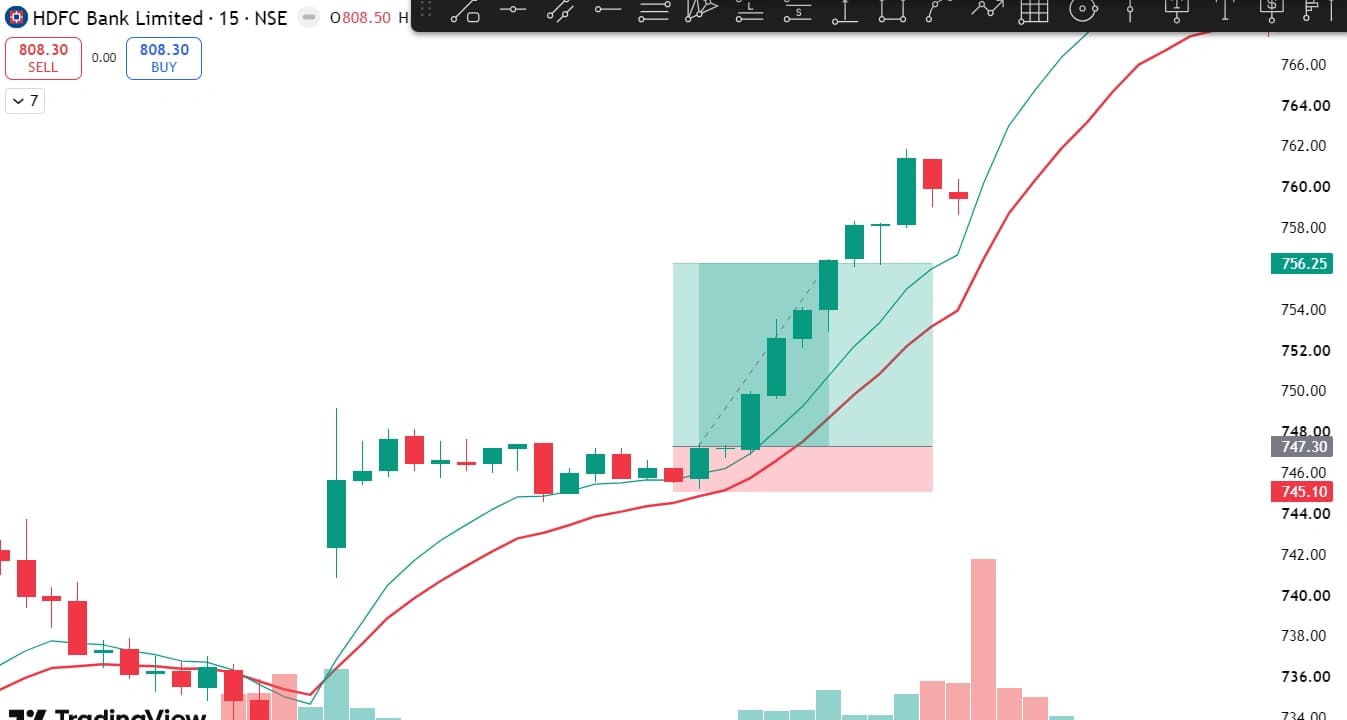
Long Setup:
SETUP:      5 EMA above 15 EMA, both at 45 degrees
            Price pulls back and touches the 5 EMA
            or 15 EMA from above

TRIGGER:    Rejection candle forms at the EMA —
            hammer, bullish engulfing, or pin bar

ENTRY:      Above the HIGH of the rejection candle

STOP LOSS:  Below the LOW of the rejection candle

TARGET:     Minimum 1:2 R:R
            Extended: prior swing high
Short Setup:
SETUP:      5 EMA below 15 EMA, both at 45 degrees
            Price rallies back to the 5 EMA or 15 EMA

TRIGGER:    Shooting star, bearish engulfing, or pin bar

ENTRY:      Below the LOW of the rejection candle

STOP LOSS:  Above the HIGH of the rejection candle

TARGET:     Minimum 1:2 R:R
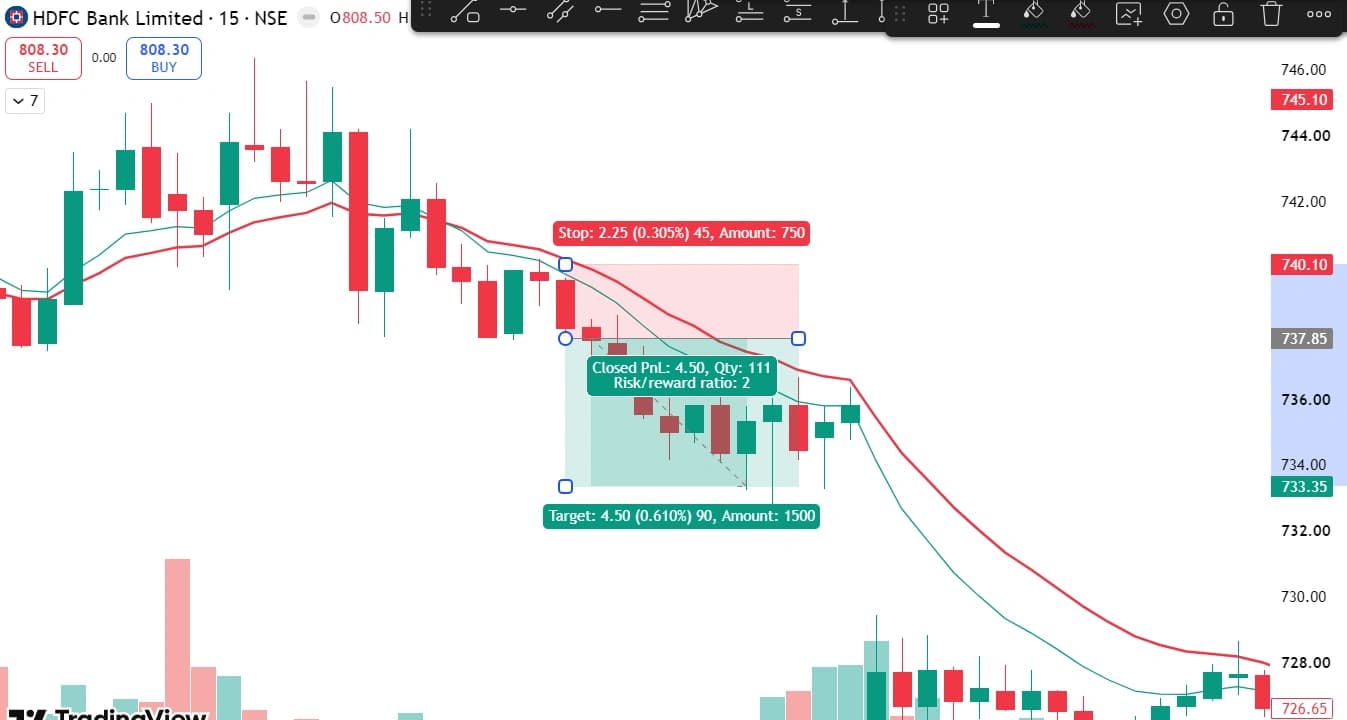
The rejection candle is what confirms the EMA is actually holding rather than just being touched in passing — a hammer or bullish engulfing on the long side, a shooting star or bearish engulfing on the short side. If you're not sure which pattern you're looking at, our complete candlestick pattern guide covers identification rules for all of them.
Key Rules
- Works on both 5-minute and 15-minute charts
- If price closes BELOW the 15 EMA on a long setup — the trend has changed, exit
- The 45-degree angle is a visual judgment — when in doubt, skip
Intraday Trading Strategy 4: Bollinger Band Reversal
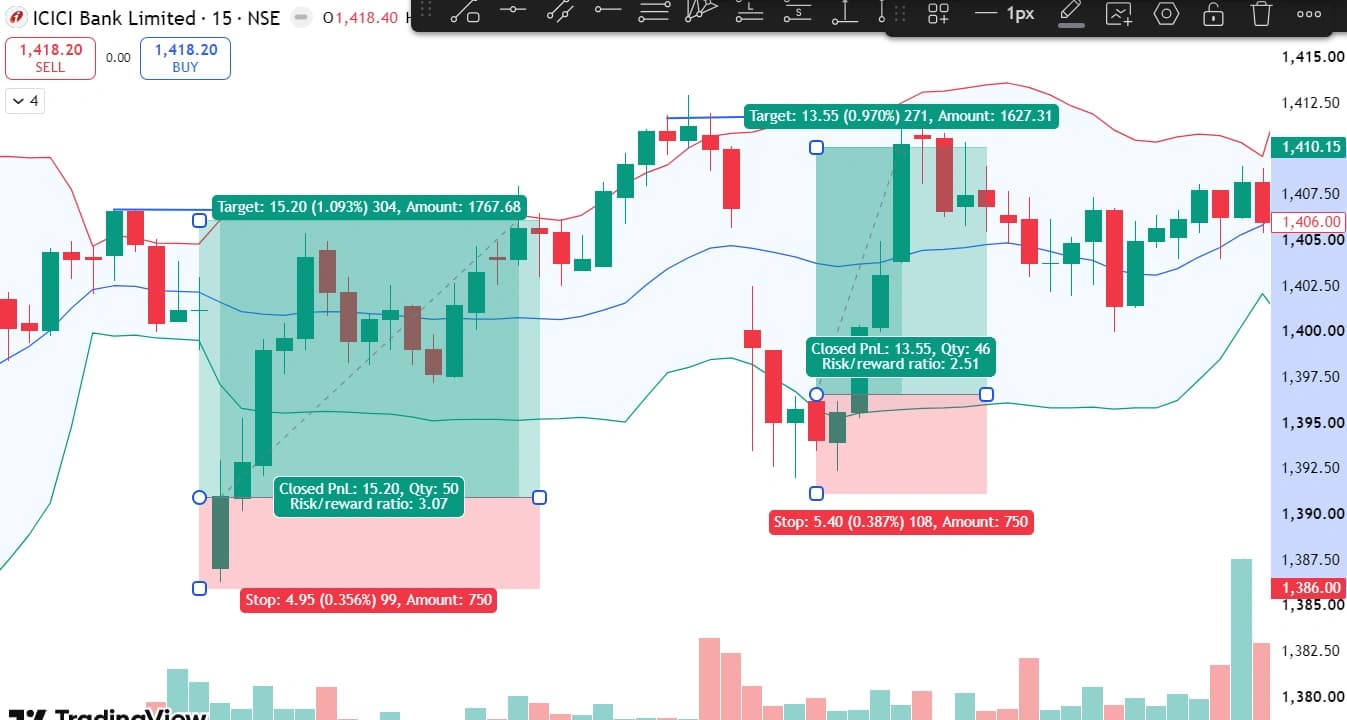
The Bollinger Band intraday trading strategy uses specific settings: 20-period, 1.5 standard deviations on the 15-minute chart. The tighter 1.5 setting is more responsive for intraday use than the default 20,2 — for the full breakdown of settings, squeeze breakouts, and band-walk continuation, see our Bollinger Bands trading strategy guide.
Entry Rules
Long Setup:
SETTINGS:   Bollinger Band — Period 20, StdDev 1.5
TIMEFRAME:  15-minute chart

SETUP:      Price pulls back toward the LOWER band

TRIGGER:    One of these reversal candles forms:
            ✓ Green (bullish) candle
            ✓ Hammer
            ✓ Bullish Engulfing

CRITICAL FILTER:
            The HIGH of the entry candle must be
            ABOVE the lower Bollinger Band.
            If the entire candle (including the high)
            sits BELOW the band — SKIP. Price is in
            breakdown, not bounce.

ENTRY:      Above the HIGH of the reversal candle

STOP LOSS:  Below the LOW of the reversal candle

TARGET:     Middle band (20-MA) = first target
            Upper band = extended target
            Minimum 1:2 R:R before entry
Short Setup:
SETUP:      Price rallies to the UPPER band

TRIGGER:    Red candle, Shooting Star,
            or Bearish Engulfing at upper band

CRITICAL FILTER:
            LOW of entry candle must be BELOW
            the upper band — not the entire candle
            sitting above it

ENTRY:      Below the LOW of the reversal candle
STOP LOSS:  Above the HIGH
TARGET:     Middle band — lower band
Key Rules
- The "high not touching lower band" filter is the most important rule in this strategy — it prevents entering stocks in sustained breakdown
- If the candle body is entirely outside the band, the stock is too extended — skip it
- Middle band (20-MA) is always the first profit-taking reference
Intraday Trading Strategy 5: Candlestick Pattern at Previous Day Support / Resistance
The support and resistance intraday trading strategy uses the previous day's high and low as the primary structural reference levels. These are among the most reliable intraday levels because they represent where institutional order flow made its defining decisions in the prior session — for the broader concept beyond just PDH/PDL, see our complete support and resistance guide.
Previous Day High (PDH) — Acts as RESISTANCE today
Previous Day Low  (PDL) — Acts as SUPPORT today
Entry Rules
Long Setup at Previous Day Low (Support):
SETUP:      Today's price reaches or approaches PDL

TRIGGER:    Reversal candle forms at PDL on 15-min chart
            ✓ Bullish Engulfing
            ✓ Hammer
            ✓ Pin Bar (long lower wick, close above PDL)

ENTRY:      Above the HIGH of the confirmation candle

STOP LOSS:  Below the LOW of the confirmation candle
            (use the lower of: candle low or PDL itself)

TARGET:     PDH (previous day high) = ideal target
            Or next intraday resistance if PDH is far
            Minimum 1:2 R:R before entry
Short Setup at Previous Day High (Resistance):
SETUP:      Price rallies to or approaches PDH

TRIGGER:    Reversal candle at PDH on 15-min chart
            ✓ Bearish Engulfing
            ✓ Shooting Star
            ✓ Pin Bar (long upper wick rejecting PDH)

ENTRY:      Below the LOW of the confirmation candle

STOP LOSS:  Above the HIGH of the confirmation candle

TARGET:     PDL (previous day low) or next support
Key Rules
- Confirmation candle must form within close proximity to the PDH or PDL — not at a random level far from it
- Volume on the confirmation candle should be above average
- If price gaps open above PDH — the resistance is already cleared, PDH is not relevant as resistance that session
- Mark PDH and PDL before the market opens every morning as part of pre-market preparation
Intraday Trading Strategy Comparison at a Glance
| # | Strategy | Timeframe | Entry Trigger | Stop Loss | Accuracy |
|---|---|---|---|---|---|
| 1 | Opening Range Breakout | 5-min (after 9:30) | Close above/below 15-min candle H/L | 15-min candle H or L | 40% |
| 2 | VWAP Breakout | 5-min | Close above/below VWAP + rising volume | Below/above VWAP | 65% |
| 3 | EMA Rejection | 5-min or 15-min | Rejection candle at 5/15 EMA (45° slope) | Below/above candle | 55% |
| 4 | Bollinger Band | 15-min | Reversal candle near band (high above band) | Below/above candle | 60% |
| 5 | PDH/PDL Candle | 15-min | Reversal candle at prior day H or L | Beyond candle extreme | 50% |
Note: These accuracy figures are for each strategy traded on a random, unfiltered NSE stock. VWAP Breakout is the standout — and when paired with the Dhanith Intraday Screener to pre-filter for high-momentum stocks before the trigger even forms, its accuracy can climb as high as 80%. The setup only works as well as the stock it's applied to; a screener that pre-selects for momentum is what closes that gap.
How to select Stocks for Intraday Trading
NSE has over 2,000 listed stocks. These five strategies will form valid setups across multiple stocks every single session. Manually scanning 2,000 charts before 9:15 AM is not realistic.
This is where a stock screener becomes essential — not optional.
Using the Dhanith Stock Screener
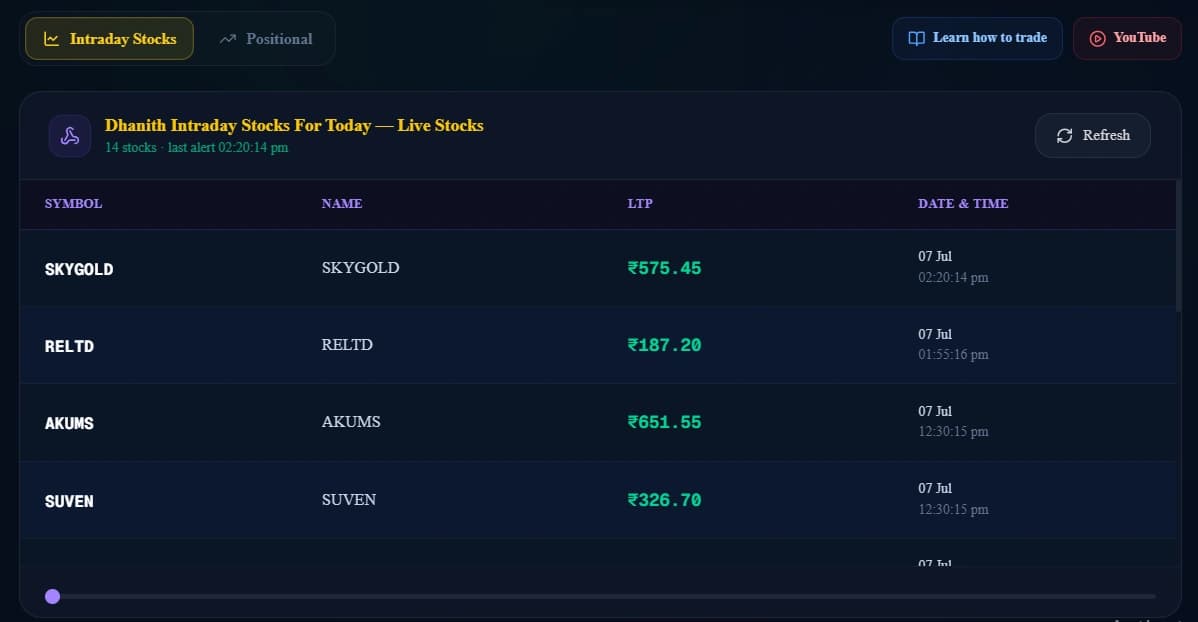
The Dhanith Stock Screener is built specifically for NSE intraday and swing traders — see how to trade Dhanith Intraday Screener stocks for the full step-by-step walkthrough. It surfaces stocks showing the momentum and structural conditions that align with these five strategies, with liquidity filters applied so every stock on the list has adequate volume for clean entries and exits.
Pre-market workflow using the Dhanith Screener:
Step 1: Open the Dhanith Screener before 9:00 AM
Step 2: Run the scan — get a focused watchlist of
        8–15 stocks for today's session
Step 3: For each stock, check which strategy applies:
        ✓ Where is price relative to VWAP?
        ✓ Where is the 15-min candle range forming?
        ✓ Are EMAs at 45 degrees?
        ✓ Is price near yesterday's PDH or PDL?
Step 4: Pre-mark entry, stop loss, and target
        for each applicable setup
Step 5: Wait for the trigger — never chase
This pre-market workflow — screener at 9:00 AM, strategy mapping by 9:10 AM, watching for triggers from 9:30 AM — is how disciplined intraday traders structure every session.
Dhanith Intraday Screener
Build your watchlist in 30 seconds.
Automatically scan NSE stocks by turnover, gap percentage, sector momentum, and volume — so your pre-market checklist is ready before 9:00 AM.
Risk Management Rules — Apply to All 5 Strategies
1. Risk maximum 1% of account per trade
   ₹1,00,000 account = ₹1,000 maximum risk per trade

2. Minimum 1:2 R:R before every entry
   No 1:2 = no trade, regardless of how good it looks

3. Maximum 3 trades per day
   Stop after 2 consecutive losses

4. All positions closed before 3:15 PM
   No exceptions

5. Never move stop loss farther away
   If stopped out — log the trade, move on

6. No trading in the first 15 minutes
   9:15–9:30 AM is observation only
For the complete system behind these six rules — position sizing, daily loss limits, and the psychology of sticking to them — see 25 Trading Risk Management Rules Every Trader Must Follow and Best Risk Reward Ratio for Day Trading.
Which Strategy to Start With
If you are new to intraday trading, start with Strategy 5 — PDH/PDL Candlestick. It requires no real-time indicator monitoring. Mark two levels before the open, wait for a reversal candle at one of them.
Once consistent with that, add Strategy 1 — ORB. Two strategies, clear signals, minimal complexity.
Then add Strategy 2 — VWAP. Requires understanding of how VWAP evolves through the session.
Strategies 3 and 4 (EMA and Bollinger Band) add the most complexity and work best once you have 2–3 months of consistent experience with the first two. Building that kind of consistency is as much a discipline problem as a strategy problem — see How to Become a Disciplined Trader if execution, not strategy selection, is what's holding you back.
Log every trade — entry, stop, target, exit, R:R, and emotional state — so you know which of the 5 strategies actually produces your best results.
Dhanith Trading Journal
Track every trade. Find your real edge.
Log your setups, grade your entries, and review your trading patterns — all in one place. The journal built for serious SMC traders.
Final Thoughts
The 5 best intraday trading strategies covered here — ORB, VWAP Breakout, EMA Rejection, Bollinger Band Reversal, and PDH/PDL Candlestick — share one thing: they are each based on a specific, measurable trigger, not a feeling.
They do not require predicting the market. They require patience — waiting for the setup to come to you, applying the entry rules exactly, placing the stop before entry, and closing all positions before 3:15 PM.
The Dhanith Stock Screener solves the stock selection problem. These five strategies solve the entry timing problem. Risk management rules solve the position sizing problem.
Pick one strategy. Run it for 50 trades. Journal every single one. Then let the data tell you what to do next.
Disclaimer: This blog is for educational purposes only and does not constitute financial or investment advice. Intraday trading in NSE equities and F&O involves substantial risk of capital loss. Always use stop losses, proper position sizing, and consult a SEBI-registered advisor before trading with real capital.
FAQ
Q: What is the best intraday trading strategy for beginners in India? The best starting point is the Previous Day High/Low Candlestick strategy — it requires no real-time indicators, only marking two levels before the open and waiting for a reversal candle. Once consistent with that, add the Opening Range Breakout as the second strategy.
Q: What timeframe works best for NSE intraday trading? The 15-minute chart produces the most reliable signals for all five strategies. It generates fewer but higher-quality setups than the 5-minute chart. Use the 5-minute chart for ORB and VWAP entry confirmation after identifying the setup on the 15-minute chart.
Q: What Bollinger Band settings should I use for intraday? Use 20-period, 1.5 standard deviations on the 15-minute chart. The tighter 1.5 setting fires more responsive signals for intraday timeframes compared to the default 20,2. Always verify that the reversal candle's high is above the lower band before entering.
Q: How do I find the right stocks for intraday trading strategies? Use a pre-built screener like the Dhanith Stock Screener before 9:15 AM to get a focused watchlist of 8–15 NSE stocks with adequate liquidity and momentum conditions. Manually scanning 2,000+ NSE stocks is not practical before market open.
Q: How many intraday trades should I take per day? Maximum 3 trades per day. Stop after 2 consecutive losses. Quality consistently outperforms quantity — more trades means more commissions, more cognitive fatigue, and a higher rate of rule-breaking entries.
Related Articles
| Article | How It Connects |
|---|---|
| Intraday Trading Rules You Must Follow | The 10 non-negotiable rules that govern how these five strategies are actually executed |
| Best Intraday Stocks Trading Strategy — 920 Signal Data | Real screener data on which NSE stocks and hours produce the best intraday moves |
| Best Risk Reward Ratio for Day Trading | The 1:2 minimum R:R applied to all five strategies here |
| How to Become a Disciplined Trader | The behavioral framework for executing strategies without breaking rules |
| How to Become a Successful Intraday Trader | The full timeline and business mindset behind mastering these strategies |
| How Much Capital Is Required for Intraday Trading? | Position sizing math for the exact entries and stops used in these five strategies |
| 25 Trading Risk Management Rules | Complete risk system that protects these intraday setups |
| Best Online Trading Journal | Track every trade by strategy to identify your highest win-rate setup |
Have a question about this article?
Comment on our latest Instagram post or send us a DM — we reply to every one.
@dhanith_officialWas this article helpful?
Click to rate
Founder, Dhanith Trading
7+ years trading Nifty, Bank Nifty, NSE stocks, and commodities — specializing in Smart Money Concepts (SMC) and ICT price action. Founder of Dhanith — a trading journal, intraday screener, and risk tools platform built for retail traders.
Dhanith Newsletter
Enjoyed this article? Get more like it.
New trading guides, candlestick patterns, SMC strategies, and tool updates — straight to your inbox. Free, for Indian traders.
No spam. Unsubscribe anytime.
Continue Reading